


Bears remained at the helm as the benchmark Nifty 50 index shed 226.35 points (1.25 percent) on January 25. On the daily timeframe, the index remained below the 50-day exponential moving average, which confirms the bearish trend.
On the lower end, however, the drop was limited to the upper band of the falling wedge pattern on the daily chart. Sentiment looks very weak, with the RSI (relative strength index) in a bearish crossover.
The Nifty 50 ended at 17,891.95 on January 25. A further drop may occur if the index falls below 17,840. On the higher end, resistance is placed at 18,000.
The Nifty Bank index witnessed selling pressure throughout the session and ended at 41,647.65. On the daily chart, an upward consolidation was followed by a sharp fall, suggesting a rise in bearish bets in the space.
Furthermore, the index has dropped below the 50-day exponential moving average, confirming the downward trend. On the lower end, immediate support is visible at 41,500-40,800. On the higher end, resistance is visible at 42,000.
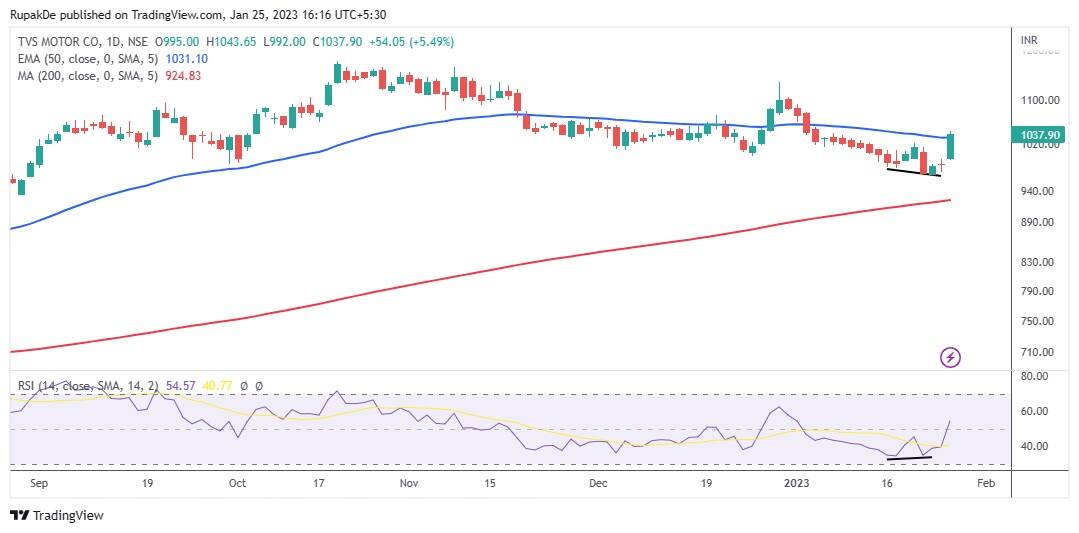
Here are two buy calls and one sell call for the short term:TVS Motor: Buy | LTP: Rs 1,038 | Stop-Loss: Rs 997 | Target: Rs 1,130 | Return: 9 percentThe stock has risen following a consolidation on the daily chart, confirming the increasing bullishness. Besides, the stock price has moved above the 50-day exponential moving average on the daily timeframe.
The daily RSI is in positive divergence. In the short term, the stock may rise to Rs 1,130. On the lower end, support is pegged at Rs 997.
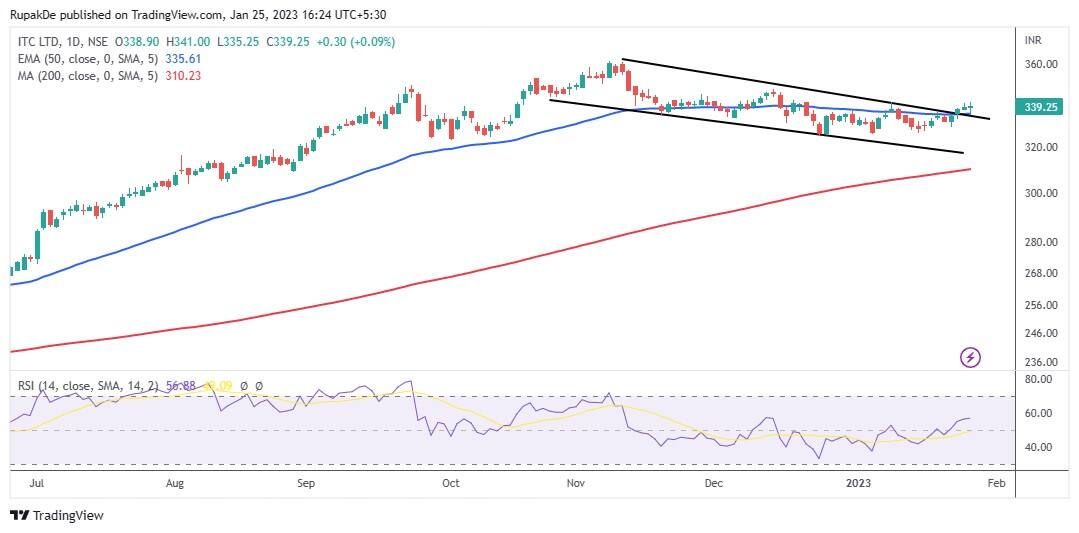
The stock has risen above the falling channel on the daily chart, suggesting increasing bullishness. Besides, the stock price has moved above the 50-day exponential moving average on the daily timeframe.
The daily RSI is in positive crossover. In the short term, the stock may rise to Rs 360. On the lower end, support is pegged at Rs 329.
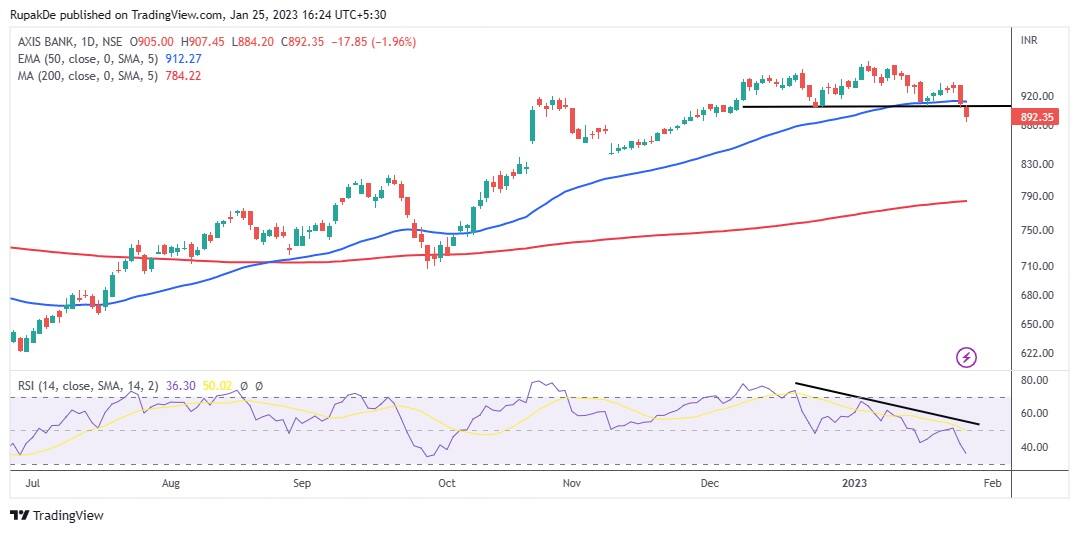
The stock has given a Head and Shoulder pattern breakdown on the daily chart, where the price is currently trading below the neckline. The recent correction has pushed the stock below the 50-day exponential moving average, confirming the bearish trend.
The RSI is in bearish crossover and falling. Over the short term, the trend is expected to remain weak. On the lower end, the price may drift towards Rs 845. On the higher end, it has resistance at Rs 926.

Discover the latest Business News, Sensex, and Nifty updates. Obtain Personal Finance insights, tax queries, and expert opinions on Moneycontrol or download the Moneycontrol App to stay updated!
Find the best of Al News in one place, specially curated for you every weekend.
Stay on top of the latest tech trends and biggest startup news.


