


Volatility is the key ingredient why we trade in Equity. Traders will not get any returns out of an asset if it is not volatile. Volatility, being so important to the characteristic of equities, is a key ingredient in equity options as well.
Before we jump into Implied Volatility, let us list down the elements used to calculate option premiums.
1. Stock Price
2. Strike Price
3. Time to Expiry
4. Interest Rate
5. Dividend Yield
6. Volatility
The first 5 factors in the calculation are already known, except for Volatility. Now, given that we already have options trading in the market, we already have the answer to the equation. If we input all 5 values and the answer, we can calculate the volatility input put into the equation to arrive at the Option premium.
Volatility thus calculated by back calculating it from the market value of Option Premium is called Implied Volatility. Now that we have defined it. Let us understand 3 main characteristics of Implied Volatility in particular.
1. Implied Volatility (IV) is expected Volatility during the life of the Option
2. IV is just like Volatility is range-bound. Think of IV as momentum vs the move. While distance can be 1000s of KM, speed will still be between 0- 200 km,
3. Because falls are faster than rises. Rising IV is always associated with a fall,l and falling IV is always associated with a Rise in the underlying equity or index.
The 3 characteristics are good enough to unveil the secret of the underlying equity. They say a picture is worth 1000 words. Please look at the following image.
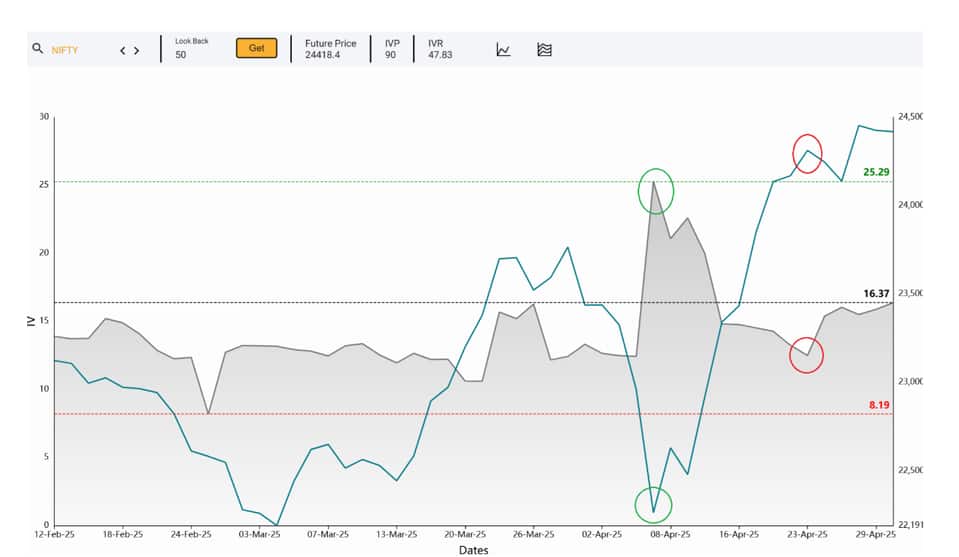
This is NIFTY IV and Nifty Future. Combining the characteristics 2 & 3 of IV we can draw some observations.
First, the moves in both the charts are more or less opposite. So much so that the highs in one are coinciding with the lows in the other.
For example, early April we can see the Grey Chart of IV made a high and Blue chart of Nifty Future mad a short-term low. Both of them continued in their own opposite directions respectively.
This proves the negative relationship between the 2. While in the middle of a trending move, this may not be the most visible, but there are 2 trend secrets that one can make.
1. Reversals: Considering Nifty has been falling in the early part of April, one may not be able to say confidently how long the fall will last but we can still get a bit of a clue looking at the IV. A recent top in the IV can be used to get ready for the same.
Finally, we do not know even in the range-bound variable how high is too high. So, it is always advisable to wait for the IV to close with a drop for the day before we start the quest for bargain hunting.
2. Trend: For stocks that are consolidating, IV gives a good insight of trend. For example, falling IV in consolidating stock means, the expectation of volatility is low and so is the expectation of a fall after consolidation and vice-versa.

Discover the latest Business News, Sensex, and Nifty updates. Obtain Personal Finance insights, tax queries, and expert opinions on Moneycontrol or download the Moneycontrol App to stay updated!
Find the best of Al News in one place, specially curated for you every weekend.
Stay on top of the latest tech trends and biggest startup news.


