


Arpan Shah
Technical analysis is a vast subject and there are many techniques currently available but one of the oldest forms of technical analysis is the Dow Theory.
One of the basic theories to identify the trend in the market is the Dow Theory. What makes Dow Theory stand out is its simplicity and effectiveness.
The Dow Theory operates on efficient market hypothesis, which means asset price incorporate all available information and “the price discounts everything”.
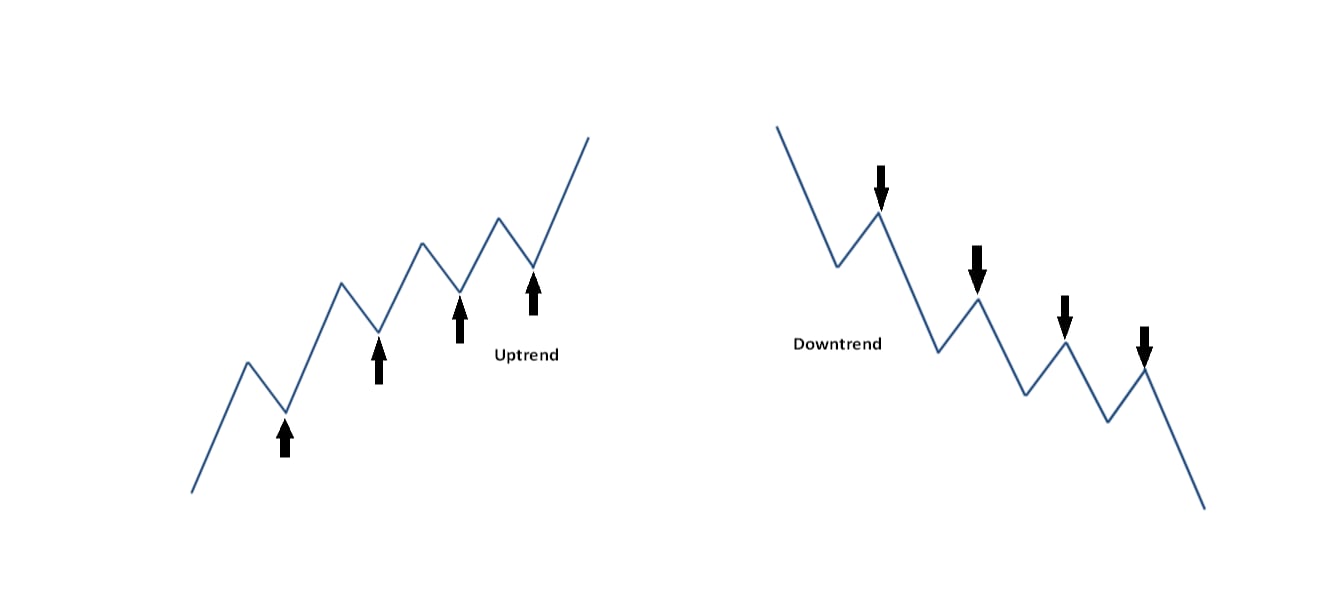
As per Dow Theory an asset price is called to be in uptrend till the time it keeps making higher top - higher bottom formation.
That means the current swing low should be higher than the previous swing low and it will keep making new high without breaching previous swing low.
The same way asset price is in down trend if the price keeps on making lower top-lower bottom formation. It means the current swing high should be lower than the previous swing high.
After the major downfall in the price if you are able to spot two consecutive higher bottoms on daily or weekly chart then it is a first sign of the trend change. If you are able to catch this change in the trend then you can catch a long rally in the market.
This trend will keep getting stronger as it keeps on making new higher tops and bottom with supportive volume. And, this trend exists until definitive reversal signs appear. Dow theory can be applicable to any liquid asset class preferably on higher time frame charts.
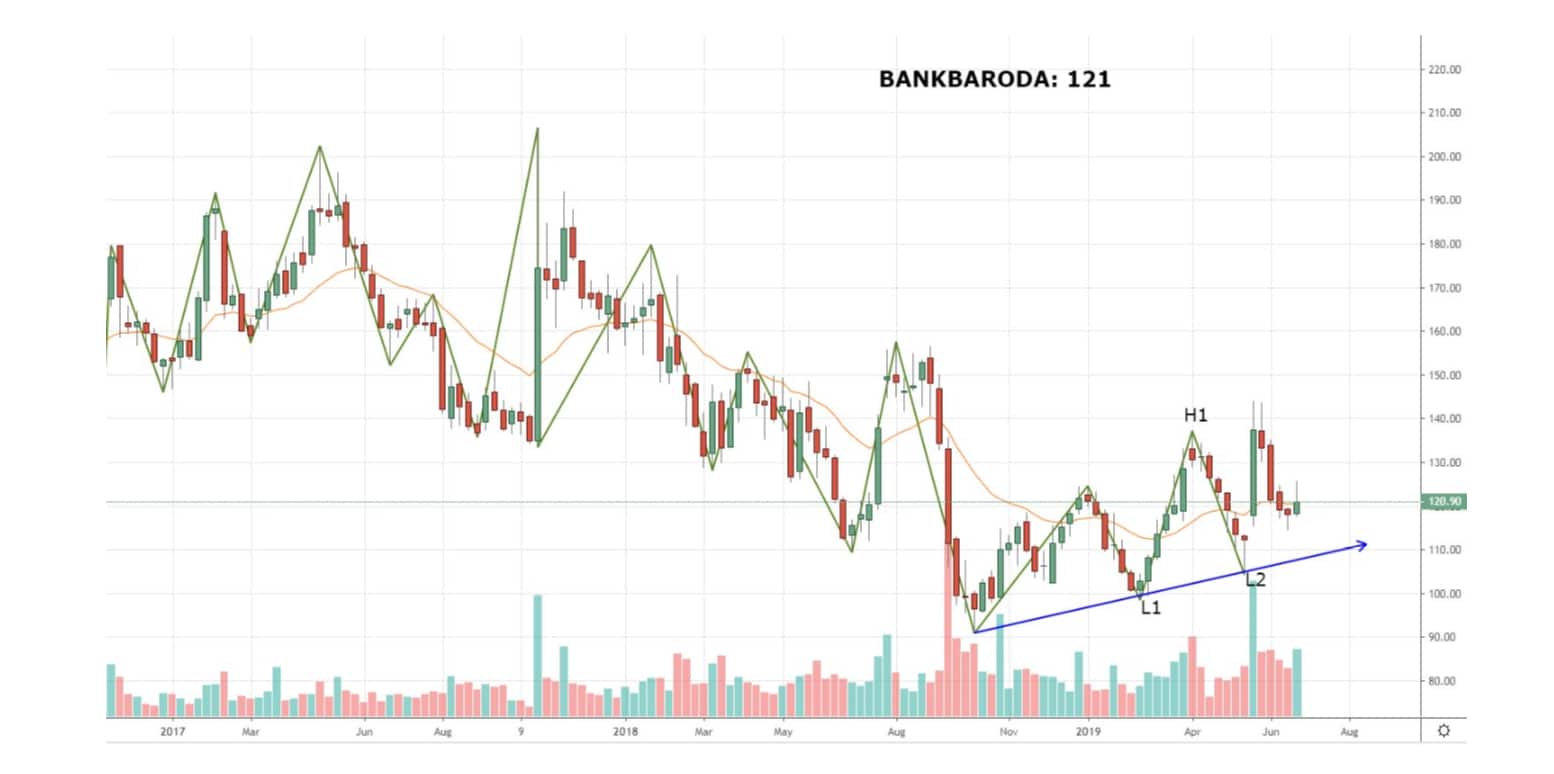
One such formation is visible on Bank of Baroda and it has started making higher top–higher bottom formation on weekly chart. Stock was in downward trend since last many months and every rally was getting sold with higher volumes. That downward rally started somewhere around 200 levels and it had reached till 90 levels in October 2018.
After making that low, stock has made 2 consecutive higher bottoms on weekly chart and it was able to hold previous lows with supportive volumes. It has recently reversed the trend and as it keeps on making higher low–higher bottom, trend will keep getting stronger on the upside. Trend will only reverse if it breaks below previous swing low of 104.
Disclaimer: The views and investment tips expressed by investment expert on Moneycontrol.com are his own and not that of the website or its management. Moneycontrol.com advises users to check with certified experts before taking any investment decisions.

Discover the latest Business News, Sensex, and Nifty updates. Obtain Personal Finance insights, tax queries, and expert opinions on Moneycontrol or download the Moneycontrol App to stay updated!
Find the best of Al News in one place, specially curated for you every weekend.
Stay on top of the latest tech trends and biggest startup news.


