


The market remained in a consolidative mode for yet another session with support at the 20-day EMA (exponential moving average) of 19,690 and the hurdle at 19,800 on the higher side, on October 16. Hence, considering the trend of last four days, the Nifty50 is expected to remain in the range of 19,600-19,850 for a few more sessions and the decisive breakout on either side of the range can give some confirmation, experts said.
The Nifty50 declined 19 points to 19,732 and remained in the previous day's range, while the BSE Sensex was down by 116 points at 66,167. However, the broader markets performed better than frontliners, as the Nifty Midcap 100 and Smallcap 100 indices gained 0.2 percent and 0.4 percent respectively.
Stocks that outpaced and fared far better than broader markets included GNFC, MCX India, and Deepak Fertilisers And Petrochemicals Corporation. GNFC shares rallied 5.4 percent to Rs 669 on the NSE and formed robust bullish candlestick pattern with minor upper and lower shadows on the daily charts, with strong volumes. The stock has seen a breakout of downward sloping resistance trendline adjoining highs of May 18 and September 14.
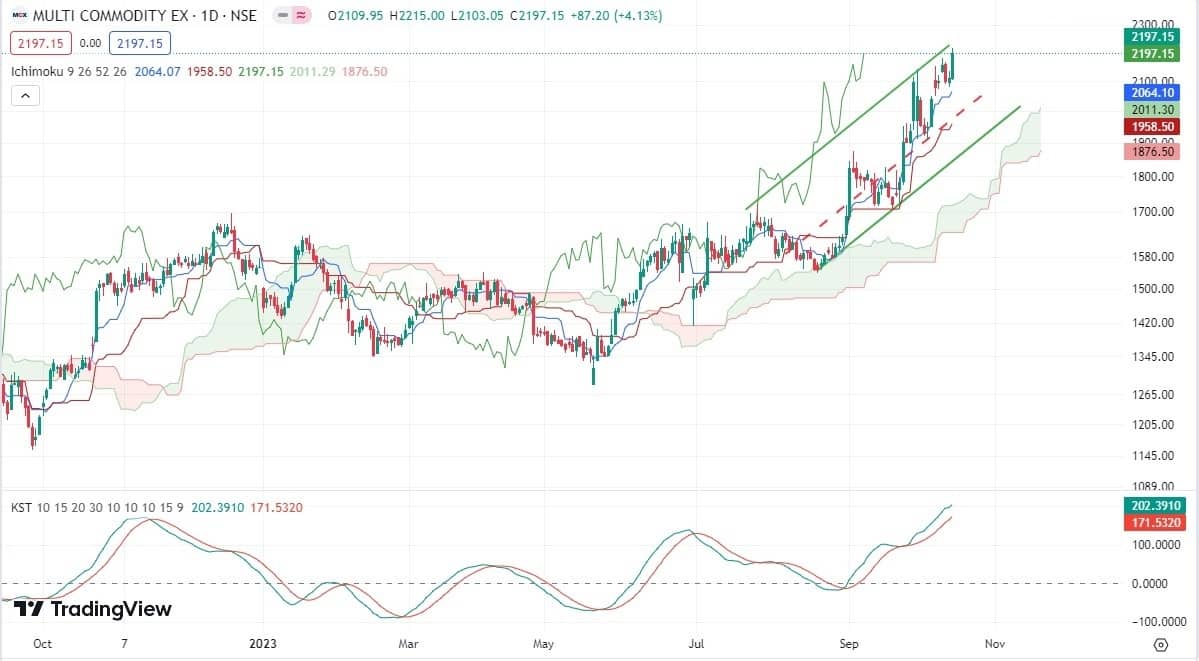
MCX India ended at record closing high of Rs 2,197, up more than 4 percent and formed long bullish candlestick pattern on the daily scale with above average volumes. It traded well above all key moving averages (20, 50, 100 and 200-day EMA). On the monthly charts, the stock has seen a horizontal resistance trendline breakout adjoining highs of October 2021 and September 2023, which is positive sign.
Deepak Fertilisers And Petrochemicals Corporation also saw a breakout of falling resistance trendline adjoining highs of December 30 last year, and September 11, 2023, and formed strong bullish candlestick pattern on the daily timeframe with robust volumes. The stock traded above all key moving averages, climbing higher for fifth consecutive session.
Here's what Ashish Kyal of Waves Strategy Advisors recommends investors should do with these stocks when the market resumes trading today:
Deepak Fertilisers And Petrochemicals Corporation
On the chart, we can see that after good consolidation, prices finally gave a break of the triangle pattern and also managed to stay above it which is a bullish sign. The stock is showing good reversal signal on upside.
Prices have managed to close above the blue and red lines of Ichimoku Cloud which is further positive sign. Momentum in the stock is likely to pick up in the coming days. Near term support is at Rs 655 with an immediate upside target of Rs 720 levels.
In short, Deepak Fertilizer looks positive for a move to Rs 720 levels.

Currently, the stock is moving up in an upward sloping channel. Momentum on the stock is good and is picking up. Stock is likely to be gaining more momentum once it breaks channel resistance of Rs 2,220 as it will have little or no resistance on the upside.
One should be using dips to accumulate the stock for a move to Rs 2,300 levels.
In short bullish momentum continues in the stock as long as support at Rs 2,079 is intact for a move to Rs 2,300 or higher levels.
Gujarat Narmada Valley Fertilisers & Chemicals (GNFC)
Fertilizers stocks were witnessing a rise since past one week due to Israel- Hamas war. On the daily chart, we can see that since October 10 not a single candle has closed below previous day's low which suggest strength in the ongoing trend.
Prices also gave a close above previous swing high which was near Rs 661 levels. On the above chart, we can see that prices have broken above the upper Bollinger bands. MACD (moving average convergence divergence) has also shown a positive crossover.
So, all the signs are suggesting that overall outlook for GNFC remains positive.
GNFC trend is positive for a move to Rs 710 and if the channel resistance is broken we can expect move to Rs 760 levels while on the downside Rs 645 can act as a near term support.

Discover the latest Business News, Sensex, and Nifty updates. Obtain Personal Finance insights, tax queries, and expert opinions on Moneycontrol or download the Moneycontrol App to stay updated!
Find the best of Al News in one place, specially curated for you every weekend.
Stay on top of the latest tech trends and biggest startup news.


