


Given the increasing bearish sentiment in the last couple of sessions, the Nifty50 is likely to break the 19,000 mark in coming sessions, while on the higher side, 19,300 can act as an immediate resistance, said experts who advised the strategy of sell on rise till the improvement in overall sentiment and the index getting into strong price action.
On October 25, the Nifty50 plunged 160 points to 19,122, and formed a long bearish candlestick pattern on the daily charts with a bearish crossover in the momentum indicator RSI (relative strength index), while the BSE Sensex was down by 523 points at 64,049.
But the same pressure was not seen in broader markets as the Nifty Midcap 100 and Smallcap 100 indices fell 0.65 percent and 0.24 percent respectively.
Stocks that bucked the trend included Amber Enterprises India, Tata Teleservices, and Tata Elxsi.
Amber Enterprises India climbed 6.5 percent to Rs 2,975 and formed a bullish candlestick pattern with upper & lower shadow on the daily charts, with healthy volumes. The stock got back above 20-day EMA (exponential moving average placed at Rs 2,937) as well as the 50-day EMA (Rs 2,843), but overall it has been in the consolidation range for several weeks now.
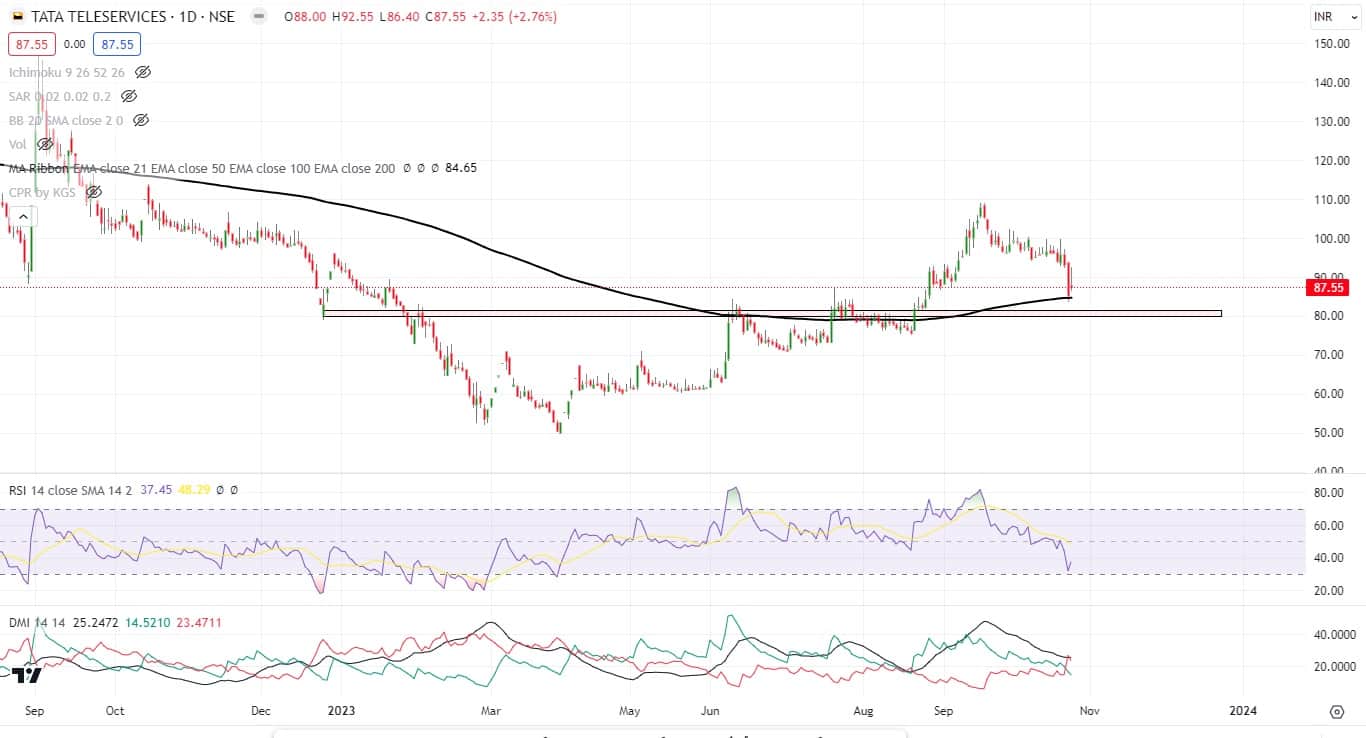
Tata Teleservices has formed a Doji kind of candlestick pattern on the daily scale after trading within the previous day's range. In the previous session, the stock formed a robust bearish candlestick pattern after a long time. The stock on Wednesday rose 2.8 percent to Rs 87.55, but the previous day's long range of Rs 83.50-93.95 may be important for further direction in the counter.
Tata Elxsi, after two long bearish candlestick patterns formation in previous sessions, has formed a long bullish candlestick pattern. While it resembles a Bullish Engulfing pattern, it's not an exact match. Notably, this bullish pattern was accompanied by above-average trading volumes and found support near the 50-day Exponential Moving Average (EMA) at approximately Rs 7,350. The stock climbed nearly 3 percent to Rs 7,545.
Here's what Jigar S Patel of Anand Rathi Shares & Stock Brokers recommends investors should do with these stocks when the market resumes trading today:
Since the last 40 trading sessions, the said counter has been trading in the range of Rs 2,900–3,100. Though the counter looks lucrative due to upside momentum in the previous trading session, one needs to be cautious as it has made a triple-top formation near Rs 3,100 levels.
On the indicator front, the daily RSI (relative strength index) has made a bear divergence where price action made higher highs and RSI made lower tops. One should book profit in the range of Rs 2,900–3,100 and avoid fresh long.
It has corrected approximately 25 percent since reaching a high near Rs 110 on September 15, 2023. At the current juncture, it has taken support near the 200 daily exponential average, i.e., Rs 85 levels, which is also the previous swing high.
On the indicator, the daily RSI has made an impulsive structure near the oversold zone of 30, which is looking lucrative. One can buy in the range of Rs 84–87 with a target of Rs 100, and the stop-loss would be Rs 78 on a daily close basis.
Since the last 2 months or so, the said counter has made a nice base near the 100-daily exponential average. At the current juncture, it is nicely placed near 21 DEMA.
On the indicator front, the daily RSI has reversed from 50 levels along with an ongoing positive cross on daily DMI's (directional movement index), which is looking lucrative.
Thus, one can buy in the range of Rs 7,500–7,600 with an upside target of Rs 7,850 and a stop-loss of Rs 7,375 on a daily close basis.
Disclaimer: The views and investment tips expressed by investment experts on Moneycontrol.com are their own and not those of the website or its management. Moneycontrol.com advises users to check with certified experts before taking any investment decisions.
Discover the latest Business News, Sensex, and Nifty updates. Obtain Personal Finance insights, tax queries, and expert opinions on Moneycontrol or download the Moneycontrol App to stay updated!
Find the best of Al News in one place, specially curated for you every weekend.
Stay on top of the latest tech trends and biggest startup news.


