


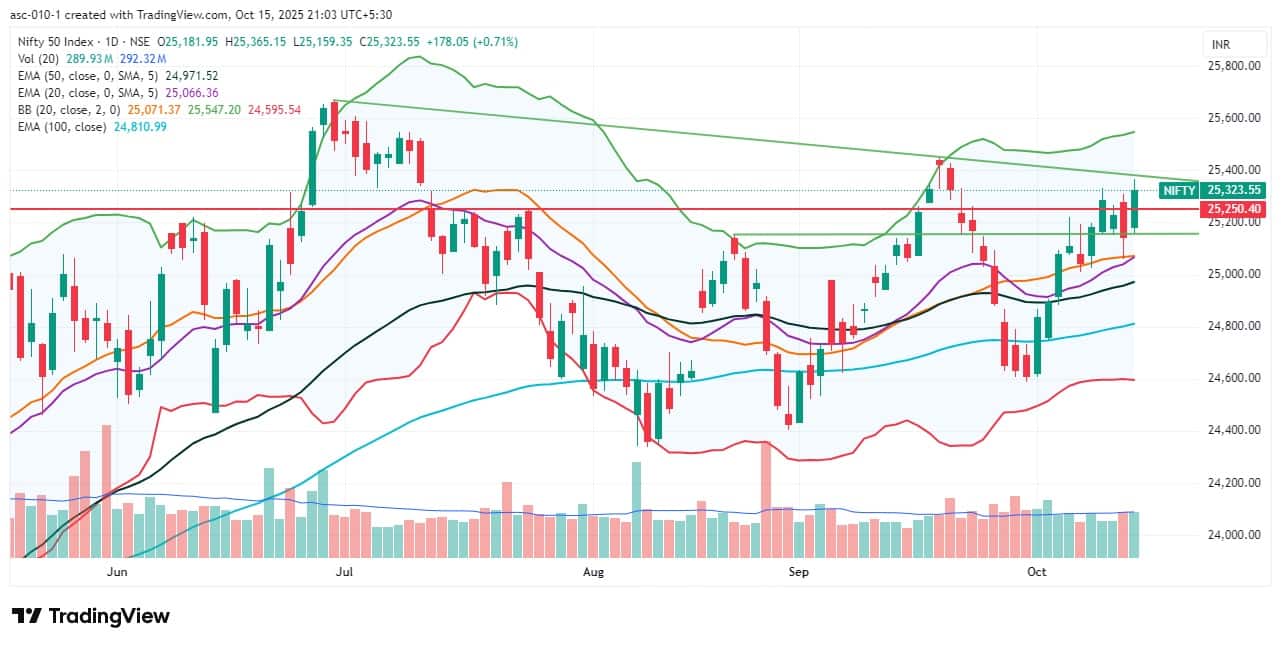
Bulls staged a strong comeback, driving the Nifty 50 higher by 0.71 percent on October 15, after a couple of days of consolidation. This took the index almost near the falling resistance trendline. The continuation of the higher high-higher low formation and healthy momentum indicators suggest that the index is gradually set to inch toward 24,400-24,500, the September swing high. Beyond that, 25,670 is the crucial hurdle to watch, which could open the door for a record high. However, 25,150 is expected to be immediate support, followed by 25,050, which forms the key support zone, according to experts.
Here are 15 data points we have collated to help you spot profitable trades:
1) Key Levels For The Nifty 50 (25,324)
Resistance based on pivot points: 25,361, 25,410, and 25,489
Support based on pivot points: 25,204, 25,155, and 25,077
Special Formation: The Nifty 50 formed a long bullish candle with minor upper and lower shadows on the daily timeframe, indicating a positive trend despite moderate volatility. The index sustained above all key moving averages, with the short- and medium-term moving averages trending upward. The RSI climbed above the 60 zone to 60.49, while the MACD sustained its bullish crossover, with the histogram turning strong. All these factors indicate a continued positive outlook.
2) Key Levels For The Bank Nifty (56,800)
Resistance based on pivot points: 56,903, 57,004, and 57,169
Support based on pivot points: 56,574, 56,472, and 56,307
Resistance based on Fibonacci retracement: 57,628, 58,735
Support based on Fibonacci retracement: 56,129, 55,639
Special Formation: The Bank Nifty also had a strong bounce back after a day of consolidation, completing the 78.6 percent Fibonacci retracement from the record high (July) to the September low. This resulted in the formation of a bullish candle on the daily charts, signalling a positive trend. The banking index saw a half percent rally and sustained well above all key moving averages, which were trending northward. Meanwhile, the momentum indicators—RSI and MACD—showed a positive bias. All these factors suggest a continuation of the upward movement.

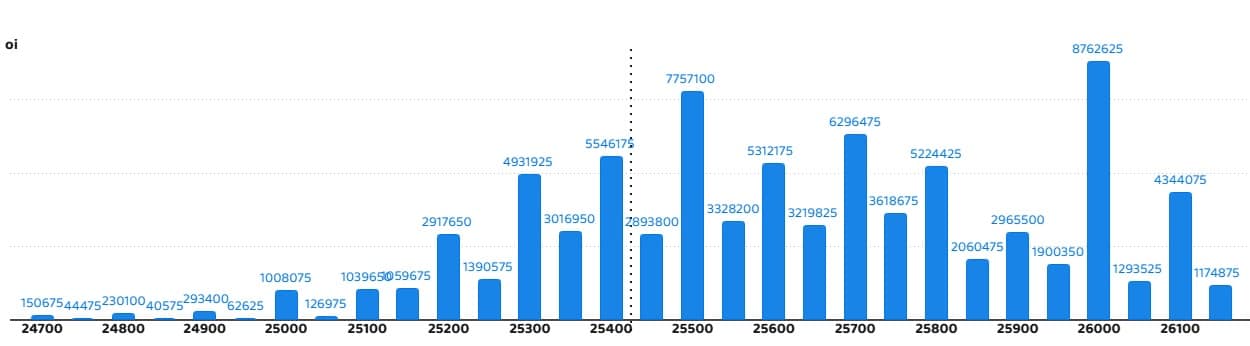
According to the weekly options data, the maximum Call open interest was seen at the 26,000 strike (with 87.62 lakh contracts). This level can act as a key resistance for the Nifty in the short term. It was followed by the 25,500 strike (77.57 lakh contracts), and the 25,700 strike (62.96 lakh contracts).
Maximum Call writing was observed at the 25,700 strike, which saw an addition of 30.36 lakh contracts, followed by the 25,750 and 25,600 strikes, which added 21.09 lakh and 20.21 lakh contracts, respectively. The maximum Call unwinding was seen at the 25,200 strike, which shed 32.59 lakh contracts, followed by the 25,250 and 25,100 strikes, which shed 12.56 lakh and 9.06 lakh contracts, respectively.
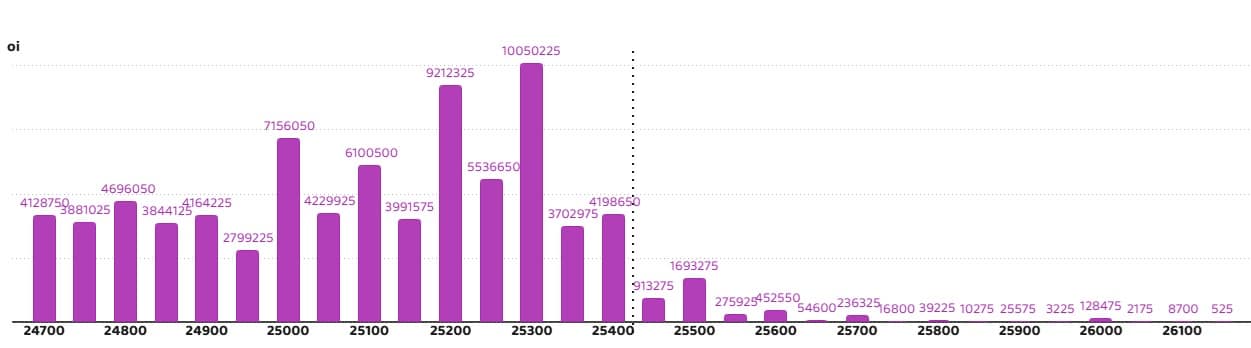
On the Put side, the 25,300 strike holds the maximum Put open interest (with 1 crore contracts), which can act as a key support level for the Nifty. It was followed by the 25,200 strike (92.12 lakh contracts) and the 25,000 strike (71.56 lakh contracts).
The maximum Put writing was placed at the 25,300 strike, which saw an addition of 79.4 lakh contracts, followed by the 25,200 and 25,250 strikes, which added 56.96 lakh and 48.16 lakh contracts, respectively. There was hardly any Put unwinding seen in the 24,700-26,150 strike band.
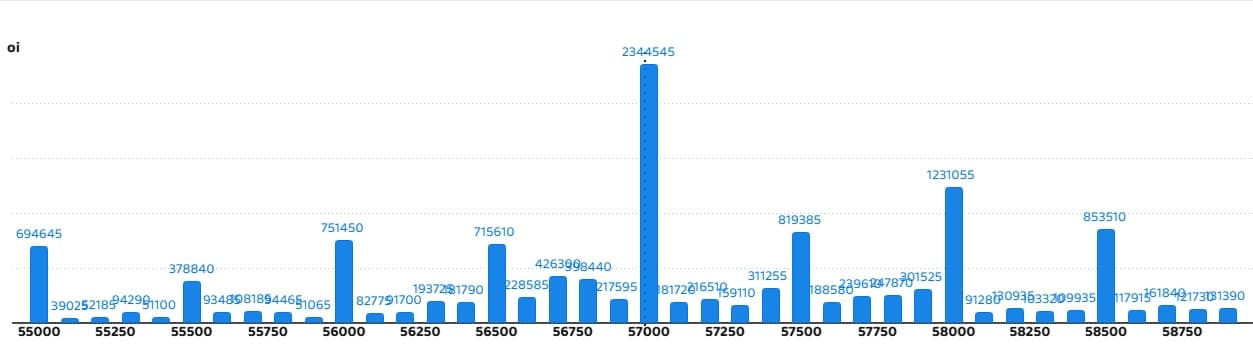
5) Bank Nifty Call Options Data
According to the monthly options data, the 57,000 strike holds the maximum Call open interest, with 23.44 lakh contracts. This can act as a key resistance level for the index in the short term. It was followed by the 58,000 strike (12.31 lakh contracts) and the 58,500 strike (8.53 lakh contracts).
Maximum Call writing was observed at the 57,400 strike (with the addition of 1.87 lakh contracts), followed by the 57,900 (1.8 lakh contracts) and 58,500 strike (95,095 contracts). The maximum Call unwinding was seen at the 56,500 strike, which shed 2.92 lakh contracts, followed by the 56,600 and 56,400 strikes, which shed 1.89 lakh and 72,240 contracts, respectively.
6) Bank Nifty Put Options Data
On the Put side, the maximum Put open interest was seen at the 57,000 strike (with 18.14 lakh contracts), which can act as a key level for the index. This was followed by the 55,000 strike (15.38 lakh contracts) and the 56,000 strike (12.99 lakh contracts).
The maximum Put writing was placed at the 57,000 strike (which added 3.71 lakh contracts), followed by the 56,400 strike (2.21 lakh contracts) and the 56,300 strike (2.06 lakh contracts). The maximum Put unwinding was seen at the 56,100 strike which shed 27,650 contracts, followed by the 55,800 and 55,200 strikes, which shed 5,880 and 1,820 contracts, respectively.

The Nifty Put-Call ratio (PCR), which indicates the mood of the market, climbed to 1.21 on October 15, compared to 0.91 in the previous session.
The increasing PCR, or being higher than 0.7 or surpassing 1, means traders are selling more Put options than Call options, which generally indicates the firming up of a bullish sentiment in the market. If the ratio falls below 0.7 or moves towards 0.5, then it indicates selling in Calls is higher than selling in Puts, reflecting a bearish mood in the market.

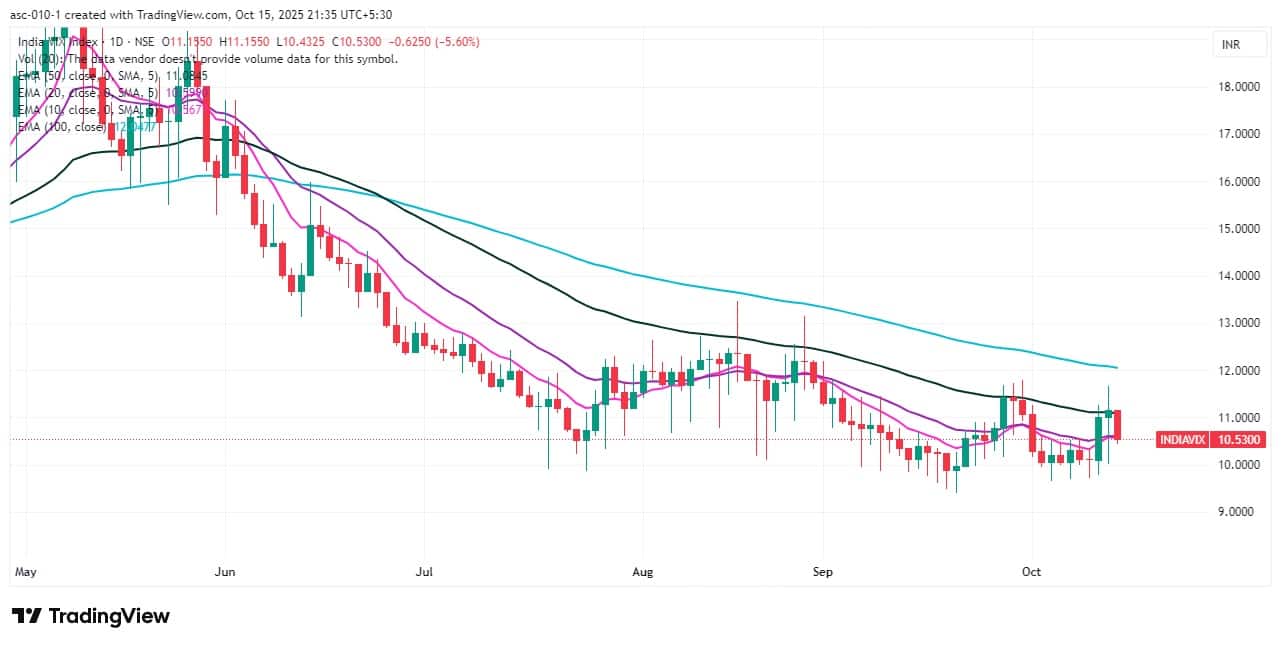
9) India VIX
The India VIX, also known as the fear gauge, fell by 5.6 percent to 10.53 after trending upward in the previous couple of sessions. It dropped below short-term moving averages, signalling comfort for the bulls.
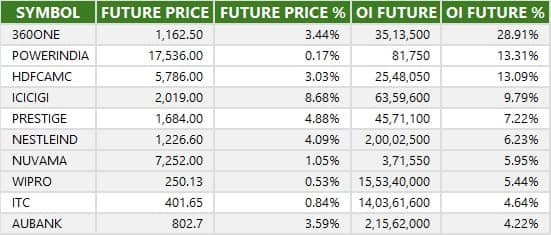
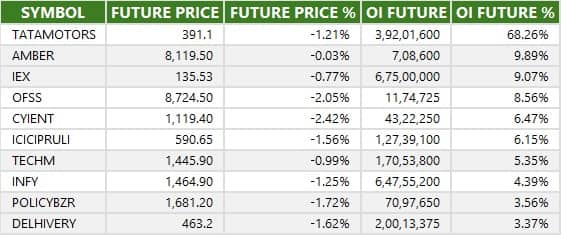
A long build-up was seen in 85 stocks. An increase in open interest (OI) and price indicates a build-up of long positions.
3 stocks saw a decline in open interest (OI) along with a fall in price, indicating long unwinding.
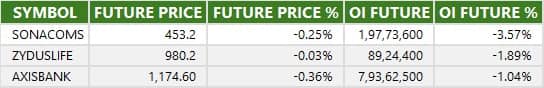
12) Short Build-up (24 Stocks)
24 stocks saw an increase in OI along with a fall in price, indicating a build-up of short positions.
13) Short-Covering (100 Stocks)
100 stocks saw short-covering, meaning a decrease in OI, along with a price increase.

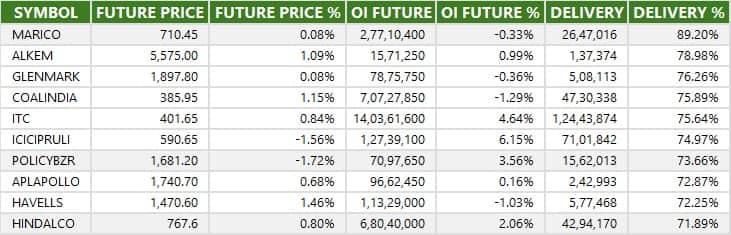
Here are the stocks that saw a high share of delivery trades. A high share of delivery reflects investing (as opposed to trading) interest in a stock.
Securities banned under the F&O segment include companies where derivative contracts cross 95 percent of the market-wide position limit.
Stocks added to F&O ban: Nil
Stocks retained in F&O ban: Sammaan Capital
Stocks removed from F&O ban: RBL Bank
Disclaimer: The views and investment tips expressed by experts on Moneycontrol are their own and not those of the website or its management. Moneycontrol advises users to check with certified experts before taking any investment decisions.Disclaimer: Moneycontrol is a part of the Network18 group. Network18 is controlled by Independent Media Trust, of which Reliance Industries is the sole beneficiary.Discover the latest Business News, Sensex, and Nifty updates. Obtain Personal Finance insights, tax queries, and expert opinions on Moneycontrol or download the Moneycontrol App to stay updated!
Find the best of Al News in one place, specially curated for you every weekend.
Stay on top of the latest tech trends and biggest startup news.


