


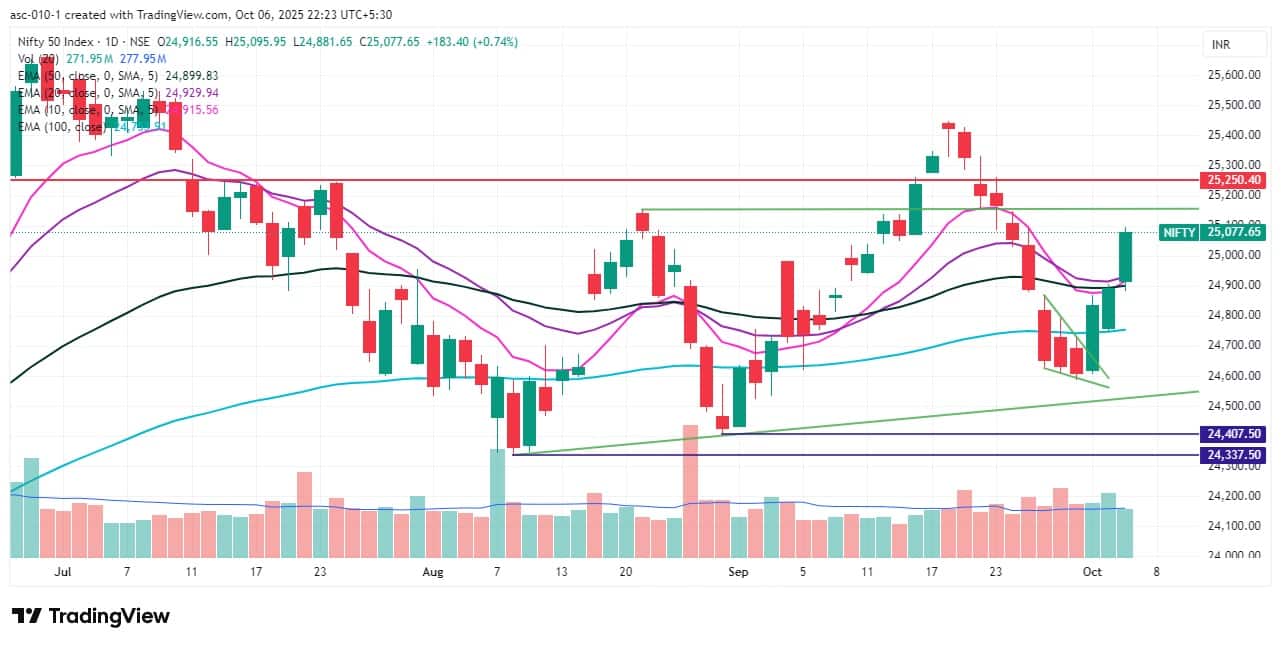
The Nifty 50 clocked a 0.74 percent rally on October 6, continuing its northward journey and forming a higher high–higher low structure for the third consecutive session, while decisively surpassing key moving averages and the 50 percent retracement of the recent fall. If the index manages to defend the 25,000 mark, which is the immediate support, then the levels to watch in the short term are 25,100 and 25,250. However, on the lower side, 24,900—where the 10-, 20-, and 50-day EMAs converge along with the 38.2 percent Fibonacci retracement—is expected to be a crucial support, according to experts.
Here are 15 data points we have collated to help you spot profitable trades:
1) Key Levels For The Nifty 50 (25,078)
Resistance based on pivot points: 25,100, 25,151, and 25,233
Support based on pivot points: 24,937, 24,886, and 24,804
Special Formation: The Nifty 50 formed a long bullish candle on the daily charts for the third consecutive session. The index surpassed the 10-, 20-, and 50-day EMAs as well as the midline of the Bollinger Bands. The RSI showed a bullish crossover, rising to 55.26. The histogram weakness faded further, suggesting improving momentum. The MACD also showed some improvement, although it remains in a bearish crossover phase. All of this indicates strengthening momentum and growing confidence among traders.
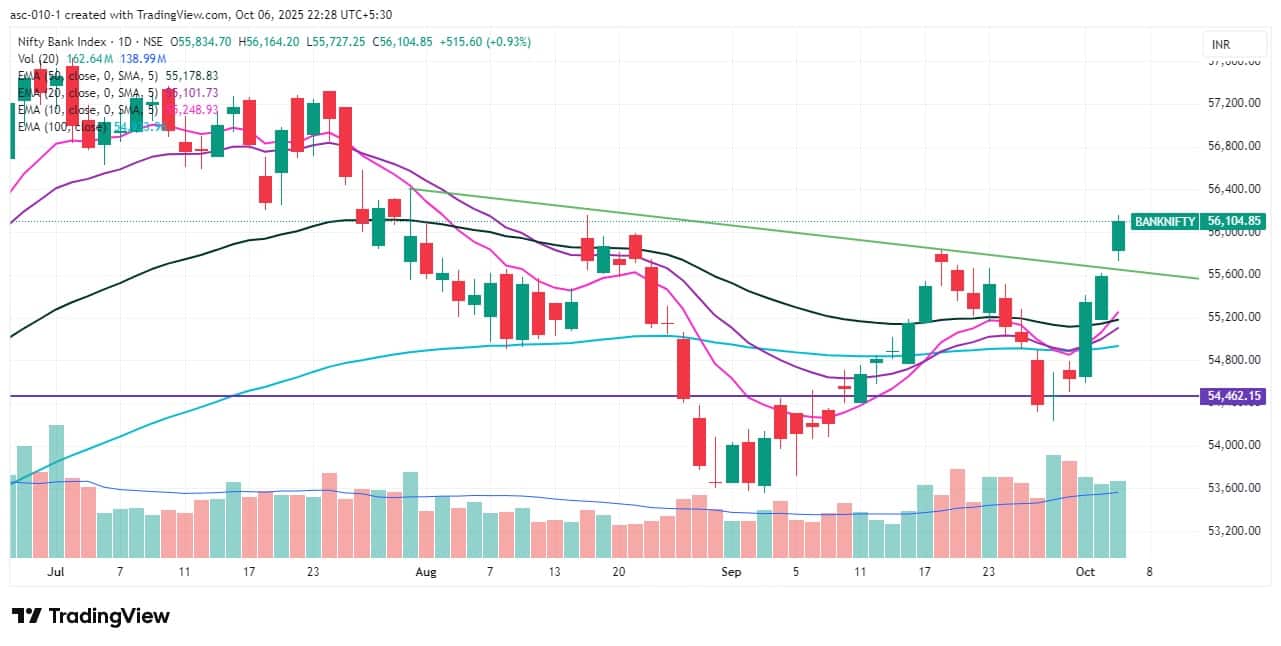
2) Key Levels For The Bank Nifty (56,105)
Resistance based on pivot points: 56,166, 56,269, and 56,436
Support based on pivot points: 55,832, 55,729, and 55,562
Resistance based on Fibonacci retracement: 56,758, 57,628
Support based on Fibonacci retracement: 55,550, 55,170
Special Formation: The Bank Nifty staged a strong performance with a decisive gap-up opening, forming a bullish candle, and giving a falling resistance trendline breakout with above-average volumes, signalling a positive trend. In fact, it outperformed the benchmark Nifty 50. The 10-day EMA crossed above the 20-, 100-, and 50-day EMAs, indicating short-term strength. The RSI reached 63.42 with a strong bullish crossover. The MACD maintained a positive crossover, with the histogram strengthening further. All of this indicates a continuation of the bullish momentum in the banking index.
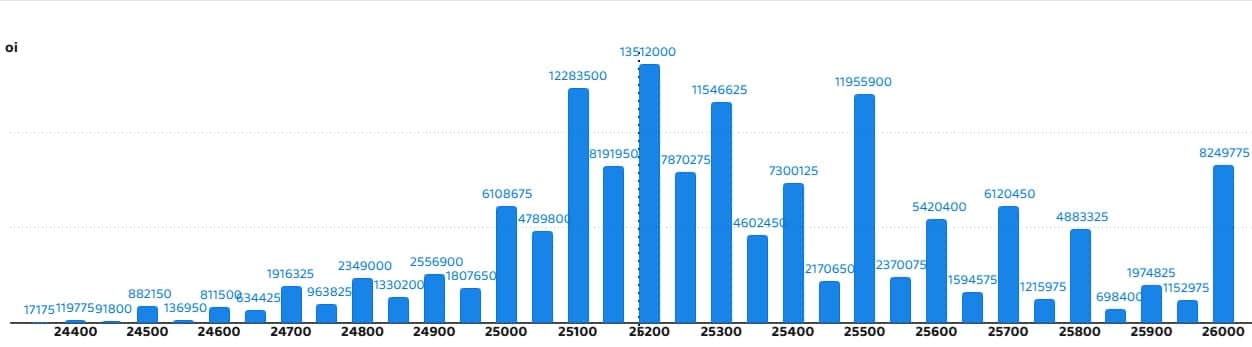
According to the weekly options data, the 25,200 strike holds the maximum Call open interest (with 1.35 crore contracts). This level can act as a key resistance for the Nifty in the short term. It was followed by the 25,100 strike (1.22 crore contracts), and the 25,500 strike (1.19 crore contracts).
Maximum Call writing was observed at the 25,200 strike, which saw an addition of 50.61 lakh contracts, followed by the 25,300 and 25,250 strikes, which added 46.67 lakh and 37.26 lakh contracts, respectively. The maximum Call unwinding was seen at the 24,900 strike, which shed 72.89 lakh contracts, followed by the 25,000 and 26,000 strikes, which shed 66.33 lakh and 47.28 lakh contracts, respectively.
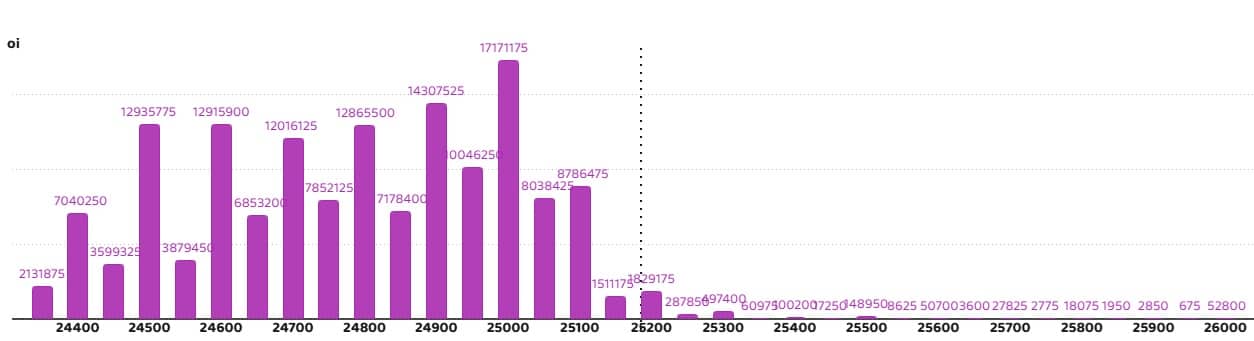
On the Put side, the maximum Put open interest was seen at the 25,000 strike (with 1.71 crore contracts), which can act as a key support level for the Nifty. It was followed by the 24,900 strike (1.43 crore contracts) and the 24,500 strike (1.29 crore contracts).
The maximum Put writing was placed at the 25,000 strike, which saw an addition of 1.35 crore contracts, followed by the 24,950 and 25,100 strikes, which added 83.2 lakh and 79.05 lakh contracts, respectively. The maximum Put unwinding was seen at the 24,550 strike, which shed 22.32 lakh contracts, followed by the 24,800 and 24,350 strikes, which shed 11.84 lakh and 7.02 lakh contracts, respectively.
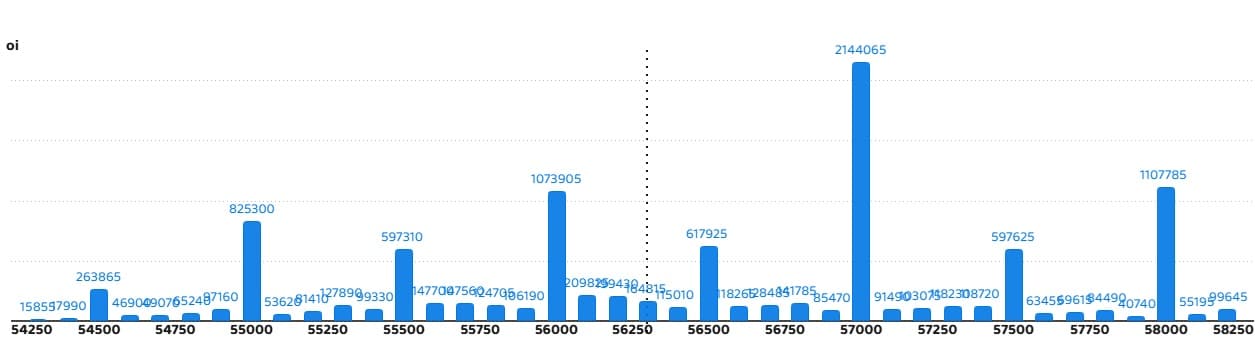
5) Bank Nifty Call Options Data
According to the monthly options data, the maximum Call open interest was seen at the 57,000 strike, with 21.44 lakh contracts. This can act as a key resistance level for the index in the short term. It was followed by the 58,000 strike (11.07 lakh contracts) and the 56,000 strike (10.73 lakh contracts).
Maximum Call writing was observed at the 56,100 strike (with the addition of 1.35 lakh contracts), followed by the 56,200 strike (86,800 contracts), and the 57,400 strike (71,155 contracts). The maximum Call unwinding was seen at the 55,500 strike, which shed 1.64 lakh contracts, followed by the 55,600 and 55,700 strikes, which shed 85,050 and 48,160 contracts, respectively.
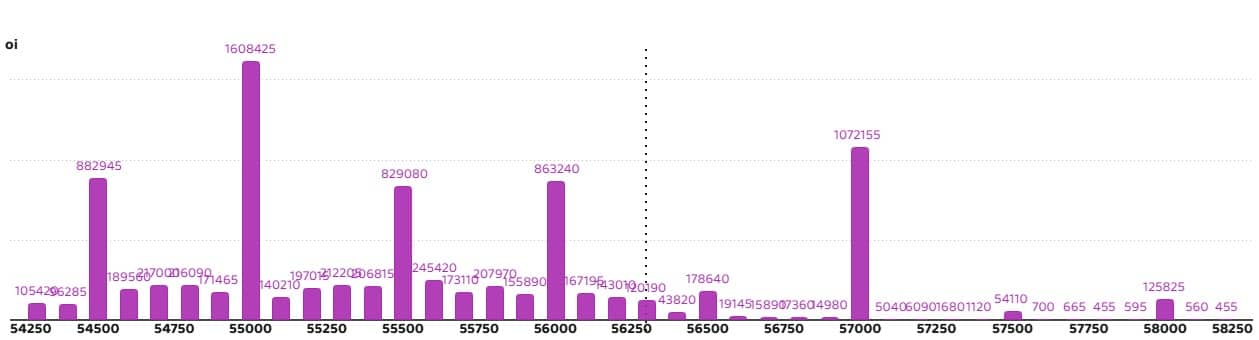
6) Bank Nifty Put Options Data
On the Put side, the 55,000 strike holds the maximum Put open interest (with 16.08 lakh contracts), which can act as a key support level for the index. This was followed by the 57,000 strike (10.72 lakh contracts) and the 54,500 strike (8.82 lakh contracts).
The maximum Put writing was observed at the 56,000 strike (which added 3.48 lakh contracts), followed by the 55,000 strike (1.64 lakh contracts) and the 56,100 strike (1.39 lakh contracts). The maximum Put winding was seen at the 54,700 strike which shed 17,010 contracts, followed by the 54,900 and 58,000 strikes, which shed 12,390 and 7,770 contracts, respectively.
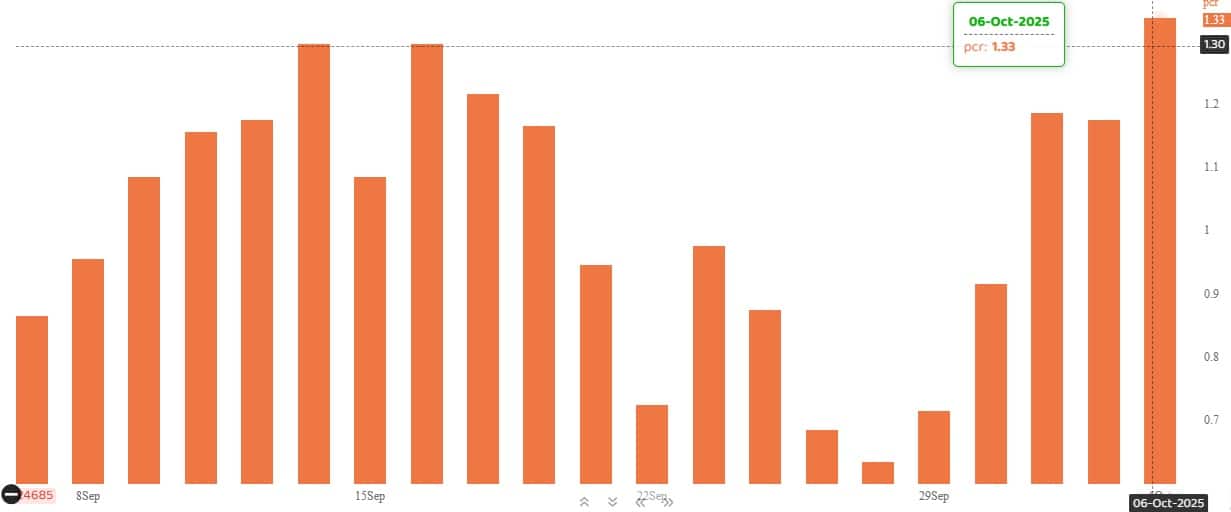
The Nifty Put-Call ratio (PCR), which indicates the mood of the market, jumped to 1.33 on October 06, compared to 1.17 in the previous session.
The increasing PCR, or being higher than 0.7 or surpassing 1, means traders are selling more Put options than Call options, which generally indicates the firming up of a bullish sentiment in the market. If the ratio falls below 0.7 or moves towards 0.5, then it indicates selling in Calls is higher than selling in Puts, reflecting a bearish mood in the market.
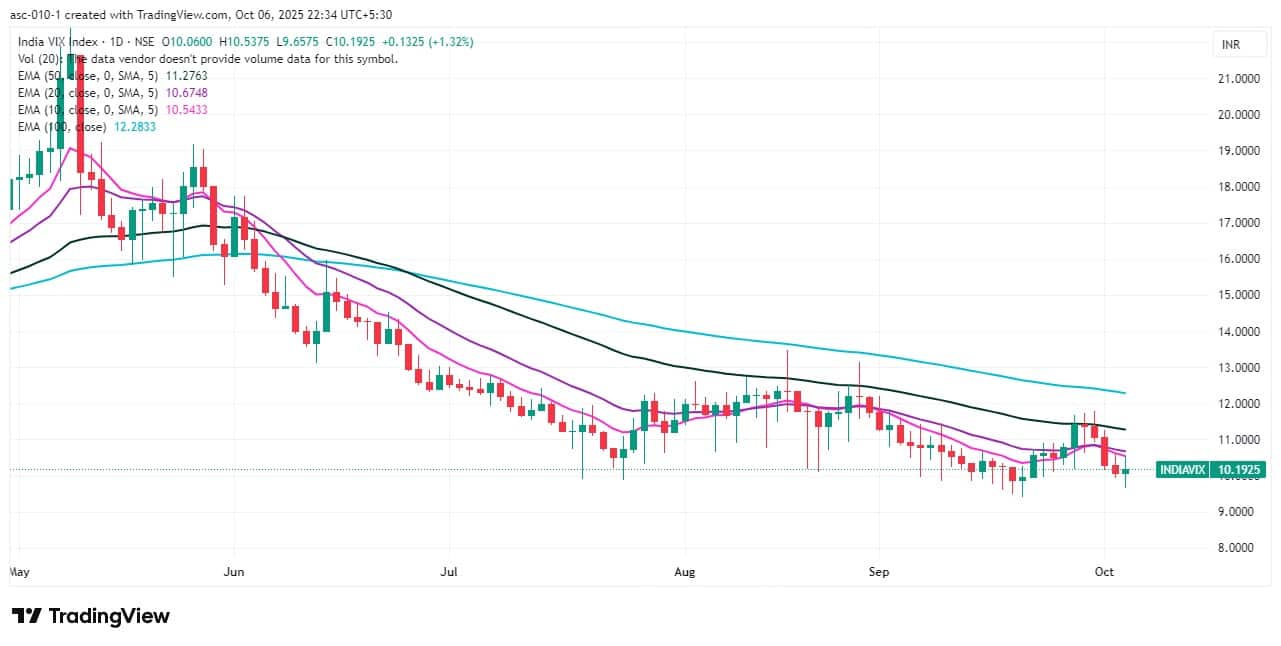
9) India VIX
The India VIX, which measures expected market volatility, rebounded after a four-day fall, rising 1.32 percent to 10.19, but remained below all key moving averages, thereby signalling continued support for the bulls.
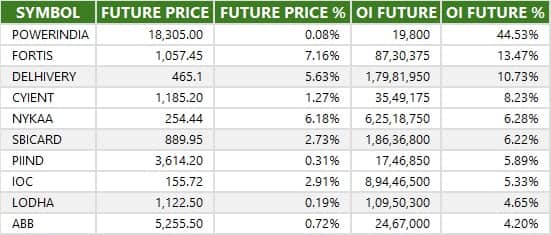
A long build-up was seen in 76 stocks. An increase in open interest (OI) and price indicates a build-up of long positions.
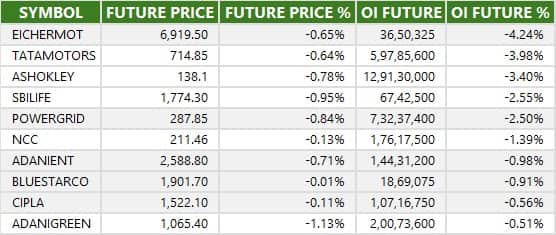
11) Long Unwinding (24 Stocks)
24 stocks saw a decline in open interest (OI) along with a fall in price, indicating long unwinding.
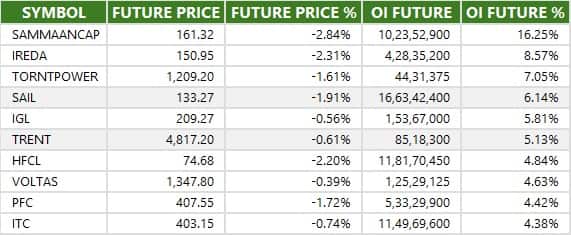
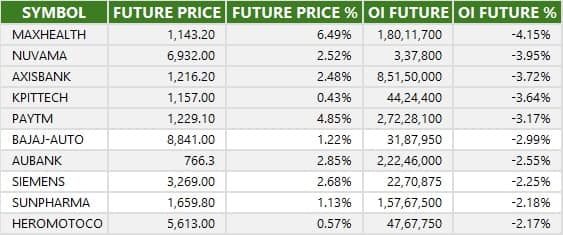
12) Short Build-up (55 Stocks)
55 stocks saw an increase in OI along with a fall in price, indicating a build-up of short positions.
13) Short-Covering (58 Stocks)
58 stocks saw short-covering, meaning a decrease in OI, along with a price increase.
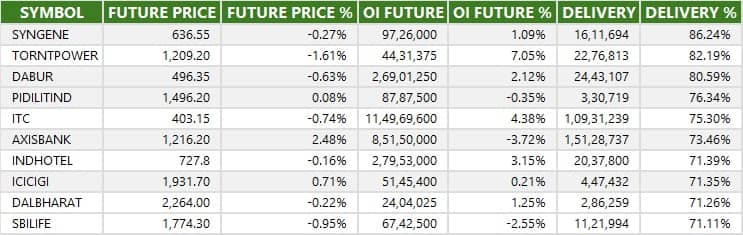
Here are the stocks that saw a high share of delivery trades. A high share of delivery reflects investing (as opposed to trading) interest in a stock.
Securities banned under the F&O segment include companies where derivative contracts cross 95 percent of the market-wide position limit.
Stocks added to F&O ban: Nil
Stocks retained in F&O ban: RBL Bank
Stocks removed from F&O ban: Nil
Disclaimer: The views and investment tips expressed by experts on Moneycontrol are their own and not those of the website or its management. Moneycontrol advises users to check with certified experts before taking any investment decisions.Disclosure: Moneycontrol is a part of the Network18 group. Network18 is controlled by Independent Media Trust, of which Reliance Industries is the sole beneficiary.Discover the latest Business News, Sensex, and Nifty updates. Obtain Personal Finance insights, tax queries, and expert opinions on Moneycontrol or download the Moneycontrol App to stay updated!
Find the best of Al News in one place, specially curated for you every weekend.
Stay on top of the latest tech trends and biggest startup news.


