


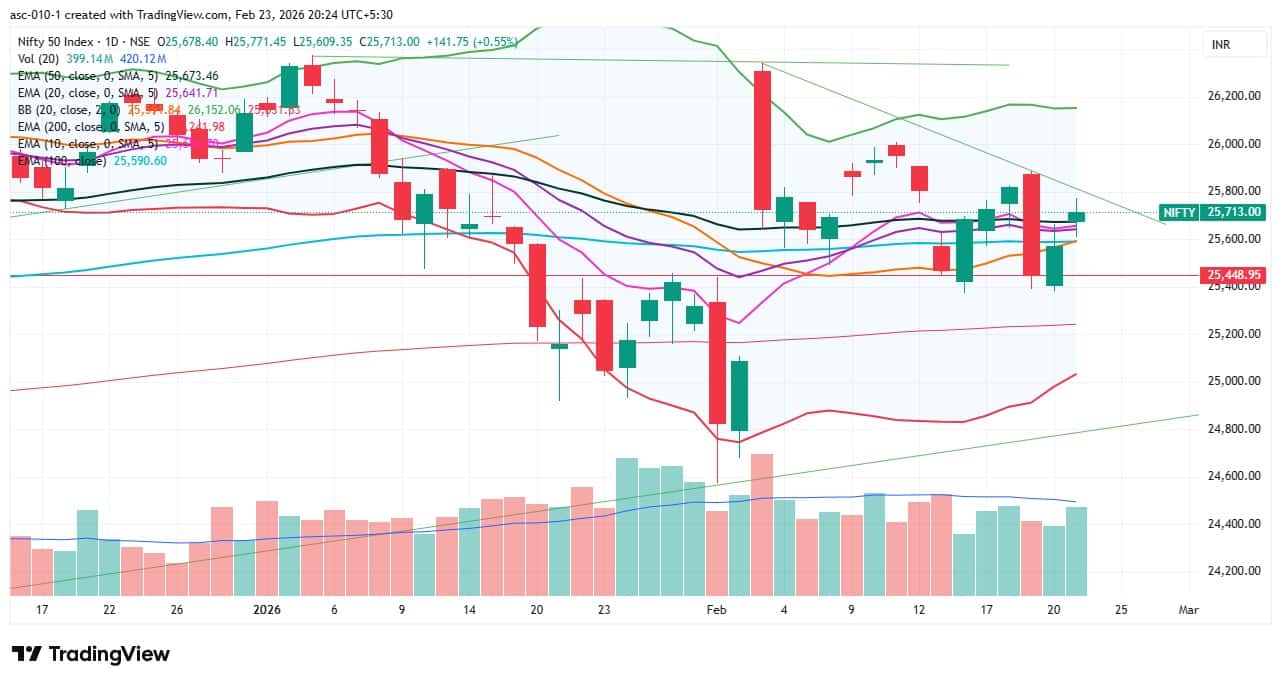
The Nifty 50 started the week on a healthy note, closing nearly six-tenths of a percent higher on February 23. The benchmark index climbed back above all key moving averages, but sustainability remains the key factor to watch from here. According to experts, the immediate key hurdle is placed at 25,800 (slightly above the falling resistance trendline). Surpassing and sustaining this level could prepare the index for a move toward the 25,900–26,000 zone (recent swing highs), which may open the door to a record high. Until then, range-bound trading may continue, with immediate key support at 25,600, as a move below this level could again increase the possibility of a fall toward the previous week’s low.
Here are 15 data points we have collated to help you spot profitable trades:
1) Key Levels For The Nifty 50 (25,713)
Resistance based on pivot points: 25,760, 25,798, and 25,860
Support based on pivot points: 25,636, 25,598, and 25,536
Special Formation: The Nifty 50 formed a small-bodied bullish candle with upper and lower shadows on the daily charts, indicating indecision between bulls and bears. The index climbed above the 10-, 20-, 50- and 100-day EMAs in a single session but could not surpass the downward-sloping resistance trendline. The RSI inched up to 51.54 but remained below the reference line. The MACD stayed above the zero line and the signal line, with strength returning to the histogram. All this indicates improving momentum, though confirmation from price action is still required.
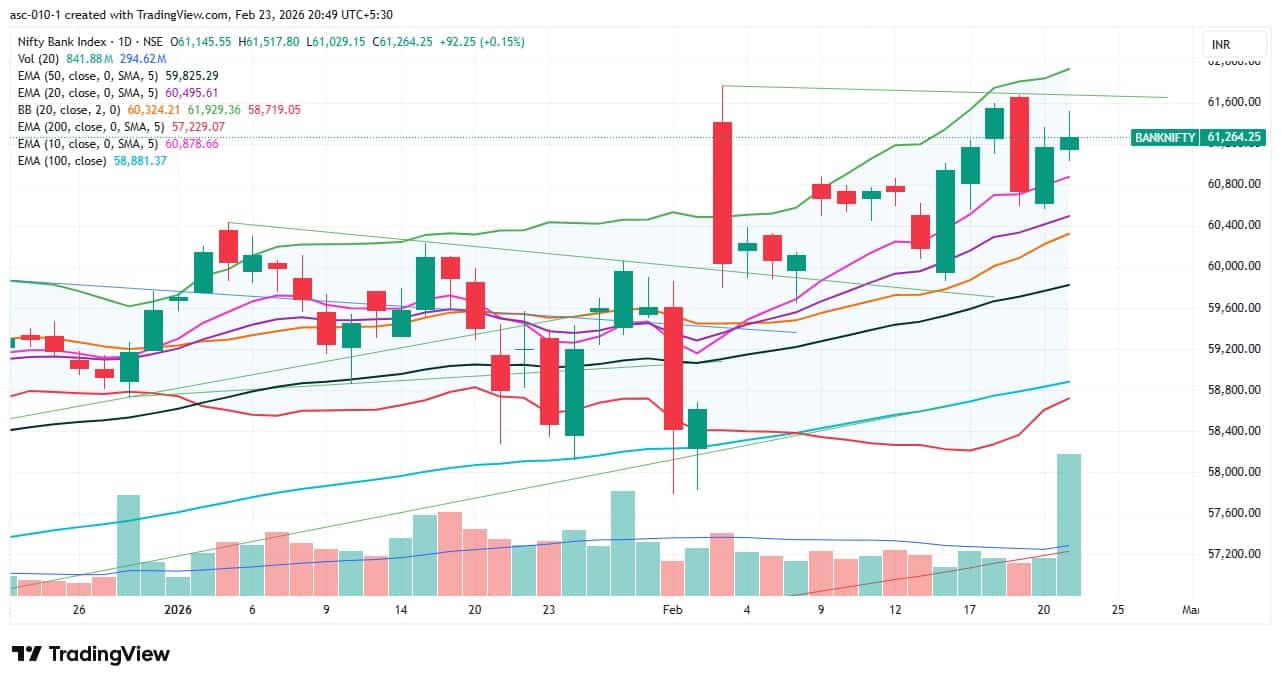
2) Key Levels For The Bank Nifty (61,264)
Resistance based on pivot points: 61,457, 61,572, and 61,759
Support based on pivot points: 61,084, 60,968, and 60,782
Resistance based on Fibonacci retracement: 62,064, 64,707
Support based on Fibonacci retracement: 60,854, 60,273
Special Formation: The Bank Nifty formed a bullish candle with an upper shadow on the daily charts and maintained a higher high–higher low structure, indicating a positive trend despite pressure at higher levels. Trading volume was significantly higher. The index sustained above all key moving averages, all of which are trending northward. The RSI at 59.63 maintained its positive crossover, while the MACD stayed above the signal line. The histogram showed slightly fading momentum but remained above the zero line. All this indicates underlying strength, though some consolidation at higher levels cannot be ruled out.
According to the monthly options data, the 26,000 strike holds the maximum Call open interest (with 1.77 crore contracts). This level can act as a key resistance level for the Nifty in the short term. It was followed by the 25,800 strike (1.27 crore contracts) and 25,700 strike (1.07 crore contracts).
Maximum Call writing was observed at the 26,000 strike, which saw an addition of 35.8 lakh contracts, followed by the 25,750 and 26,100 strikes, which added 33.74 lakh and 32.88 lakh contracts, respectively. The maximum Call unwinding was seen at the 25,600 strike which shed 33.67 lakh contracts, followed by the 25,500 and 25,550 strikes, which shed 17.91 lakh and 13.45 lakh contracts, respectively.
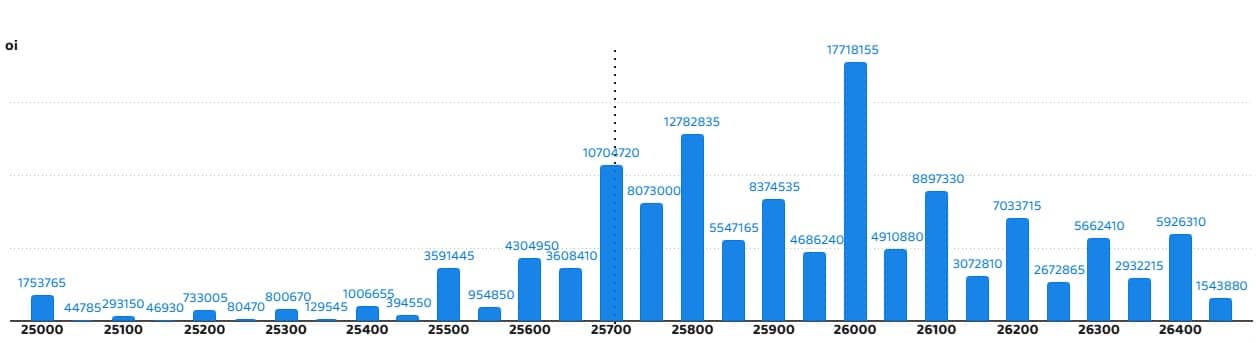
On the Put side, the maximum Put open interest was seen at the 25,500 strike (with 1.19 crore contracts), which can act as a key support level for the Nifty in the short term. It was followed by the 25,000 strike (1.18 crore contracts) and the 25,600 strike (93.33 lakh contracts).
The maximum Put writing was placed at the 25,700 strike, which saw an addition of 59.25 lakh contracts, followed by the 25,600 and 25,500 strikes, which added 29.28 lakh and 27.55 lakh contracts, respectively. The maximum Put unwinding was seen at the 25,400 strike, which shed 6.77 lakh contracts, followed by the 25,100 and 26,000 strikes, which shed 6.69 lakh and 3.06 lakh contracts, respectively.
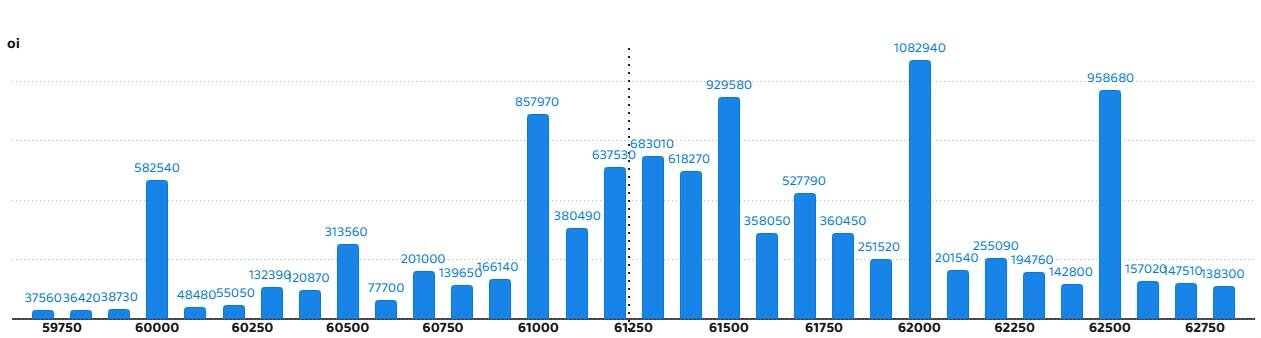
5) Bank Nifty Call Options Data
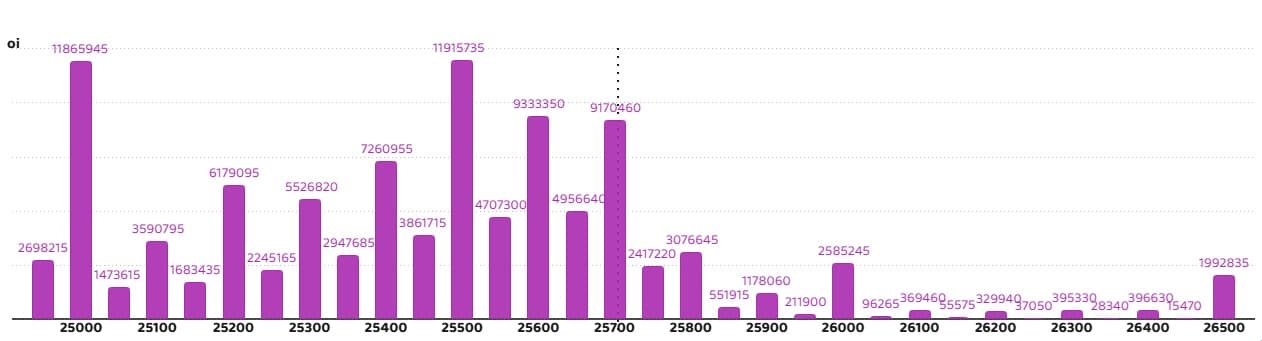
According to the monthly options data, the 62,000 strike holds the maximum Call open interest, with 10.82 lakh contracts. This can act as a key resistance level for the index in the short term. It was followed by the 62,500 strike (9.58 lakh contracts) and the 61,500 strike (9.29 lakh contracts).
Maximum Call writing was observed at the 61,400 strike (with the addition of 3.58 lakh contracts), followed by the 62,000 strike (2.47 lakh contracts) and 61,300 strike (2.22 lakh contracts). The maximum Call unwinding was seen at the 60,000 strike, which shed 84,810 contracts, followed by the 60,800 and 60,500 strikes which shed 74,730 and 45,840 contracts, respectively.
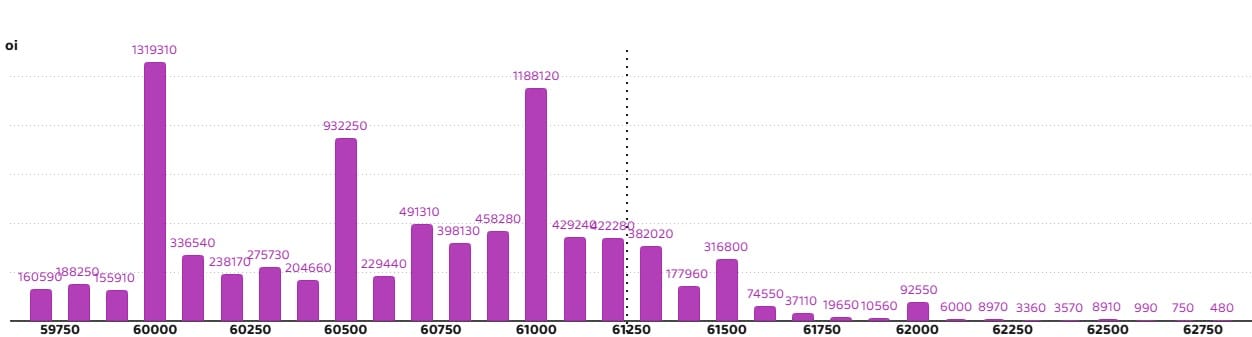
6) Bank Nifty Put Options Data
On the Put side, the maximum Put open interest was seen at the 60,000 strike (with 13.19 lakh contracts), which can act as a key support level for the index. This was followed by the 61,000 strike (11.88 lakh contracts) and the 60,500 strike (9.32 lakh contracts).
The maximum Put writing was placed at the 61,000 strike (which added 2.4 lakh contracts), followed by the 60,100 strike (1.35 lakh contracts) and the 61,300 strike (1.25 lakh contracts). The maximum Put unwinding was seen at the 59,700 strike, which shed 37,110 contracts, followed by the 60,600 and 59,900 strikes, which shed 16,680 and 9,540 contracts, respectively.
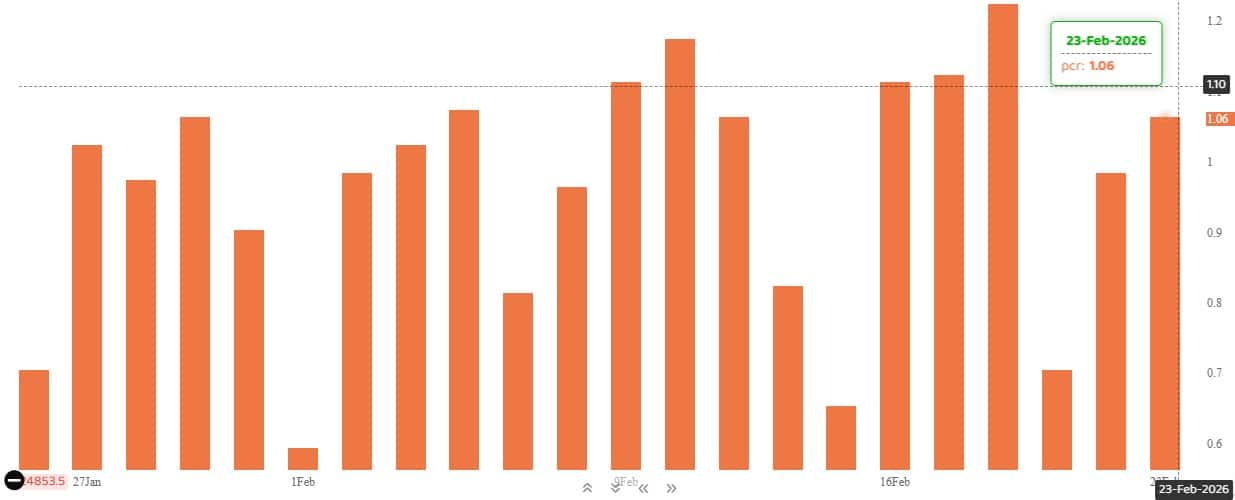
The Nifty Put-Call ratio (PCR), which indicates the mood of the market, rose to 1.06 on February 23, compared to 0.98 in the previous session.
The increasing PCR, or being higher than 0.7 or surpassing 1, means traders are selling more Put options than Call options, which generally indicates the firming up of a bullish sentiment in the market. If the ratio falls below 0.7 or moves towards 0.5, then it indicates selling in Calls is higher than selling in Puts, reflecting a bearish mood in the market.
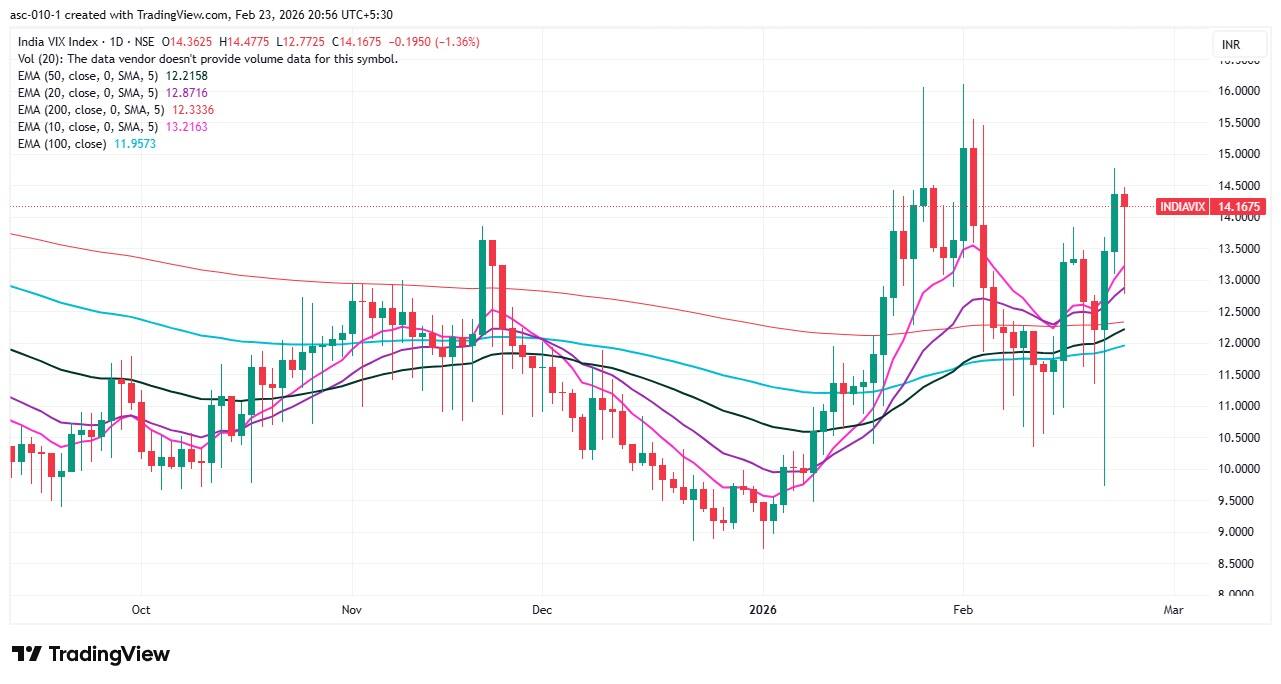
9) India VIX
The India VIX, the fear index, remained at elevated levels despite a minor decline on Monday. Therefore, unless it consistently stays below the 12 zone, caution will prevail for bulls. It closed at 14.17, down 1.36 percent after rising sharply in the previous two sessions.
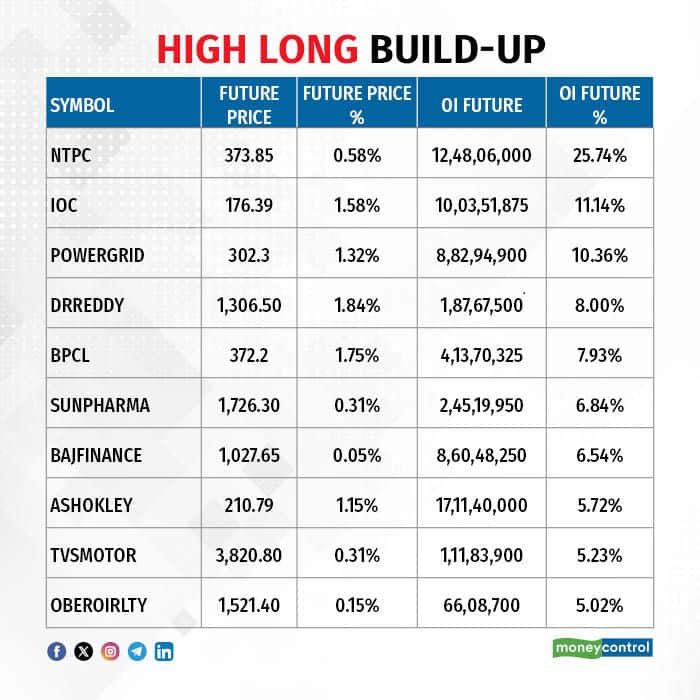
A long build-up was seen in 48 stocks. An increase in open interest (OI) and price indicates a build-up of long positions.
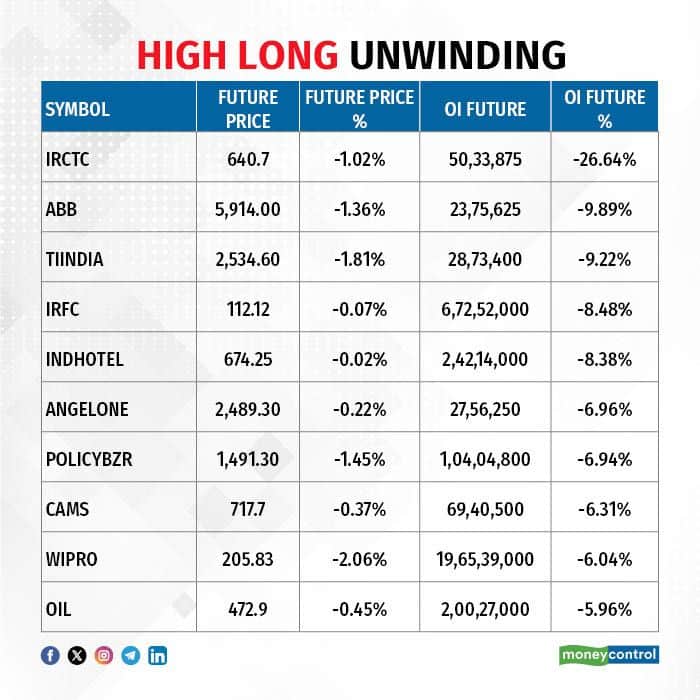
11) Long Unwinding (54 Stocks)
54 stocks saw a decline in open interest (OI) along with a fall in price, indicating long unwinding.
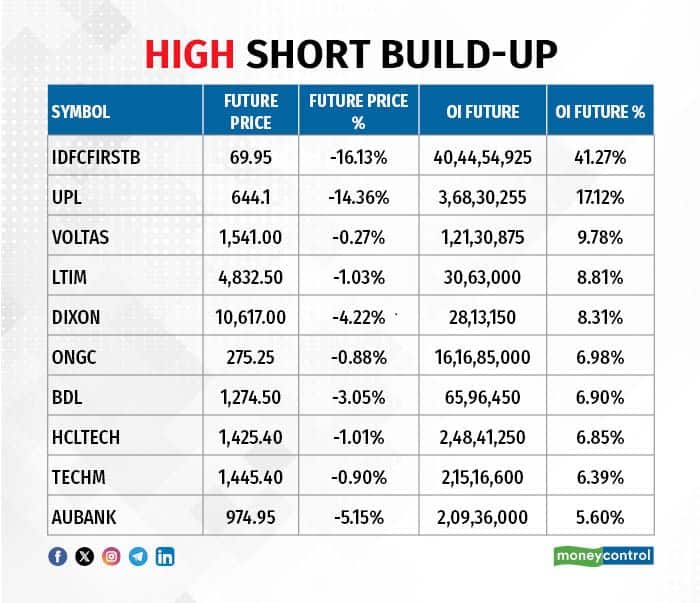
12) Short Build-up (33 Stocks)
33 stocks saw an increase in OI along with a fall in price, indicating a build-up of short positions.
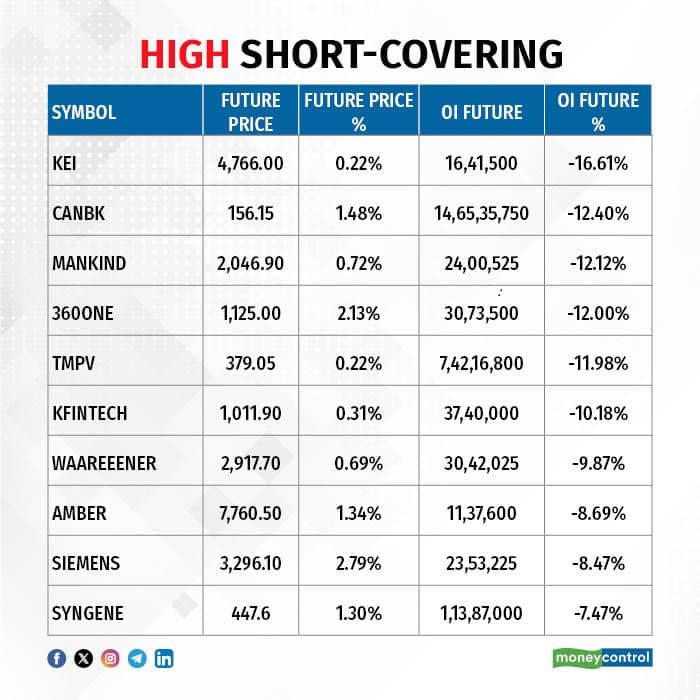
13) Short-Covering (76 Stocks)
76 stocks saw short-covering, meaning a decrease in OI, along with a price increase.
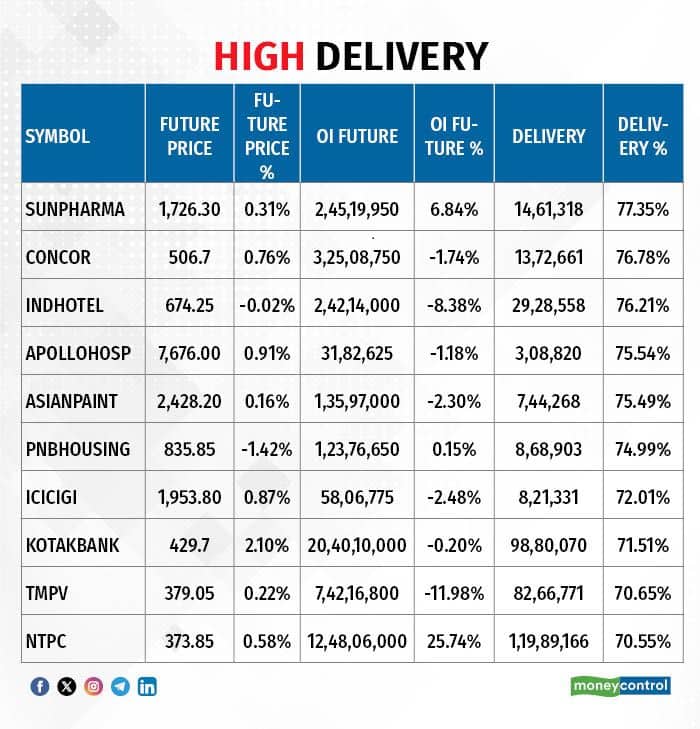
Here are the stocks that saw a high share of delivery trades. A high share of delivery reflects investing (as opposed to trading) interest in a stock.
Securities banned under the F&O segment include companies where derivative contracts cross 95 percent of the market-wide position limit.
Stocks added to F&O ban: Nil
Stocks retained in F&O ban: SAIL
Stocks removed from F&O ban: Sammaan Capital
Disclaimer: The views and investment tips expressed by experts on Moneycontrol are their own and not those of the website or its management. Moneycontrol advises users to check with certified experts before taking any investment decisions.Disclaimer: Moneycontrol is a part of the Network18 group. Network18 is controlled by Independent Media Trust, of which Reliance Industries is the sole beneficiary.Discover the latest Business News, Sensex, and Nifty updates. Obtain Personal Finance insights, tax queries, and expert opinions on Moneycontrol or download the Moneycontrol App to stay updated!
Find the best of Al News in one place, specially curated for you every weekend.
Stay on top of the latest tech trends and biggest startup news.


