


The market went into a tailspin and closed down 2.6 percent to below 19,700 points in the week ended September 22 and after trading in the green for three weeks in a row.
If bears continue to hold their sway over the market, then 19,600-19,500 could be a crucial support for the Nifty50 in the coming sessions, and if the index stays above this level, then the gradual up-move towards 20,000 points looks likely, while the breaking of this level may drag the index near its August lows of around 19,200, experts said.
The Nifty50 settled at 19,674 and formed long bearish candlestick pattern on the weekly charts with momentum indicator RSI (relative strength index) showing a bearish crossover.
"The recent price action certainly portrays the ferocity of the bears, which not only decisively dragged the index below the psychological mark but yielded a dent in the ongoing undertone," Osho Krishan, senior analyst for technical and derivative research at Angel One, said, adding that the 19,600-19,500 zone is likely to cushion the blips.
On the higher end, 19,780-19,800 is likely to be seen as an intermediate resistance, followed by a series of resilience from 19,850-19,900 and finally the 20,000 mark in the near term, he feels.
Indiacharts' Rohit Srivastava also expects support for the Nifty50 near 19,615, which is 61.8 percent of the rally since the August low. The rally that started in March 2023 is in its third wave now and that means that the low in August is unlikely to be broken, he feels.
For now, Krishan advised that one needs to stay very selective with stock preferences and avoid being aggressive in the markets.
Let's take a look at the top 10 trading ideas by experts for the next three-four weeks. Returns are based on the September 22 closing prices:
Expert: Viraj Vyas, CMT, technical & derivatives analyst - institutional equity at Ashika Stock Broking
Genus Power Infrastructures: Buy | LTP: Rs 270 | Stop-Loss: Rs 255 | Target: Rs 305 | Return: 13 percent
The stock has been exhibiting a consistent and robust uptrend since June of this year, characterized by a pattern of higher highs and higher lows. Notably, it has found consistent support at the 21-day exponential moving average (EMA) during this upward trajectory.
Recently, the stock has once again formed a base at the 21-day EMA, indicating a potential bullish move in the making. The price action suggests that the stock is poised to resume its upward journey, potentially surpassing its previous swing high.

Karur Vysya Bank: Buy | LTP: Rs 136 | Stop-Loss: Rs 129 | Target: Rs 155 | Return: 14 percent
The stock has been on an upward trajectory since July 2022, signifying a notable uptrend in its price action. An interesting observation in this trend is the shallow nature of its retracements during corrections, which could indicate a high level of investor participation during each dip.
In the past week, the stock successfully breached its previous consolidation range. Even in the midst of a volatile market environment, the stock demonstrates resilience by consistently marking new highs on a weekly basis.

Expert: Shrikant Chouhan, head of research (retail) at Kotak Securities
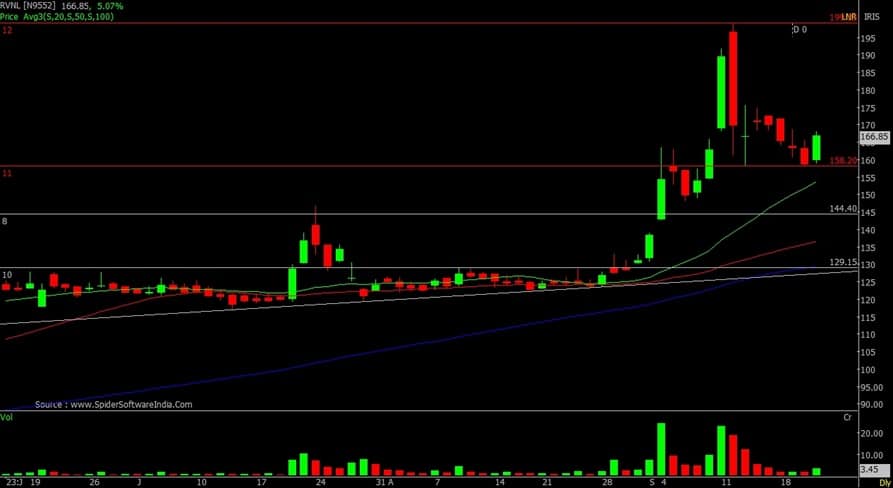
Rail Vikas Nigam: Buy | LTP: Rs 167 | Stop-Loss: Rs 157 | Target: Rs 190-199 | Return: 19 percent
The stock reached its peak at Rs 199 in mid-September, but then corrected to the 50 percent retracement level due to market weakness. This level provided strong support to the stock. Interestingly, last Friday the stock sharply rebounded after hitting the support levels at Rs 158 and closed above the previous day's high.
This is a positive signal for the stock, suggesting it has formed a higher bottom and could move upward to either Rs 190 or Rs 199. To take advantage of this potential, it would be advisable to buy the stock with a stop-loss set at Rs 157.
Bombay Dyeing: Buy | LTP: Rs 146 | Stop-Loss: Rs 135 | Target: Rs 169 | Return: 16 percent
The stock has been consistently climbing upward since hitting the Rs 53 mark. Throughout this period, it has consistently established new highs and lows. Our analysis reveals that the stock has recently made a higher low at Rs 138, which may propel it upwards to Rs 169.
If the stock manages to surpass Rs 169, it will encounter minimal barriers until it reaches Rs 200 levels. We advise purchasing at current levels and establishing a stop-loss at Rs 135.

HCC: Buy | LTP: Rs 26.15 | Stop-Loss: Rs 22 | Target: Rs 30 | Return: 15 percent
The stock market is presently undergoing a corrective pattern and has remained above the 50-day SMA support for almost eight days. This indicates that the stock is displaying some underlying strength.
Moreover, the stock is forming a rounding bottom pattern, which offers medium-term investors a chance to buy. These investors can hold onto the stock and aim for targets of Rs 30 and Rs 37. However, to sustain a long position, it is advisable to place a stop-loss at Rs 22.

Expert: Nandish Shah, deputy vice president, retail research at HDFC Securities
CARE Ratings: Buy | LTP: Rs 856 | Stop-Loss: Rs 790 | Target: Rs 970 | Return: 13 percent
The stock price has broken out from the symmetrical triangle on the weekly chart. Stock price has broken out on the monthly chart by surpassing the resistance of Rs 790 odd levels.
Momentum Oscillators like - RSI (11) and MFI (money flow index 10) are sloping upwards and placed above 60 on the weekly chart, indicating strength in the current uptrend of the stock.

Century Textiles & Industries: Buy | LTP: Rs 1,087 | Stop-Loss: Rs 1,015 | Target: Rs 1,200 | Return: 10 percent
The stock price has broken out from the downward sloping trendline on the weekly chart. Stock price has been forming bullish higher top higher bottom formation on the weekly chart.
RSI Oscillator is in rising mode and placed above 60 on the weekly chart, indicating strength in the current uptrend of the stock.

Lumax Industries: Buy | LTP: Rs 2,408 | Stop-Loss: Rs 2,250 | Target: Rs 2,700 | Return: 12 percent
The stock price has broken out on the weekly and monthly chart to close at all-time high levels. Stock price has been holding above 20-week EMA (exponential moving average). Plus DI (directional indicator) is placed above minus DI while ADX (average directional index) line is placed above 25, indicating stock price is likely to gather momentum in the coming days.

Expert: Mitesh Karwa, research analyst at Bonanza Portfolio
Kaveri Seed Company: Buy | LTP: Rs 631 | Stop-Loss: Rs 585 | Target: Rs 710 | Return: 12.5 percent
KSCL has seen breaking out of a bullish pattern on the weekly timeframe after almost two years with a big bullish candlestick and above average volumes. In addition, the stock is trading and sustaining above all its important EMAs which can be used as a confluence towards the bullish view.
On the indicator front, the Ichimoku Cloud is also suggesting a bullish move as the price is trading above the conversion line, base line and cloud.
Momentum oscillator RSI (14) is at around 69 on the daily time frame indicating strength by sustaining above 50.
Observation of the above factors indicates that a bullish move in KSCL is possible for target upto Rs 710. One can initiate a buy trade in between the range of Rs 629-631, with a stop-loss of Rs 585 on daily closing basis.

Granules India: Buy | LTP: Rs 337 | Stop-Loss: Rs 321 | Target: Rs 360 | Return: 7 percent
Granules has seen breaking out of a resistance zone on the weekly timeframe with above average volumes and a bullish candlestick after taking support from important support trendline on the monthly timeframe. In addition, the stock is trading above important EMAs of 20/50/100/200 on the daily timeframe which indicates strength.
On the indicator front, momentum oscillator RSI (14) is at around 69 on the daily time frame indicating strength by sustaining above 50 and the Ichimoku Cloud is also suggesting a bullish move.
Observation of the above factors indicates that a bullish move in Granules is possible for target upto Rs 360. One can initiate a buy trade in the range of Rs 335-336, with a stop-loss of Rs 321 on daily closing basis.

Honeywell Automation: Buy | LTP: Rs 40,850 | Stop-Loss: Rs 39,000 | Target: Rs 43,500 | Return: 6.5 percent
Honeywell has seen breaking out of a downward sloping trendline on the weekly timeframe with a bullish candlestick and above average volume after more than two years which indicates strength as the stock is also trading above all its important EMAs on the daily timeframe which acts as a confluence.
The Supertrend indicator is also indicating a bullish continuation which supports the bullish view. Momentum oscillator RSI (14) is at around 56 on the daily time frame indicating strength by sustaining above 50. The Ichimoku Cloud is also suggesting a bullish move as the price is trading above the conversion line, base line and cloud.
Observation of the above factors indicates that a bullish move in Honeywell is possible for target upto Rs 43,500. One can initiate a buy trade in between the range of Rs 40,800-40,850, with a stop-loss of Rs 39,000 on daily closing basis.

Discover the latest Business News, Sensex, and Nifty updates. Obtain Personal Finance insights, tax queries, and expert opinions on Moneycontrol or download the Moneycontrol App to stay updated!
Find the best of Al News in one place, specially curated for you every weekend.
Stay on top of the latest tech trends and biggest startup news.


