

Shabbir Kayyumi
Narnolia Financial Advisors
Technical Analysis Classroom: Part 21
Detecting a strong directional move is the most important skill for all traders to have. Trend chasing is the most popular technical method of profitable trading. But stock prices spend more time in consolidation and less time in trending move and so trend trading are prone to frequent drawdown. So before employing trend trading it is important to know whether the stock is in a trend or not.
The ADX indicator simply measures the strength of a trend and whether the price is in a trading or non-trading price movement. The ADX indicator by J. Welles Wilder is a wildly popular indicator for measuring strength of a trend. Unlike the RSI, ADX doesn’t determine whether the trend is bullish or bearish; but it measures the strength of the current trend.
What is ADX Indicator?
The ADX (Average Directional Index) is a creation from technical analysis legend J. Welles Wilder which gives following important information.
• It informs a trader when the market is trending.
• It filters out anti trend trades to help trend chasing indicators from frequent whipsaws.
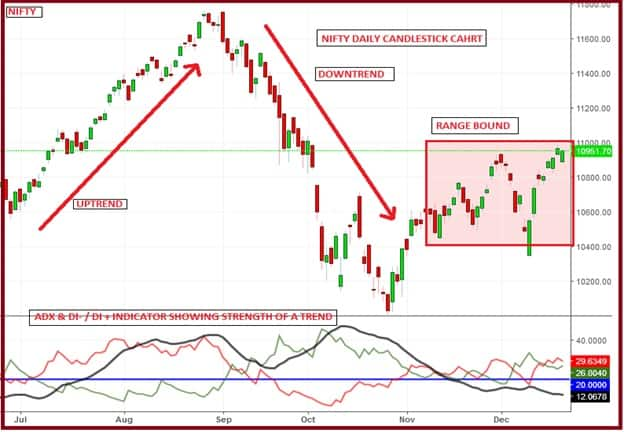 Figure .1.Illustration of ADX indicator
Construction of ADX Indicator
Using following three indicators together, chartists can determine direction as well as strength of the trend.
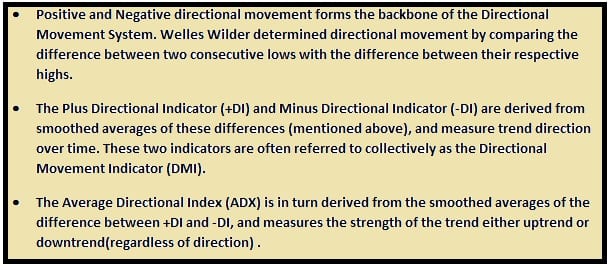 Figure .2.Construction of ADX indicator
As mentioned above the ADX is comprised of the following components:
1. Plus Directional Movement Index (DI+)
2. Minus Directional Movement Index (DI-)
3. ADX line
ADX itself is the smoothed average of the difference of the DII+ and DII-. ADX cannot have a negative value.
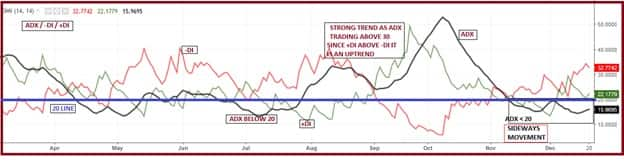 Figure .3.Components of ADX Indicator
The above chart indicates the visualization of the ADX.
• Green Line = DI+
• Red Line = DI-
• Black Line = ADX
Interpretation of DI
While ADX provides information only about the strength of the trend, it is normally supplemented with Directional Index +DI and –DI for knowing the direction of the trend.
Their interpretation is as follows:
• When +DI is above -DI then trend is considered as an uptrend.
• When -DI is above +DI then trend is considered as a downwards.
• +DI is crossing over -DI signals trend reversal to bullish trend.
• -DI is crossing over +DI signals trend reversal to bearish trend.
Interpretation of ADX
• If the price is going UP, and the ADX indicator is also going UP, then we have the case for a bullish trend.
• The same is true if the price is going down and the ADX indicator is going UP. Then we have the case for a bearish trend.
• Value of ADX below 20 is called trading zone which implies non-trending market.
ADX strength scale
• If ADX is between 0 and 20 then the stock is in a trading range. It is likely just chopping around sideways. Avoid these for trend trading.
• Once ADX gets above 20 then start employing trending trade system. Big moves (up or down) tend to happen when ADX is right above this number.
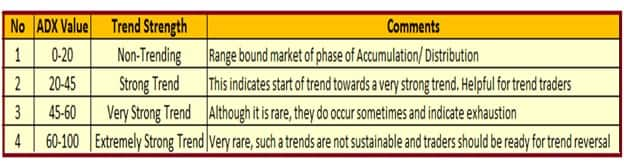 Figure .4. Strength scale of ADX Indicator
Important concepts with ADX
Volatility & Volume: - The ADX is a valuable tool because it focuses on the trend and strength of the stocks. However extremely volatile stocks will not always adhere to ADX readings. Stocks that react favorably to the ADX should have high volume but not very high volatility
Divergence: - Unlike other indicators divergence in ADX does not predict change in trend. As long as the value stays above 20, the trend is intact.
Trading the Trend
• If the price is going UP, and the ADX indicator is also going UP & its value above 20 and +DI > - DI, it is a buy signal.
• If the price is going down and the ADX indicator is going UP & it is above 20 and -DI >+ DI, it is a sell signal.
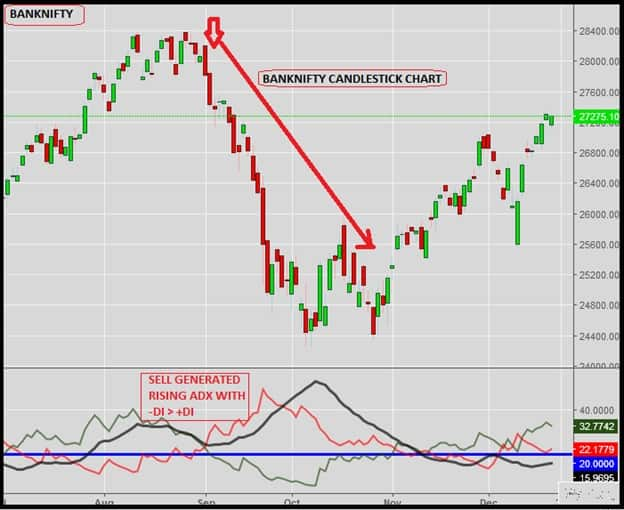 Figure .5. Trading the Trend with ADX indicator
Trading the Ranges
When ADX is below 20, price enters a sideways or consolidation. When ADX rises above 20, price tends to trend. Low ADX is a usually a sign of accumulation or distribution.
When ADX is below 20, price enters range conditions, and price patterns are often easier to identify. Price then moves up and down between resistance and support to find selling and buying interest, respectively.
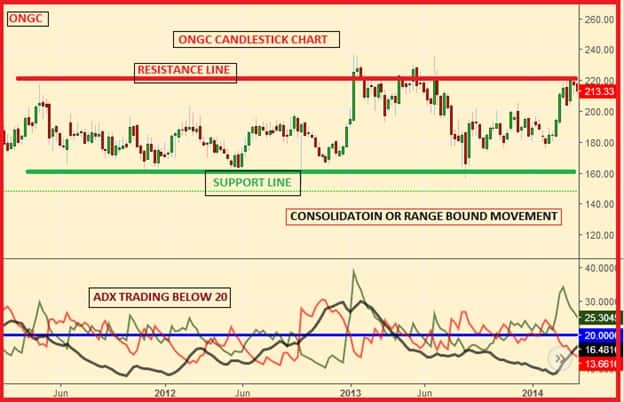 Figure .6. Trading the range with ADX indicator
This chart displays an ADX value that is below 20 and so the stock was in a tight range, which is perfect for range trading.
Weakness of ADX
• ADX is based on Moving Averages. Therefore it is very slow to react or in other words it is a lag indicator.
• ADX may not provide signals for slow moving or less volatile stocks.
• Crossover of +DI and -DI sometimes can happen too frequently, thereby giving many false signals.
• Unlike other indicators ADX cannot be used in isolation and should be used with other oscillators or indicators.
Conclusion
• The Average Directional Index (ADX), Minus Directional Indicator (-DI) and Plus Directional Indicator (+DI) represent a group of directional movement indicators that form a trading system developed by Welles Wilder.
• ADX is non-directional; it registers trend strength whether price is trending up or down.
• When the +DMI is above the -DMI, prices are moving up, and ADX measures the strength of this uptrend. When the -DMI is above the +DMI, prices are moving down, and ADX measures the strength of this downtrend.
Disclaimer: The author is Head - Technical & Derivative Research at Narnolia Financial Advisors Ltd. The views and investment tips expressed by investment expert on moneycontrol.com are his own and not that of the website or its management. Moneycontrol.com advises users to check with certified experts before taking any investment decisions.

Discover the latest Business News, Sensex, and Nifty updates. Obtain Personal Finance insights, tax queries, and expert opinions on Moneycontrol or download the Moneycontrol App to stay updated!
Find the best of Al News in one place, specially curated for you every weekend.
Stay on top of the latest tech trends and biggest startup news.


