


What is ROC Oscillator?
The Rate-of-Change (ROC) indicator, which is also commonly referred to as 'Momentum', is a pure momentum oscillator. The price rate of change indicator (PROC) or simply, rate of change indicator (ROC) is a price based technical oscillator which can be displayed along with price chart. It calculates the percent change in price between different periods.
Momentum in technical analysis is the rate of change in security prices or indices. There are several indicators based on momentum indicator, however, ROC is given the highest priority. It is used as a trend identification indicator as well as used to measure divergence in the momentum and price. As with all oscillators, the ROC can be used to time the market entry into a trend. However, it really becomes most effective when confirming signals or conditions is identified by additional technical analysis.
Why Buy Petronet LNG?
An upward surge in the ROC reflects a sharp price advance. A downward plunge indicates a steep price decline. Prices are rising as long as the ROC remains positive, however, prices are falling when the ROC is negative. ROC expands into positive territory as an advance accelerates. ROC moves deeper into negative territory as a decline accelerates.
This stock is trading in an uptrend by making higher high and higher low formations since last one month. Recently, momentum oscillator ROC took reversal from a strong support zone standing around (-4.5) and managed to close above zero line in positive territory which indicates bullish momentum in progress. At the same time, this stock has given closing above 20 DMA and 50 DMA which is also supportive for positive price action. Understanding price action, technical parameters and oscillator one can start accumulating this stock.
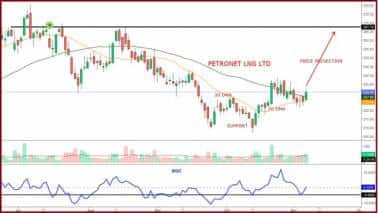 Figure.1. ROC and Buy signal on Petronet
Profit Booking
Looking at current price action and positive momentum, one can initiate long position for higher targets of the previous swing high. However, moving further Rs 267 will attract more profit bookings. So one can consider profit booking near Rs 255 and higher side towards Rs 267 mark.
Stop Loss
Entire bullish view negates on a breach of the immediate swing low and in a case of Petronet, we will consider Rs 215 as a stop loss.
Conclusion
We recommend buying Petronet LNG around Rs 230 with a stop loss of Rs 215 for higher targets of Rs 267 as indicated in the above chart.
(Shabbir Kayyumi is the Head - Technical Research at Narnolia Financial Advisors Ltd.)Disclosure: Narnolia Financial Advisors is a SEBI registered Research Analyst having SEBI Registration No. INH300006500. The Company/Analyst (s) does/do not have any holding in the stocks discussed but these stocks may have been recommended to clients in the past. Clients of Narnolia Financial Advisors Ltd. may be holding aforesaid stocks. The stocks recommended are based on our analysis which is based on information obtained from public sources and sources believed to be reliable, but no independent verification has been made nor is its accuracy or completeness guaranteed. The views expressed in this research report accurately reflect the personal views of the analyst(s) about the subject securities or issues, and no part of the compensation of the research analyst(s) was, is, or will be directly or indirectly related to the specific recommendations and views expressed by research analyst(s) in this report
Disclaimer: The views and investment tips expressed by investment expert on Moneycontrol.com are his own and not that of the website or its management. Moneycontrol.com advises users to check with certified experts before taking any investment decisions.

Discover the latest Business News, Sensex, and Nifty updates. Obtain Personal Finance insights, tax queries, and expert opinions on Moneycontrol or download the Moneycontrol App to stay updated!
Find the best of Al News in one place, specially curated for you every weekend.
Stay on top of the latest tech trends and biggest startup news.


