


Dear Reader,
Indian markets made a strong recovery during the week, with benchmark indices rising over two percent. The markets hit new highs, driven by robust foreign institutional investor (FII) buying on Thursday and positive global market trends.
For the week, the BSE Sensex went up by 1,707.01 points, or 2.10 percent, while the Nifty50 gained 504.35 points or 2.02 percent. Midcap and small-cap stocks also performed well, keeping pace with the benchmark indices.
Globally, markets were upbeat, with the US recovering from the previous week's sharp declines—the worst weekly drop for the S&P 500 since March 2023. A significant portion of this recovery was attributed to a notable surge in Nvidia shares following the company's optimistic outlook on artificial intelligence at an investment conference.
The markets also benefited from developments in the bond market, with the US benchmark 10-year Treasury yield trading at year-to-date lows. Analysts anticipate that the Federal Reserve will announce a 50-basis-point rate cut at its upcoming meeting.
European markets joined the rally, with the STOXX 600 rising by 1.85 percent following the European Central Bank's (ECB) decision to cut interest rates. The DAX increased by 2.17 percent, the CAC 40 was up by 1.54 percent, the FTSE MIB gained 0.83 percent, and the FTSE 100 closed with a 1.12 percent rise.
The ECB reduced its deposit rate for the second time this year, cutting it by a quarter point to 3.5 percent, which was in line with market expectations. Economic data from Europe indicates signs of weakening growth and slowing inflation.
The Nikkei 225 posted a modest gain of 0.5 percent as the yen strengthened against the dollar during the week. Notably, this increase occurred despite the Bank of Japan's hawkish stance regarding its monetary policy. A board member of Japan's central bank suggested that short-term rates need to be raised to around one percent in the second half of the year to address inflation risks and ensure price stability.
Meanwhile, the Chinese and Hong Kong markets continued to decline, with the Shanghai Composite falling by 2.23 percent and the Hang Seng dropping slightly by 0.43 percent.
Diverging Signals
The Nifty index recently reached a new all-time high for the week. However, the chart setup suggests it may form a rising wedge pattern, typically a bearish reversal signal. To confirm a breakdown, the index needs to close below the support line of the rising wedge, currently at 24,950. Conversely, if the Nifty breaks above the resistance line at 25,460, the rising wedge pattern would be invalidated, putting the bulls in a stronger position.
The sentiment data for the Nifty is currently mixed, so we will need to rely on price movements to determine its direction.
The 20-Day Advance/Decline (A/D) ratio is in a neutral range (see chart Advance Decline Ratio), but breadth has been expanding with the recent rise. If the Nifty breaks out on the upside, the 20-Day A/D ratio has room to increase further, as it is not yet in the overbought zone. This could lead to continued expansion of breadth and positive momentum soon.
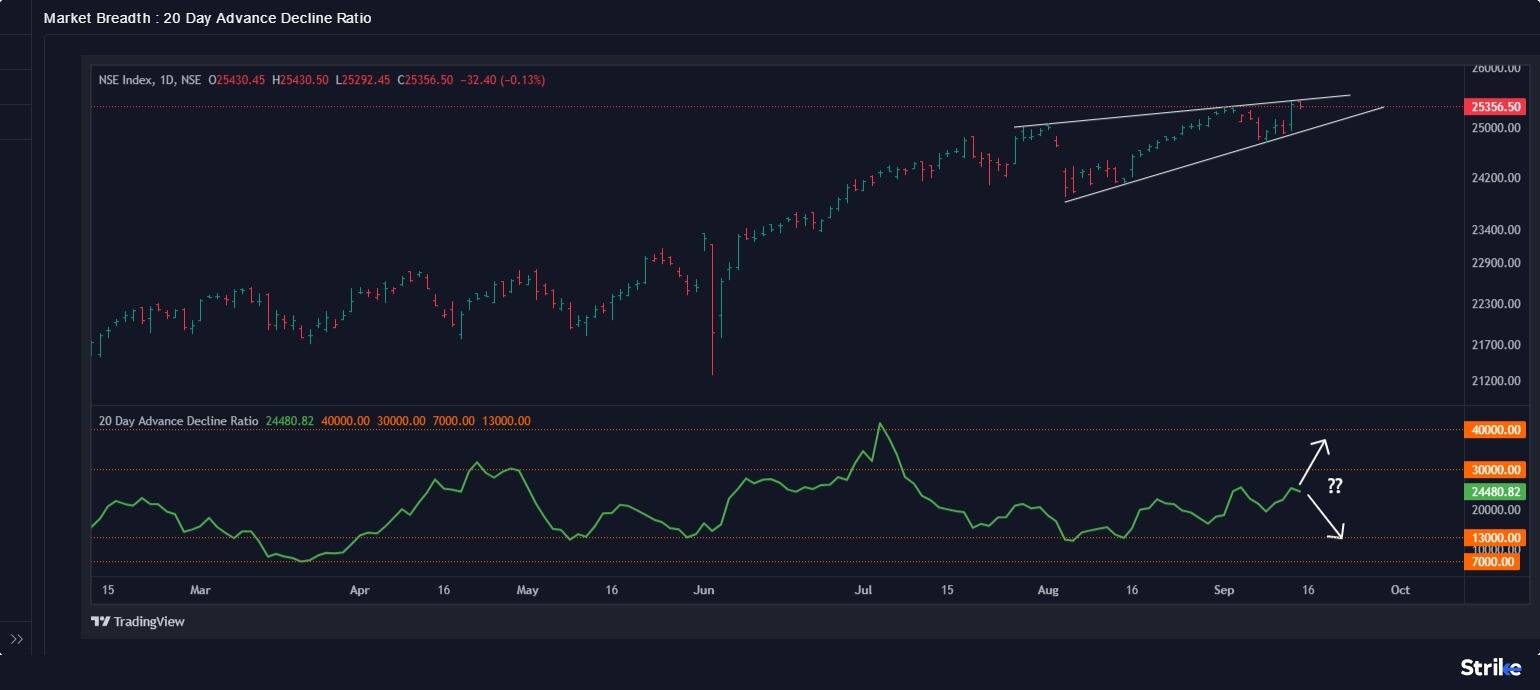
Advance Decline Ratio
Source: web.strike.money
Despite the recent rise in the Nifty index, the Open Interest Put-Call Ratio (OI PCR) – 9-day moving average is declining (see chart Put Call Ratio). This indicates that smart money is increasing its short positions in call options relative to put options, creating a divergence between the Nifty index and the OI PCR indicator. We now have two possibilities: one, Nifty could continue making higher highs, and the OI PCR might start to rise again, or Nifty could experience a correction and align with the declining trend of the OI PCR. In the event of a decline, the support level at 29,450 will be a key level to watch.
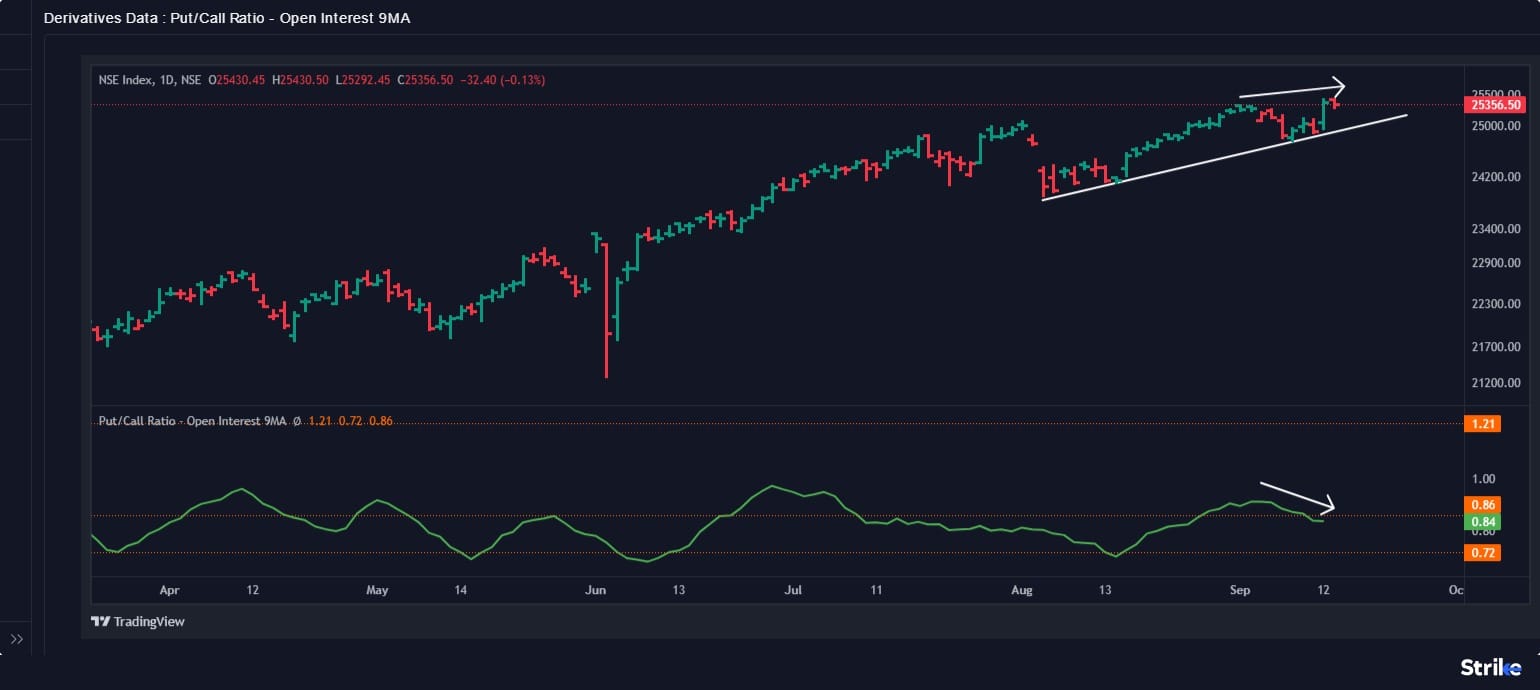
Put Call Ratio
Source: web.strike.money
The FIIs' net long position in index futures is currently above the second threshold. However, there is still a negative divergence, as the Nifty index is reaching new highs, but the FIIs' net long position does not match the previous peaks (see chart FII net index position). This divergence may persist until we observe a reversal in the Nifty index. If the Nifty breaks the support level at 24,950, it could trigger a deeper correction.

FII net index position
Source: web.strike.money
Sector Rotation
The Weekly Relative Rotation Graph (RRG) from India Charts indicates that there have been few changes in the Weekly RRG setup. FMCG, IT, and Pharma sectors continue strengthening their position in the leading quadrant, while the Realty index has joined Banks, Energy, and Metals in the Lagging quadrant.
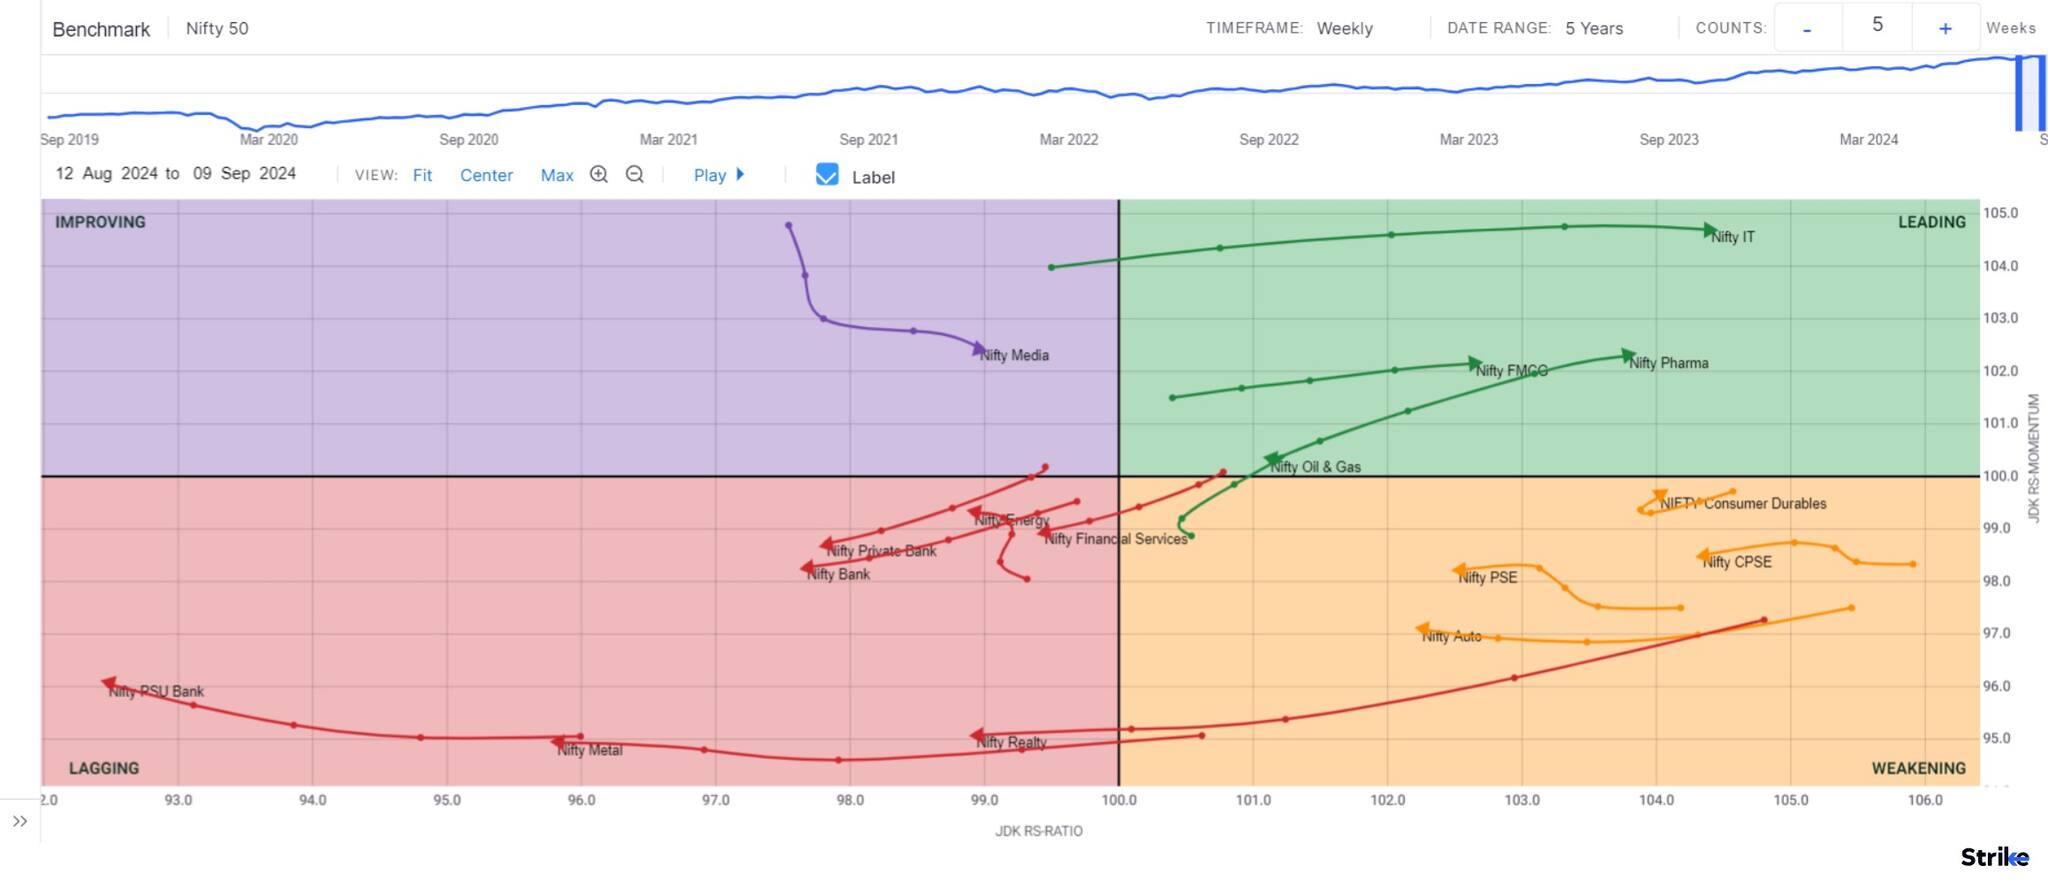
Weekly RRG
Source: web.strike.money
In a week of positive market performance, the PSE and Oil & Gas indices were the only sector indices to close in the negative. Nifty IT is shifting between the leading and weakening quadrants as it loses momentum. Nifty Consumer Durables and FMCG have returned to the leading quadrant.
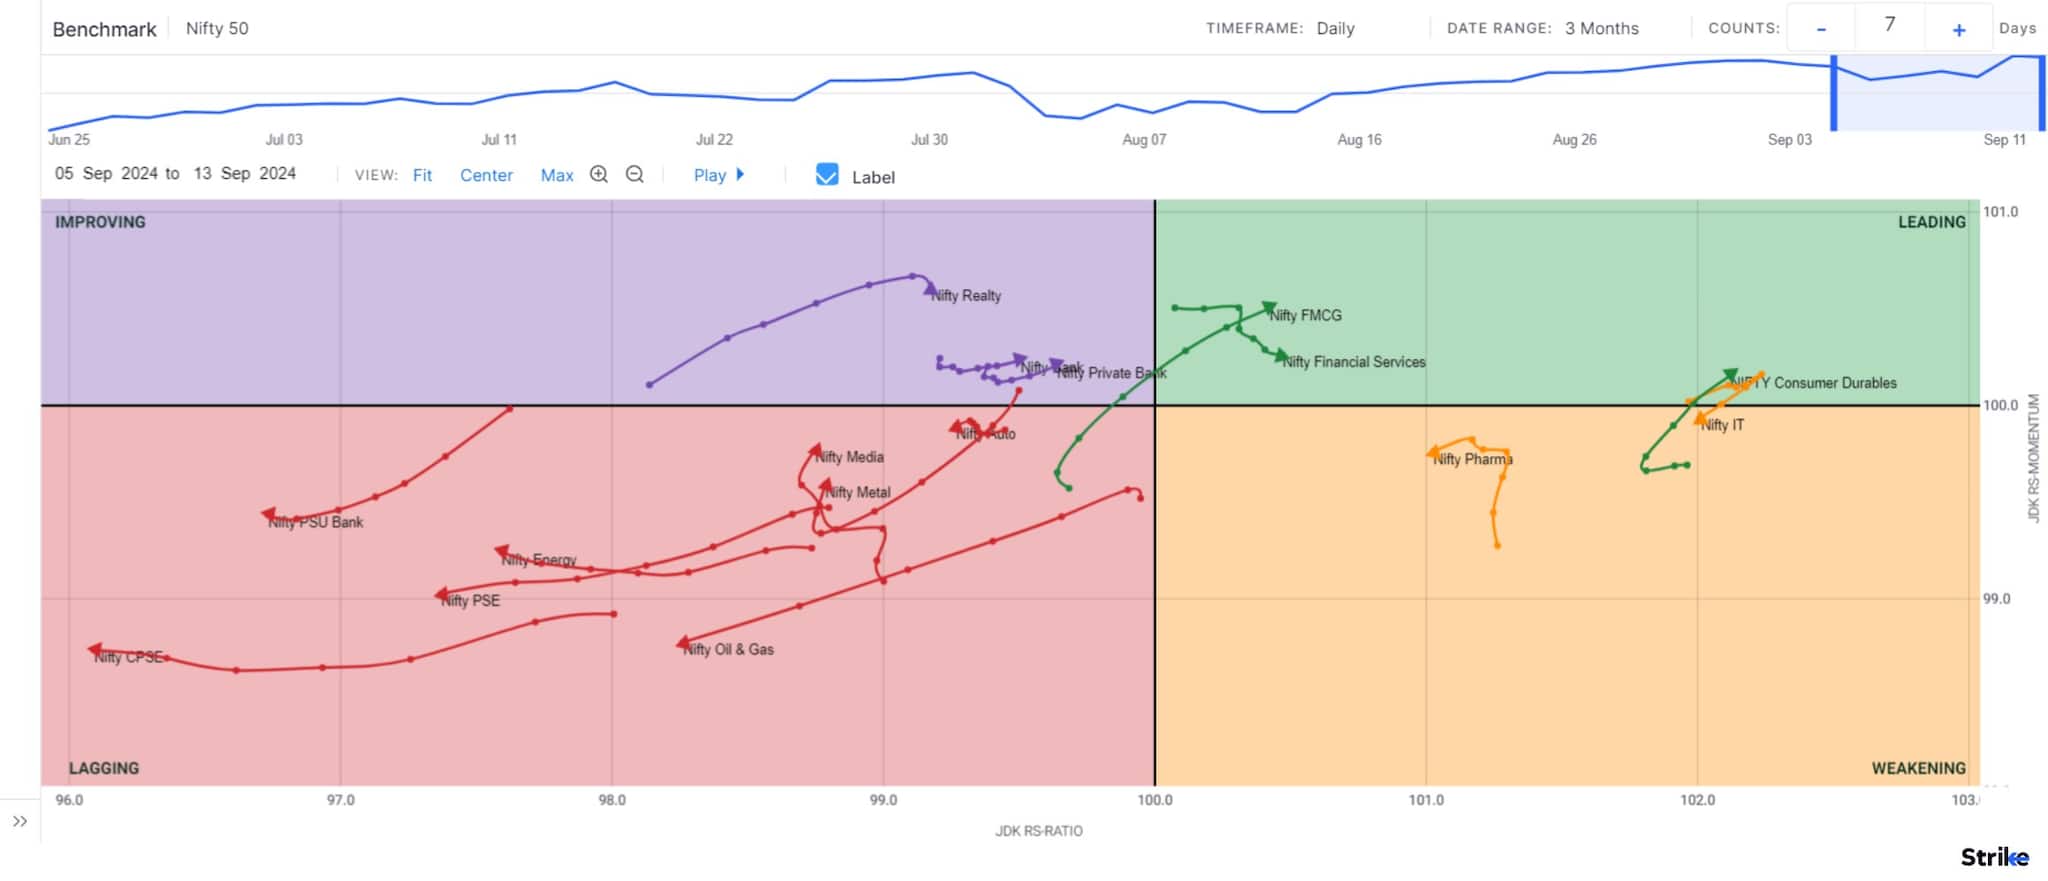
Daily RRG
Source: web.strike.money
Nifty Pharma remains in the weakening quadrant, although its relative momentum is rising. Nifty Financial Services has outperformed other banking indices and is positioned in the leading quadrant. Meanwhile, Nifty Realty has experienced a boost in relative momentum and is now in the improving quadrant.
Stocks to watch
Among the stocks that are expected to perform better during the week are Tech Mahindra, ICICI Bank, Sun Pharma, Ceat, Hindustan Unilever, TVS Motors, Tata Communication, Trent, ITC and Cipla.
Among the weaker stocks are RBL and IDFC First.
Cheers,Shishir Asthana

Discover the latest Business News, Sensex, and Nifty updates. Obtain Personal Finance insights, tax queries, and expert opinions on Moneycontrol or download the Moneycontrol App to stay updated!
Find the best of Al News in one place, specially curated for you every weekend.
Stay on top of the latest tech trends and biggest startup news.


