


Kagi Charts are used to display the general levels of supply and demand of a particular asset by visualising the price actions through a series of line patterns. These charts are time-independent and help filter out the noise that can occur on other financial charts.
While Kagi Charts do display dates or time on their x-axis, these are in fact markers for the key price action dates and are not part of a normal timescale. The y-axis on the right-hand side is used as the value scale. When a horizontal line joins a rising line with a plunging line it's known as a 'shoulder', while a horizontal line connecting a plunging line with a rising line is known as a 'waist'. Sometimes the lines are thin; while at other times the lines will be thick and bolded. The thickness of the line changes when the price reached the high or low of the previous vertical line. Also, the direction of the line changes when the price reaches a preset reversal amount.
Why to buy Apollo Tyres?
Traders use the shift from thin (Yin) to thick (Yang) lines (and vice versa) as signals to buy or sell an asset. A Yin-to-Yang shift indicates buy, while a Yang-to-Yin shift indicates sell.
Day-to-day price fluctuations can make it extremely difficult for traders in the financial markets to determine the true trend of an asset. Luckily for traders, methods such as Kagi charting have helped put an end to focusing on unimportant price moves that do not affect future momentum. At first, a Kagi chart can seem like a confusing series of randomly placed lines, but in reality, the movement of each line depends on the price and can be used to generate very profitable trading signals.
Buy signalApollo Tyres is currently trading with bullish bias which is indicated by thick green lines on Kagi chart. This script is trading in rising channel plotted by connecting support and resistance points which shows that stock is in rising mode and can be bought until the lower trend line is intact. Recently it has given a breakout of an important pattern on price action called 'Inverted 3 Buddha Pattern'; denotes prices have given trend reversal breakout and trading higher. Understanding above mentioned price action, one should opt for buy on dip strategy and accumulate this stock.
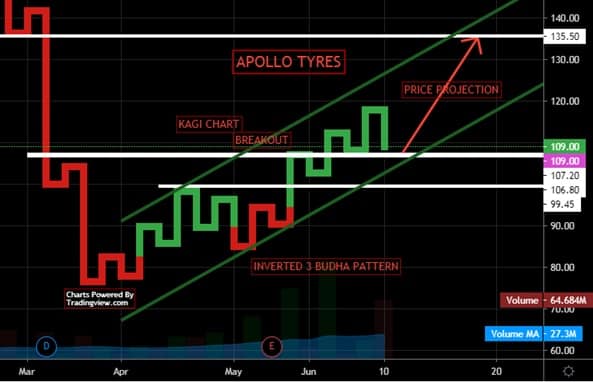 Figure.1. Kagi and Buy signal on Apollo TyresProfit booking
As per one of the methods of the Kagi chart, one can use previous 'waist' for profit booking. These levels are standing around Rs 135 and should provide immediate resistance on the higher side, moving further Rs 142 will attract more profit bookings. So one can consider profit booking near Rs 135 and higher side towards Rs 142 mark.
Stop lossEntire bullish view negates on a breach of immediate support zone or the 'waist' and in the case of Apollo Tyres, we will consider Rs 99 as a stop-loss level closing basis.
We recommend buying Apollo Tyres around Rs 109 with a stop loss of Rs 99 for higher targets of Rs 135/142 as indicated in the above chart.
The author is Head - Technical Research at Narnolia Financial Advisors Ltd.Disclosure: Narnolia Financial Advisors/Analyst (s) does/do not have any holding in the stocks discussed but these stocks may have been recommended to clients in the past. Clients of Narnolia Financial Advisors Ltd. may be holding aforesaid stocks. The stocks recommended are based on our analysis which is based on information obtained from public sources and sources believed to be reliable, but no independent verification has been made nor is its accuracy or completeness guaranteed. The views expressed in this research report accurately reflect the personal views of the analyst(s) about the subject securities or issues, and no part of the compensation of the research analyst(s) was, is, or will be directly or indirectly related to the specific recommendations and views expressed by research analyst(s) in this report.Disclaimer: The views and investment tips expressed by investment expert on Moneycontrol.com are his own and not that of the website or its management. Moneycontrol.com advises users to check with certified experts before taking any investment decisions.
Discover the latest Business News, Sensex, and Nifty updates. Obtain Personal Finance insights, tax queries, and expert opinions on Moneycontrol or download the Moneycontrol App to stay updated!
Find the best of Al News in one place, specially curated for you every weekend.
Stay on top of the latest tech trends and biggest startup news.


