


Recently, the market experienced a minor correction at around 23.6 percent Fibonacci retracement of the prior upward move, which spanned from March 2023 at 16,828 to July 2023 at 19,991. However, in the latest week, the Nifty index not only breached but also sustained its position above the significant psychological level of 20,000, achieving fresh all-time highs at 20,167. This development strongly signals the robustness of the primary bullish trend.
On a weekly scale, the Nifty index displayed the Three White Soldiers candlestick pattern, a well-known indicator of a potent bullish trend. Additionally, the Nifty witnessed a breakout from a Saucer pattern on daily charts, further reinforcing the positive outlook.
The relative strength index (RSI), serving as a momentum indicator, has been consistently on the rise and has remained above the 65 mark when viewed on daily charts. This ongoing upward momentum in the RSI underpins the strengthening positive sentiment for the index in the short term.
Regarding crucial levels, the index finds robust support at 19,865, aligned with the low of the current week, and subsequent support at 19,432. On the upside, potential resistance levels may emerge around 20,604. This level represents the 38.2 percent Fibonacci extension level, calculated from the previous advance originating from 16,828 to 19,991 and projected from the 19,223 level.
Taking all these factors into consideration, it is evident that the Nifty Index is currently entrenched in a compelling bullish trend, with the potential to advance toward the 20,604 levels in the short to medium term. Nevertheless, it remains crucial to monitor the 19,865 level as a breach below it could cast doubt on this bullish perspective.
Here are three buy calls for next 2-3 weeks:Bank of India: Buy | LTP: Rs 107.25 | Stop-Loss: Rs 102 | Target: Rs 125 | Return: 16 percentSince its decline beginning in December 2022, the stock has established a stable range, fluctuating between Rs 70 and Rs 100. Now, the stock is breaking free from this range and is trading at its highest level since April 2018.
This upward movement, supported by Rising Gap, suggests the start of a bullish trend, as evidenced by the Rounding Bottom pattern breakout.
The stock consistently hovers above the 12-day exponential moving average (EMA), further emphasizing its bullish trajectory.
Supporting this positive direction, the MACD (moving average convergence divergence) momentum indicator displays a favorable crossover, indicating sustained positive momentum.
Going ahead we expect the prices to move higher till Rs 125 where stop-loss must be Rs 102 closing basis.

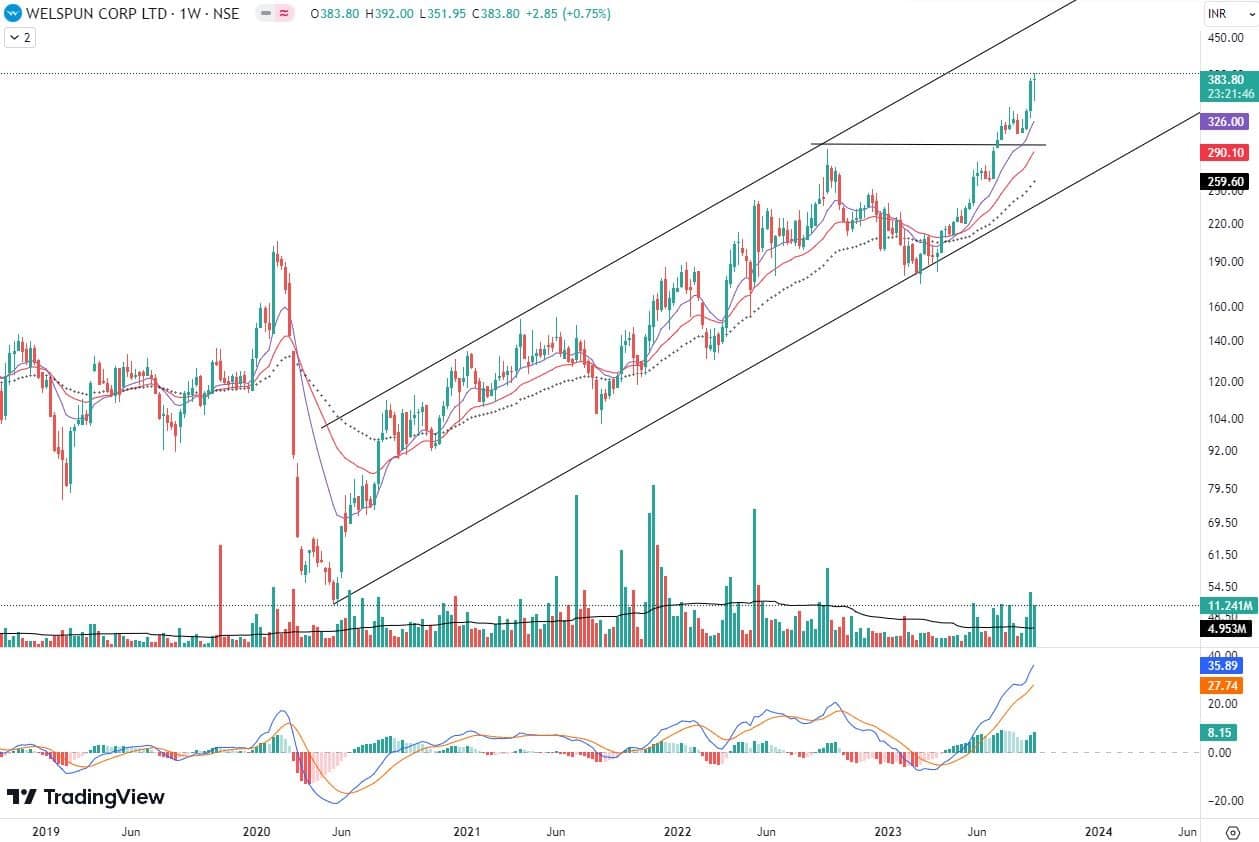
The stock showcases a consistent pattern of higher highs and higher lows, supported by an escalating volume trend, hinting at a substantial buildup driving the prices.
In early July 2023, the stock notably broke through the rounding bottom pattern, signaling the onset of an upward trajectory. Currently, its trading stance above both the 12 & 26-week EMA solidifies its bullish trend.
Further endorsing this positive outlook, the MACD has registered a positive crossover, emphasizing the prevailing upward momentum.
Going ahead we expect the prices to move higher till Rs 440 where stop-loss must be Rs 366 closing basis.
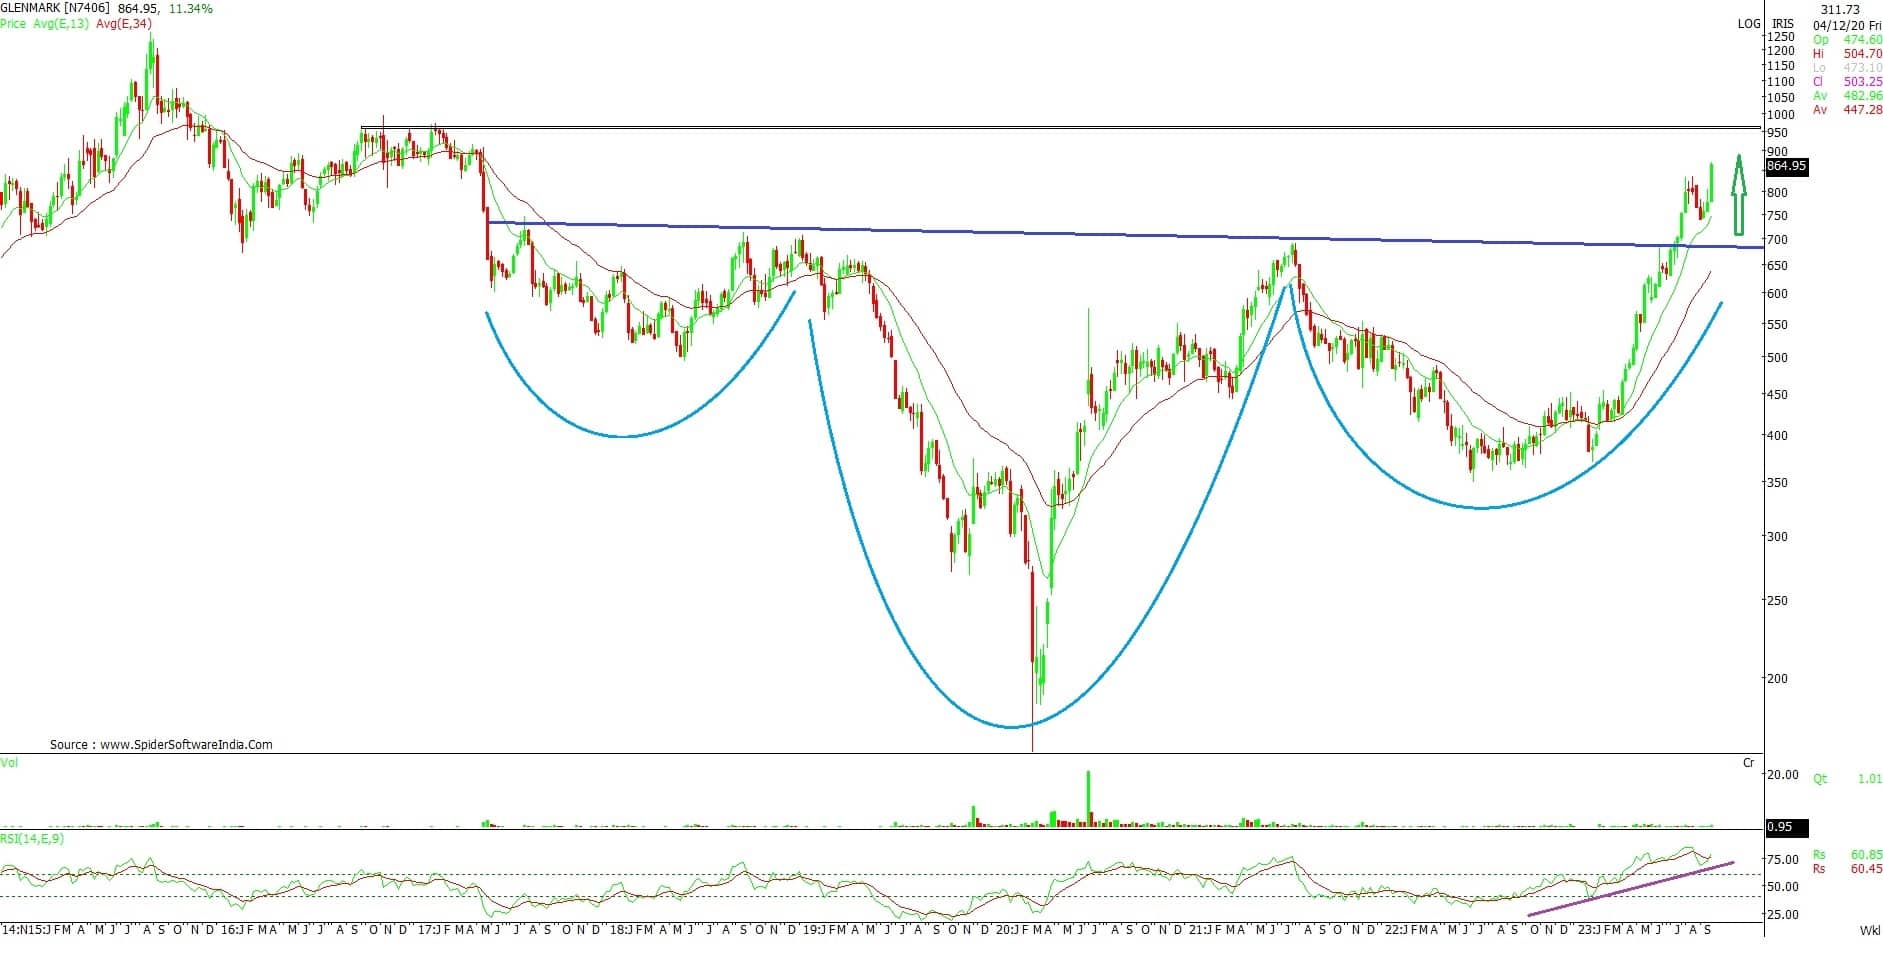
The current market situation for stock is quite favourable, with it trading at multi-year high levels. On a weekly basis, there has been a notable breakout from an Inverted Head & Shoulder pattern, indicating a robust positive sentiment for the medium to long term. Furthermore, on the daily charts, a Cup & Handle pattern breakout has occurred, which has been confirmed by trading volume, adding further confidence to the bullish outlook.
An encouraging aspect is that the stock price has consistently maintained itself above key moving averages, including the 50, 100, and 200-day Simple Moving Averages (SMA), and these averages are showing a positive alignment. This serves as a strong validation of the optimistic outlook for the stock.
Additionally, both the weekly and daily RSI indicators are on an upward trajectory and are holding above the 65 level. This implies significant positive momentum in the stock's price movement.
Considering these technical indicators, there is a reasonable expectation that the stock could continue its upward trajectory, potentially reaching Rs 970 price level. However, it's essential to manage risk effectively, and a prudent approach would be to establish a stop-loss level at Rs 810 on a closing basis.

Discover the latest Business News, Sensex, and Nifty updates. Obtain Personal Finance insights, tax queries, and expert opinions on Moneycontrol or download the Moneycontrol App to stay updated!
Find the best of Al News in one place, specially curated for you every weekend.
Stay on top of the latest tech trends and biggest startup news.


