


Williams %R was developed by famous technical analyst and charting enthusiast 'Larry Williams'. Williams %R is a momentum indicator that is the inverse of the Fast Stochastic Oscillator. It is also referred to as %R and pronounced as Percent R. Williams %R reflects the level where the current close is relative to the highest high during the look-back period.
What is a 'Williams %R Indicator'?The Williams %R, or just %R for short, is an indicator that oscillates between 0 and -100, providing insight into the weakness or the strength of a stock. It's used in various capacities including identifying overbought/oversold levels, momentum confirmations as well as finding trade signals.
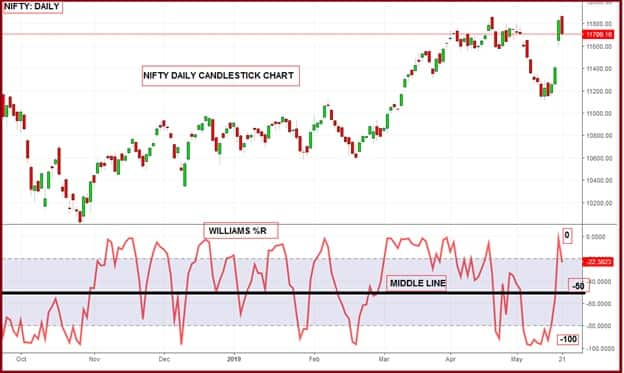 Figure .1.Illustration of %R Indicator
It compares a stock's closing price to the high-low range over a specific period, typically 14 days or periods. Williams %R oscillates from 0 to-100; readings from 0 to -20 are considered overbought, while readings from -80 to -100 are considered oversold.
Construction of %R IndicatorUnderstanding the underlying formula used for construction of %R helps traders to take a prudent decision, while trading complex scenarios. Calculating the indicator is no longer required, as charting platforms and trading software do it for us. Although knowing how the indicator is calculated will help one better understand the indicator and its strengths and weaknesses. %R indicator is calculated using the following formula:
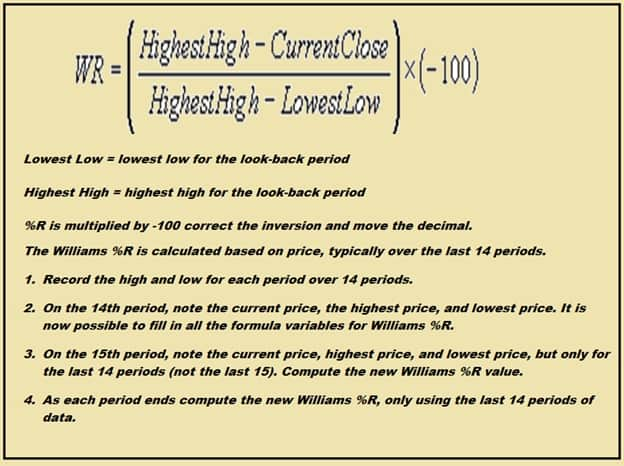 Figure .2. %R Indicator Formula
The Williams %R is available on most trading platforms, such as Tradingview and MetaTrader. The indicator is also available on many free online charting sites, such as Investing.com, StockCharts.com and Yahoo! Finance.
Working of %R Indicator—Like the most momentum oscillators, the %R appears on a chart in a separate window below the price chart. The %R is plotted against a middle line of -50that differentiates strength of the trend.
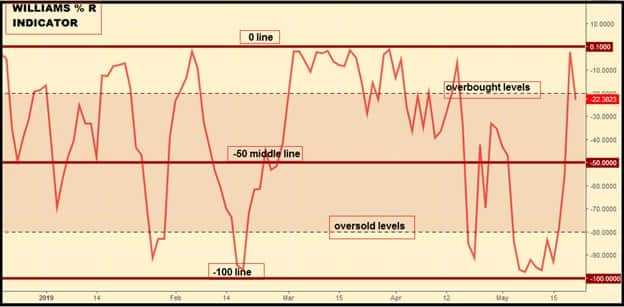 Figure .3.%R Oscillator
—The main assumption underlying this indicator is that a stock's price will close regularly at new highs during an uptrend, and regularly make new lows in a downtrend.
—The indicator focuses on the last 14 periods but is scaled to zero and -100. %R reading above -50 means the price is moving upward. A reading near -100 means oversold levels.
—An overbought or oversold reading doesn't mean the price will reverse. Overbought simply means the price is near the highs of its recent range, and oversold means the price is in the lower end of its recent range.
—Can be used to generate trade signals when the price and the indicator move out of overbought or oversold territory.
—Like all technical indicators, it is important to use the Williams %R in conjunction with other technical analysis tools.
Trading Technique:Williams % R gives us 3 types of trading signal. They are as follows-
—It defines the overbought and oversold zone
—It defines failure swings
—It identifies bullish and bearish divergence
Volume, chart patterns and breakouts can be used to confirm or refute signals produced by Williams %R. The centerline, -50, is an important level to watch. If one is familiar with divergence then one can use the Williams %R divergence to confirm if the price of the stock is going to continue trending in the current direction or would it likely reverse directions anytime soon. Williams %R divergences are considered very powerful.
Usage of Trend lines & Moving Average is the most effective way while trading with %R Indicator. Moving Average and %R together are used to develop trading strategy. Key points about it are discussed below-
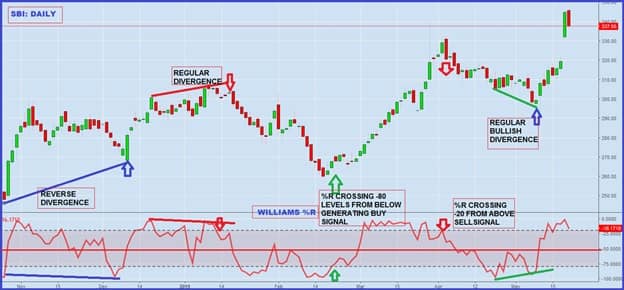 Figure .4.%R Indicator & SMA Buy & Sell Signals
Entry
—%R below -80
—Regular bullish divergence in prices
—Buy signal is generated after a cross above -80 from below.
Exit
—One can use multiple ways to book profit & exit, like %R near -50 or %R near -20 .
Sell Signal:-Entry
—%R above -20
—Regular bearish divergence in prices
—Sell signal is generated after a cross below -20 from above as indicated
Exit
—One can use multiple ways to book profit & exit, like %R near -50 or %R near -80.
Fast Stochastic and %R—The Williams %R and the Fast Stochastic Oscillator are very similar. The optical difference between the two is how the indicators are scaled.
—The Williams %R represents a market’s closing level versus the highest high for the lookback period. Conversely, the Fast Stochastic Oscillator, which moves between 0 and 100, illustrates a market’s close in relation to the lowest low.
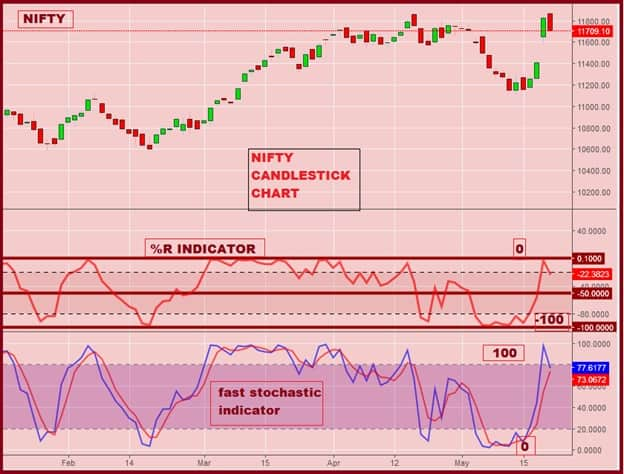 Figure .5.%R Indicator & Consolidations
—Williams %R is a momentum oscillator that measures the level of the close relative to the high-low range over a given period of time.
—Williams %R is an overbought and oversold technical indicator that may offer potential buy and sell signals.
—One can use the Williams %R divergence to confirm if the price of the stock is going to continue trending in the current direction or would it likely reverse directions anytime soon.
(The author is Head - Technical & Derivative Research at Narnolia Financial Advisors Ltd.)Disclaimer: The views and investment tips expressed by investment expert on Moneycontrol.com are his own and not that of the website or its management. Moneycontrol.com advises users to check with certified experts before taking any investment decisions.Discover the latest Business News, Sensex, and Nifty updates. Obtain Personal Finance insights, tax queries, and expert opinions on Moneycontrol or download the Moneycontrol App to stay updated!
Find the best of Al News in one place, specially curated for you every weekend.
Stay on top of the latest tech trends and biggest startup news.