


The Indian equity market remained under pressure for the second consecutive week ended March 17, dampened by a nervousness that gripped markets around the world, especially after a banking crisis rattled the US.
The Nifty50 slumped below its five-month low of 16,850 in later part of the week, followed by a late-hour recovery to 17,100. The index, however, ended down 1.8 percent for the week.
It formed long bearish candlestick pattern on the weekly timeframe with long lower wicks indicating some buying interest at lower levels. The index has made a lower-high-lower-low formation.
If we look at the daily charts, the Nifty50 has formed Long Legged Doji kind of a pattern with above-average volumes for the second consecutive day, indicating the possibility of a rebound in the coming sessions. The index gained about 250 points in the last two days from over a five-month low, but still far away from its 200-day SMA (simple moving average - 17,451).
Hence the index needs to hit and sustain above 17,451 for further uptrend, with a crucial support at 16,850, experts said.
"We are not entirely out of the woods and the broader trajectory remains tentative, but we may expect some bounce in the near term," Osho Krishan, Senior Analyst - Technical and Derivative Research at Angel One, said.
As far as levels are concerned, he feels the recent swing low of 16,900-16,850 is likely to act as the sheet anchor, and it is highly anticipated that the dip would augur well for the bulls.
On the flip side, the 17,200-17,250 is the immediate hurdle, followed by the sturdy wall of 200 SMA placed around the 17,400-17,450 odd zone, he said.
Rohan Patil, Technical Analyst at SAMCO Securities, also feels a positive divergence is also spotted which indicates the probability of bounce back at current levels, but the rebound can be short-lived as prices may face strong resistance at higher levels.
Technically, the structure has turned bearish and Nifty stands at the strong polarity support of 16,800 – 16,750 levels, failing to hold which the index is likely to see a further correction towards 16,450 – 16,400 zones, he said.
Hence, Osho advised traders to avoid aggressive bets and look for stock-specific action, while investors could now seize this opportunity by initiating accumulation in good blue-chip companies in a staggered manner.
Let's take a look at the top 10 trading ideas by experts for the next three-four weeks. Returns are based on the March 17 closing prices:
Expert: Shrikant Chouhan, Head of Equity Research (Retail) at Kotak Securities
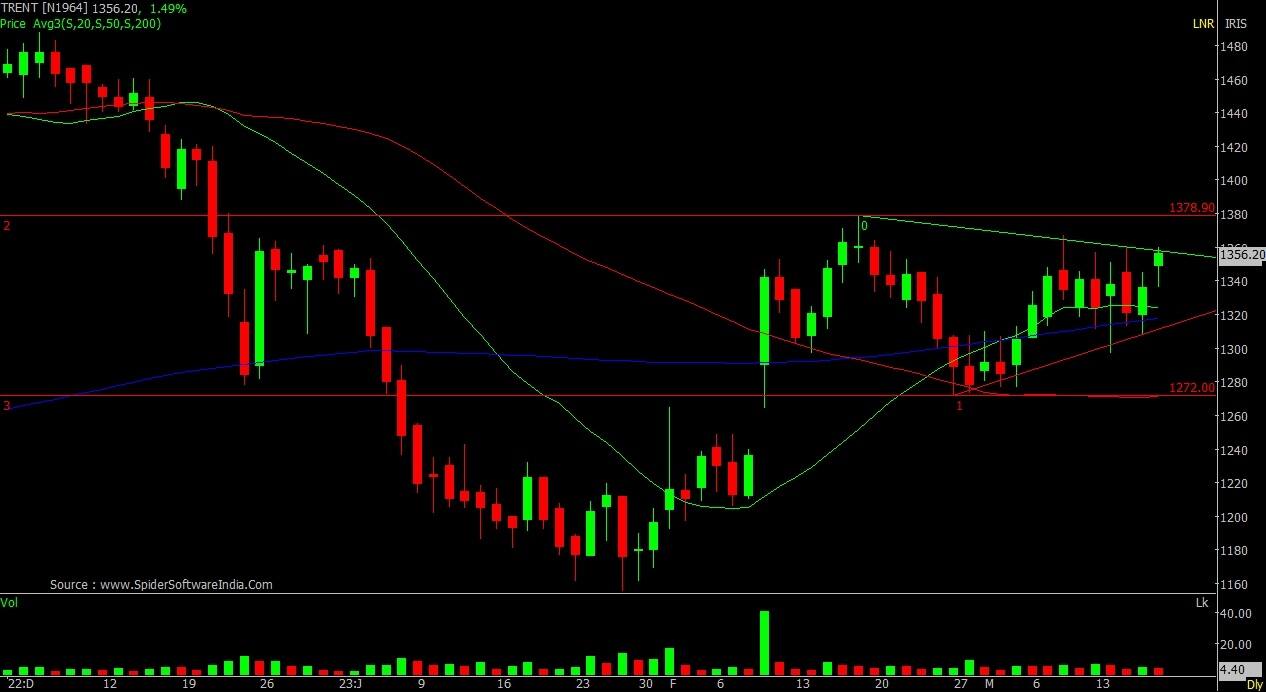
Trent: Buy | LTP: 1,356 | Stop-Loss: Rs 1,270 | Target: Rs 1,500 | Return: 11 percent
The stock is forming a bullish continuation after rallying to Rs 1,380 from Rs 1,150 levels. The rally was significant and unexpected. Technically, such formations suggest that the stock may move to the upside.
It is mandatory for the stock to cross Rs 1,380 level to validate the formation. However, the strategy should be to buy 50 percent more at current levels and on further declines till Rs 1,300.
For the same, keep a stop-loss at Rs 1,270. On the upside, it is likely to move towards Rs 1,440 and Rs 1,500 levels.
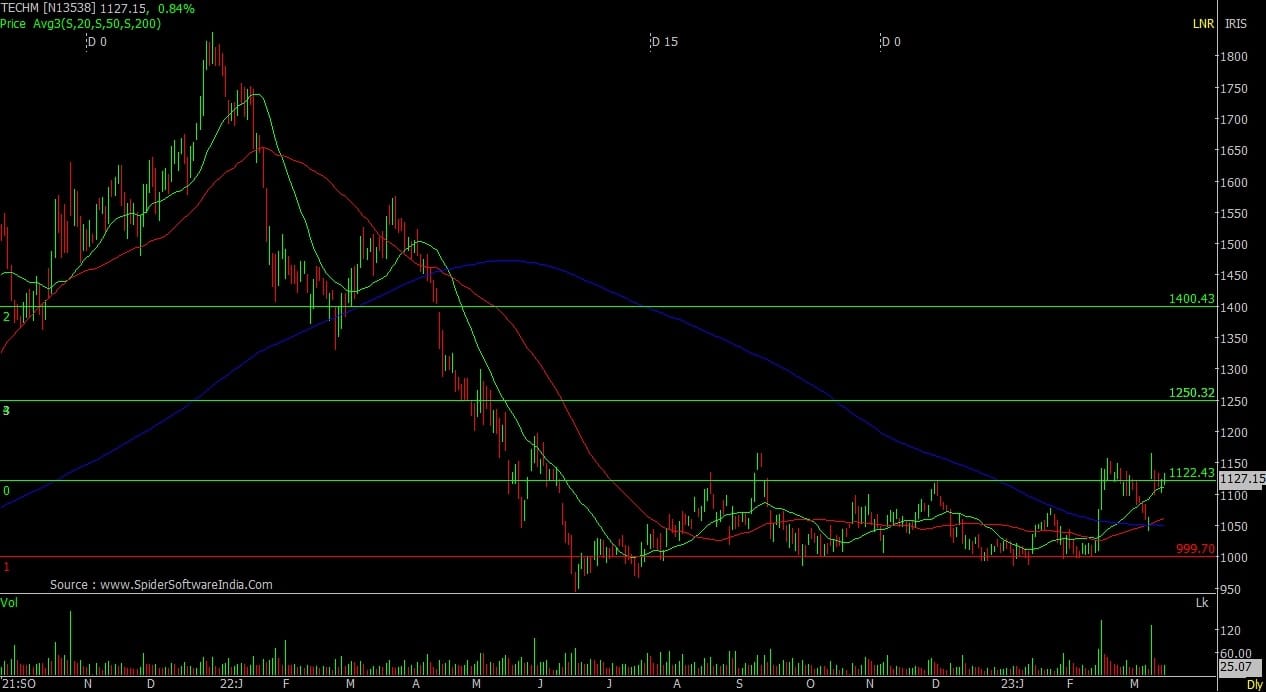
Tech Mahindra: Buy | LTP: Rs 1,127 | Stop-Loss: Rs 1,040 | Target: Rs 1,250 | Return: 11 percent
The stock has formed a base building formation between Rs 1,100 and Rs 1,000 levels. It has spent more than 9 months. It has broken the upward trading range with a positive outcome, which may lift the stock higher to partially pull back the previous losses.
In December 2021, it was at Rs 1,838 level and currently, it is at Rs 1,130. We can expect a partial retracement till Rs 1,400 with minor resistance near Rs 1,250.
The strategy should be to buy between Rs 1,130 and Rs 1,080. Keep a stop-loss at Rs 1,040.
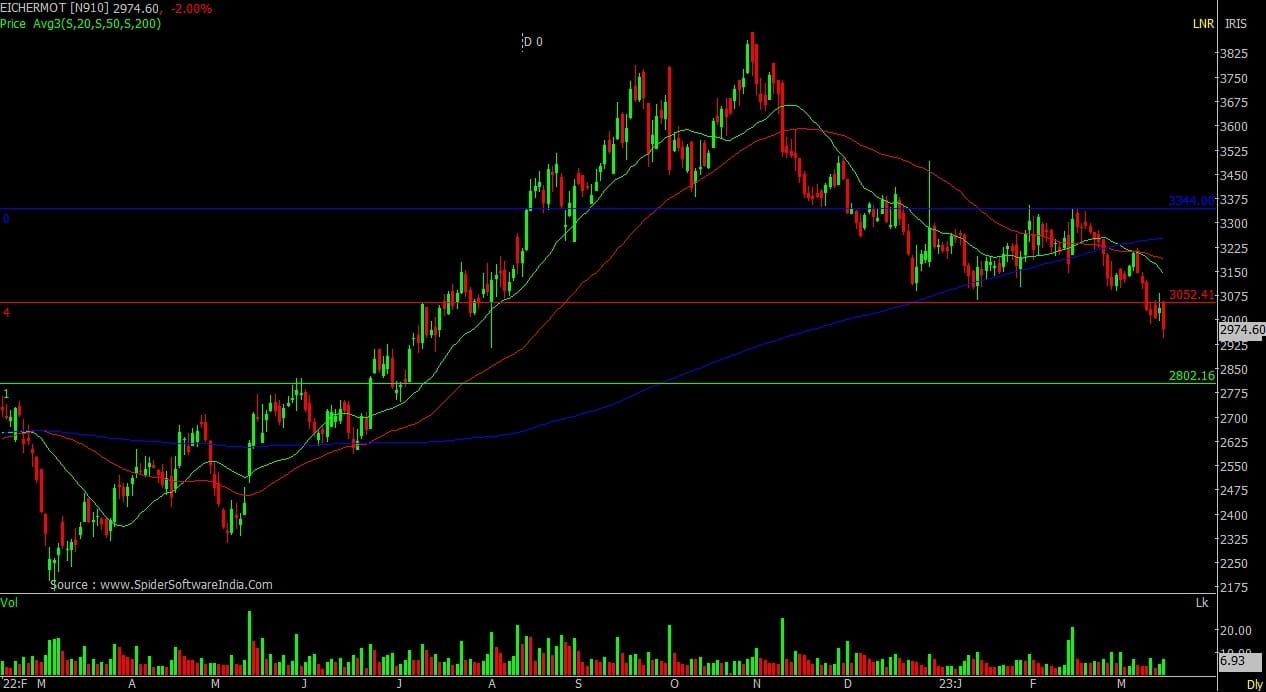
Eicher Motors: Sell | LTP: Rs 2,974 | Stop-Loss: Rs 3,105 | Target: Rs 2,800 | Return: 6 percent
After declining from Rs 3,890 high, it is taking multiple supports between Rs 3,050 and Rs 3,100. The Rs 3,050 level was especially important as it is a 50 percent retracement ratio for the entire rally that the stock has displayed during 2022.
However, on Friday the stock gave up the support which was at Rs 3,050 and closed below the same which would trigger further weakness. In the near future, below Rs 3,050 level, the next major support lies at Rs 2,800 level. It is recommended to create short positions at Rs 3,020 and Rs 3,050, with a stop-loss at Rs 3,105.
Expert: Nandish Shah, Senior Derivative & Technical Analyst at HDFC Securities
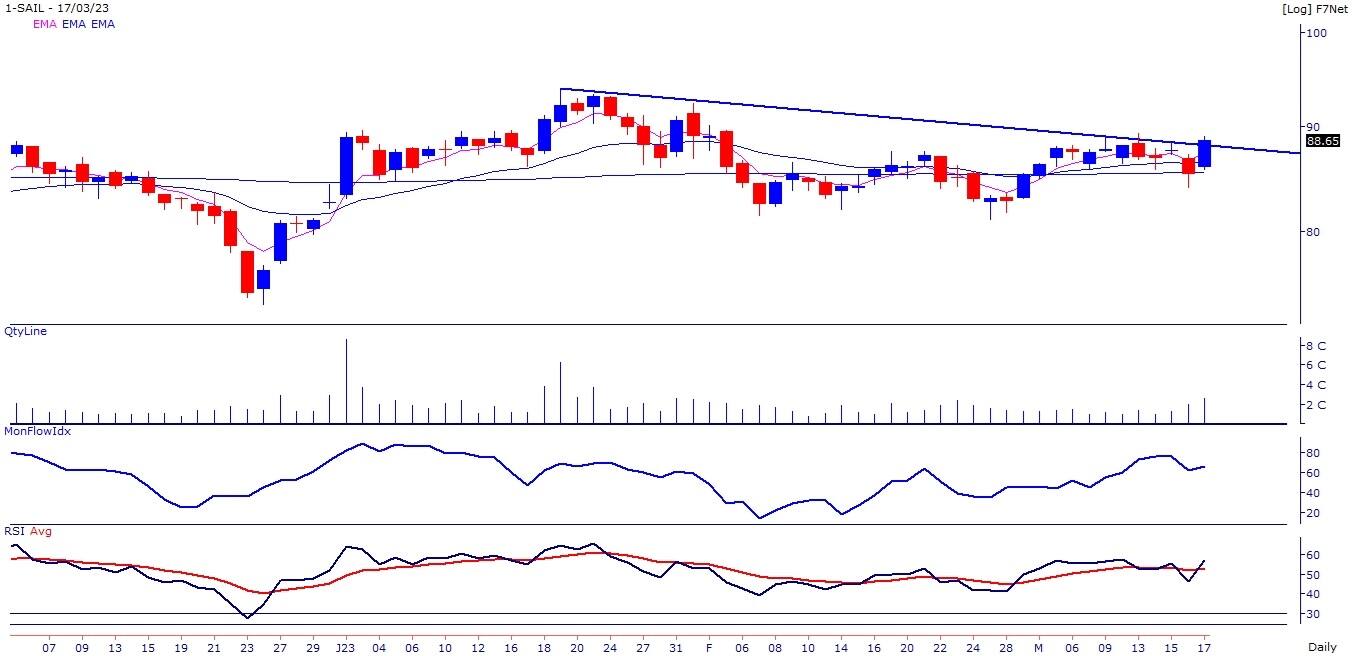
SAIL: Buy | LTP: Rs 88.65 | Stop-Loss: Rs 83 | Target: Rs 93-96 | Return: 8 percent
The stock price has broken out from the downward sloping trendline, adjoining the highs of January 19, 2023 and March 9, 2023.
Short term trend of the stock is positive as stock price is trading above its 5 and 20-day EMA (exponential moving average). Momentum Oscillators - RSI (relative strength index - 11) and MFI (money flow index - 10) is sloping upwards and placed above 50 on the daily chart, indicating strength in the stock.
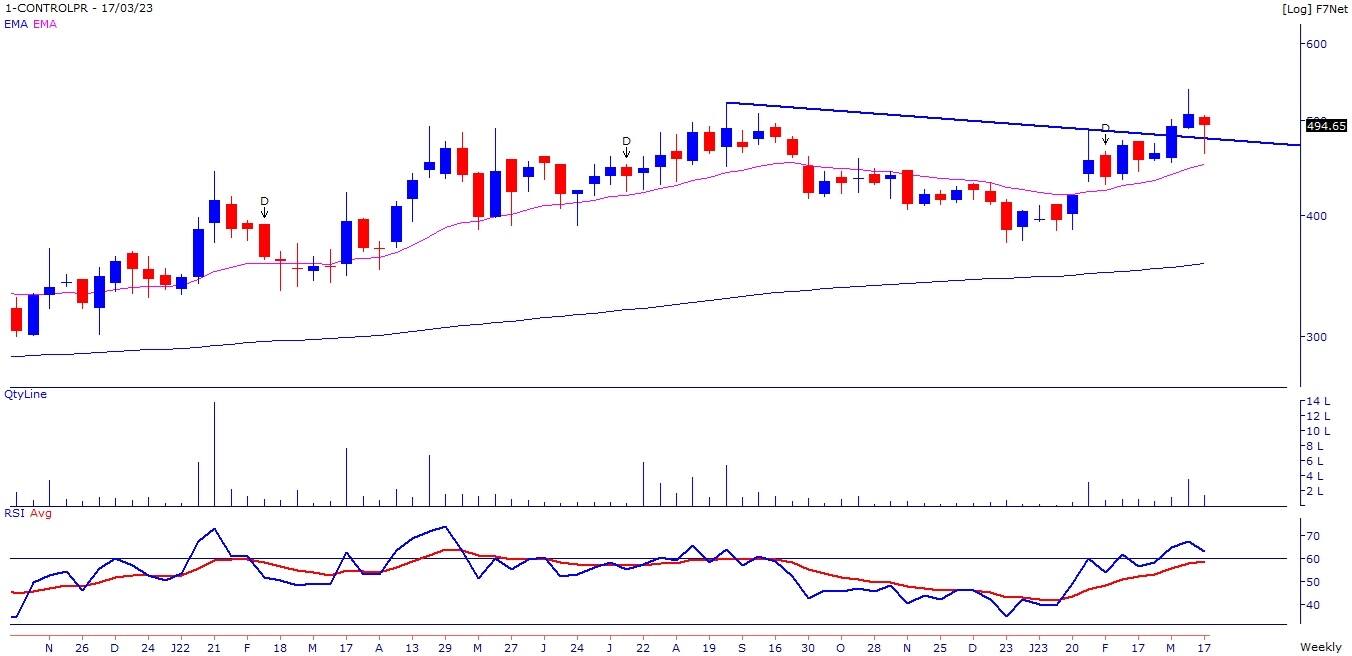
Control Print: Buy | LTP: Rs 495 | Stop-Loss: Rs 455 | Target: Rs 535-555 | Return: 12 percent
The stock price has broken out on the weekly chart from the downward sloping trendline, adjoining the weekly highs of August 26, 2022 and January 27, 2023.
Momentum Oscillators - RSI (11) and MFI (10) is sloping upwards and placed above 50 on the weekly chart, indicating strength in the stock. Stock price has corrected nearly 10 percent from the 5-year high which we believe is a running correction in an overall uptrend.
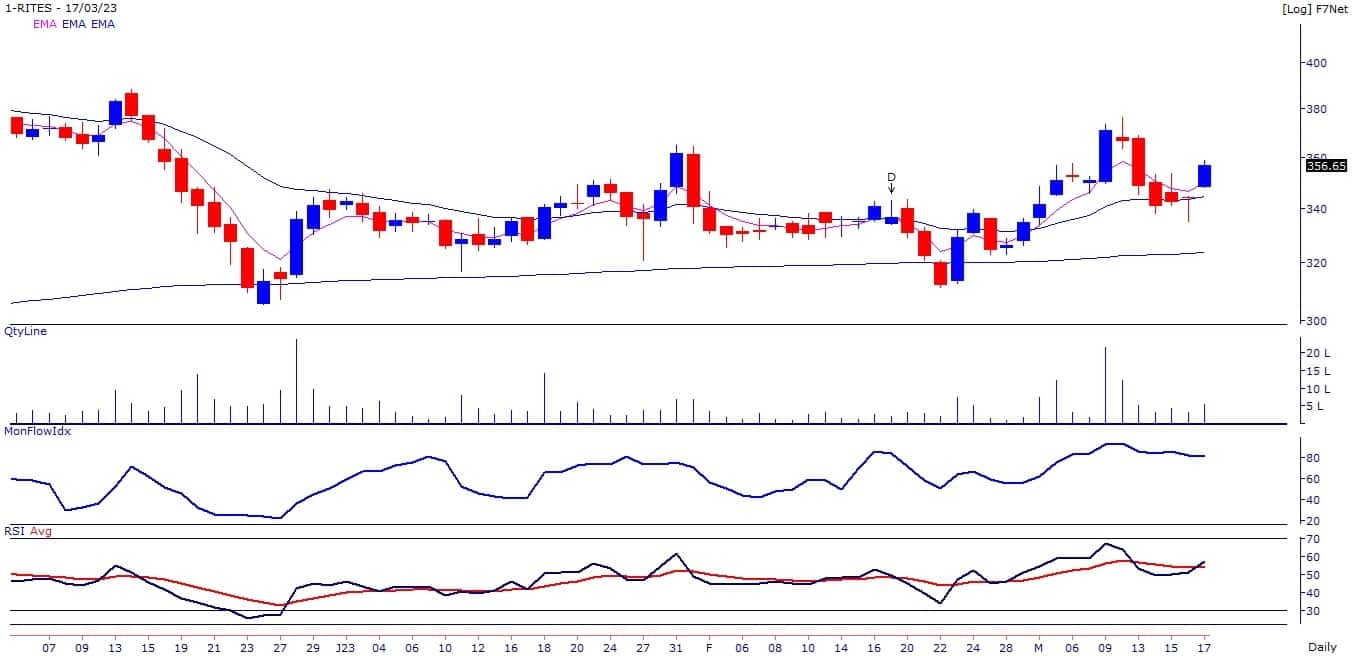
RITES: Buy | LTP: Rs 356 | Stop-Loss: Rs 331 | Target: Rs 380-395 | Return: 11 percent
After running correction of last few days, the stock price resumed its uptrend where it closes above its 5 and 20-day EMA.
Primary trend remains positive as stock price is trading above its 200-day EMA. Stock price has been forming bullish higher top higher bottom on the weekly chart. Momentum indicators and oscillators are showing strength in the stock.
Expert: Viraj Vyas, Technical & Derivatives Analyst - Institutional Equity at Ashika Stock Broking
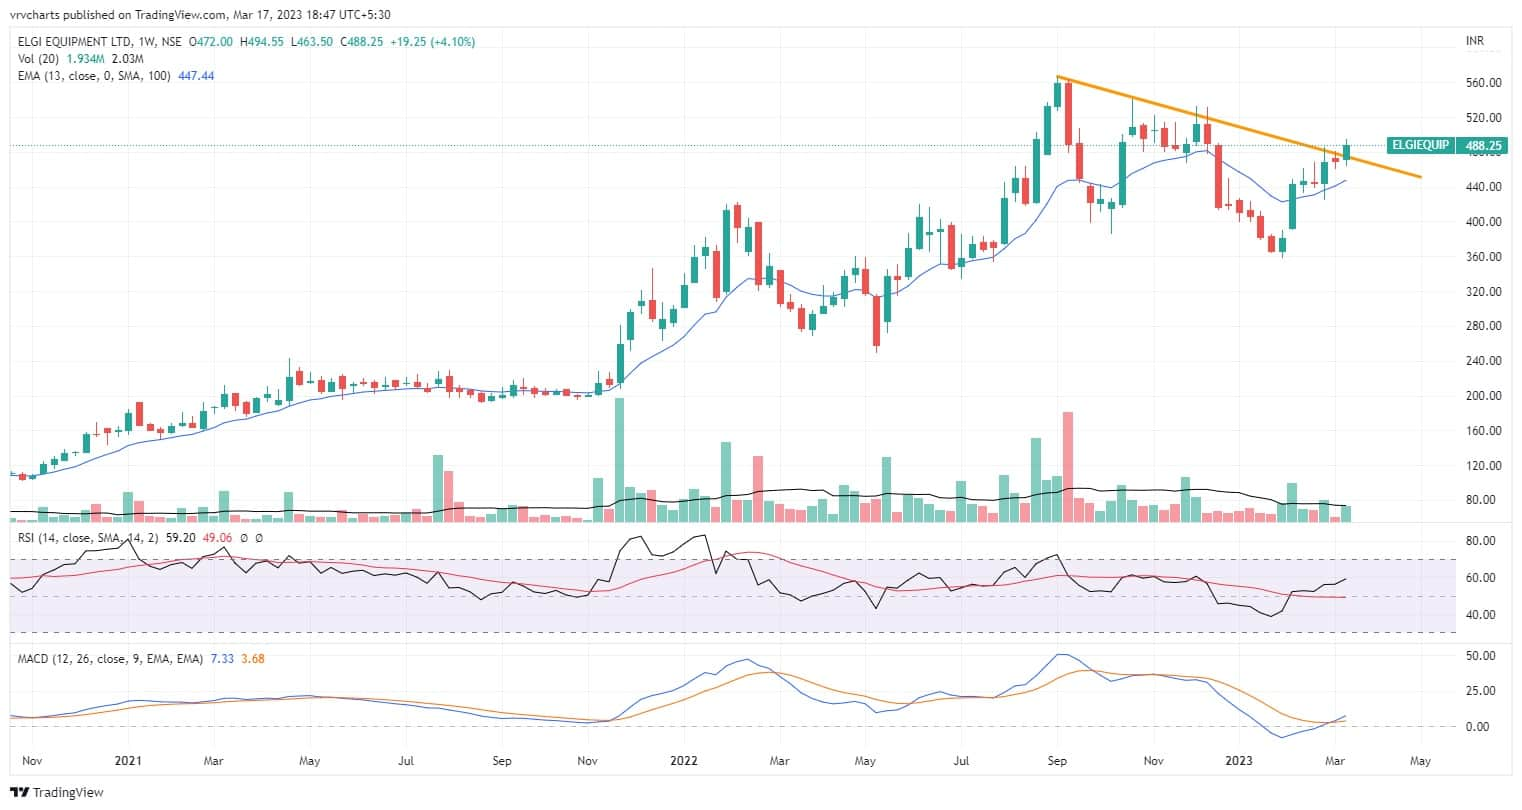
Elgi Equipments: Buy | LTP: Rs 488 | Stop-Loss: Rs 460 | Target: Rs 540 | Return: 11 percent
The stock has enjoyed a strong upmove post May 2022 and has been consolidating time and price wise since September 2022. The stock has given a breakout from the downward sloping trendline on the weekly chart and continuing to sustain above Rs 480 augurs well for the next leg of the upmove.
The MACD (moving average convergence divergence) also indicates a positive crossover which reaffirms a bullish stance on the stock.
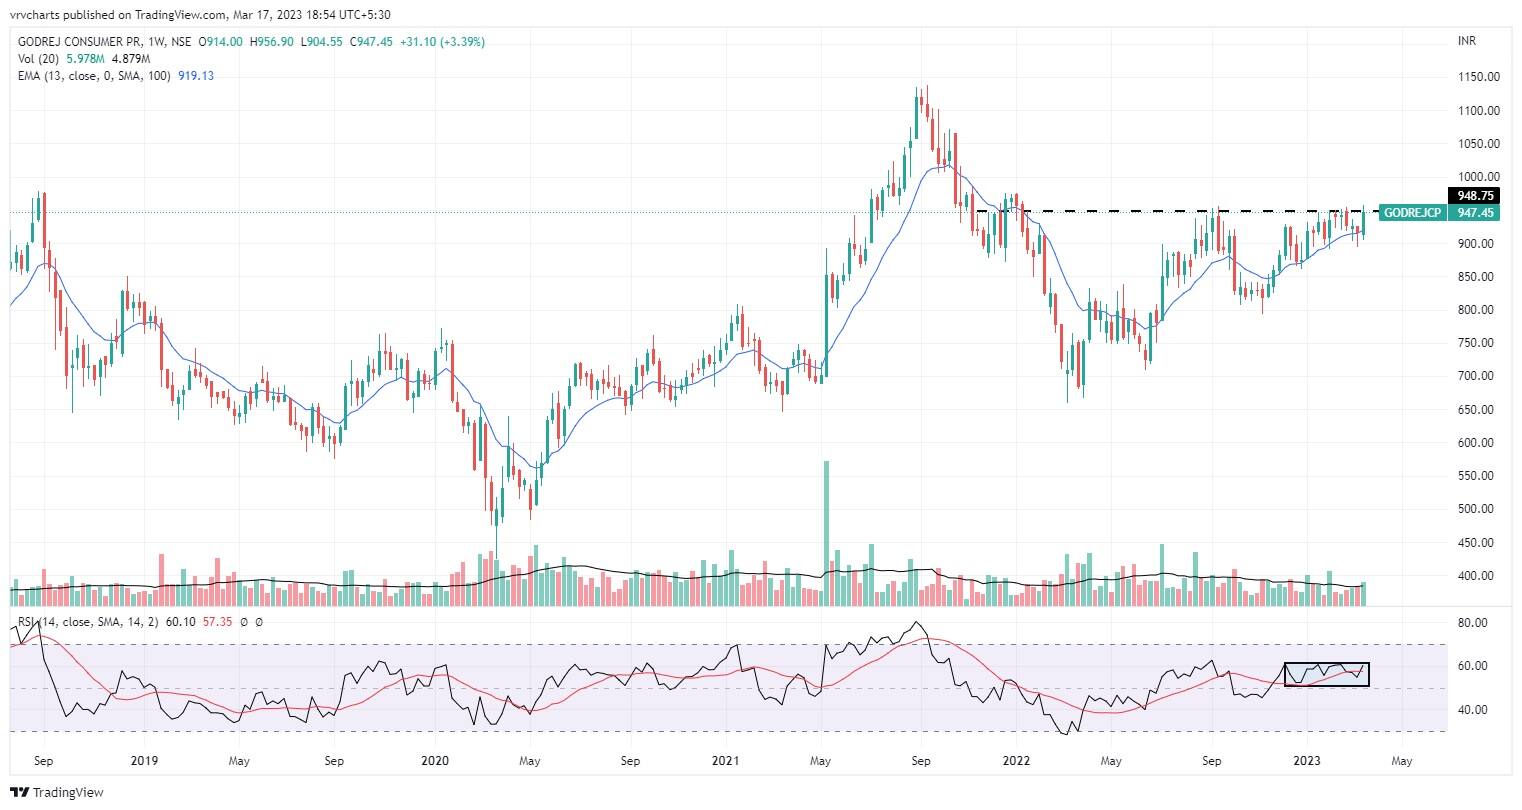
Godrej Consumer Products: Buy | LTP: Rs 947 | Stop-Loss: Rs 900 | Target: Rs 1,050 | Return: 11 percent
The stock has been consolidating with positive bias since January 2022 and appears to have formed a Cup and Handle which usually represents accumulation.
This week, the stock experienced above average volumes as it attempted to breakout of the 9-week consolidation zone with the RSI also depicting a positive crossover.
The stock continues to trade above the 13-week EMA in turbulent market conditions which depicts buyer strength.
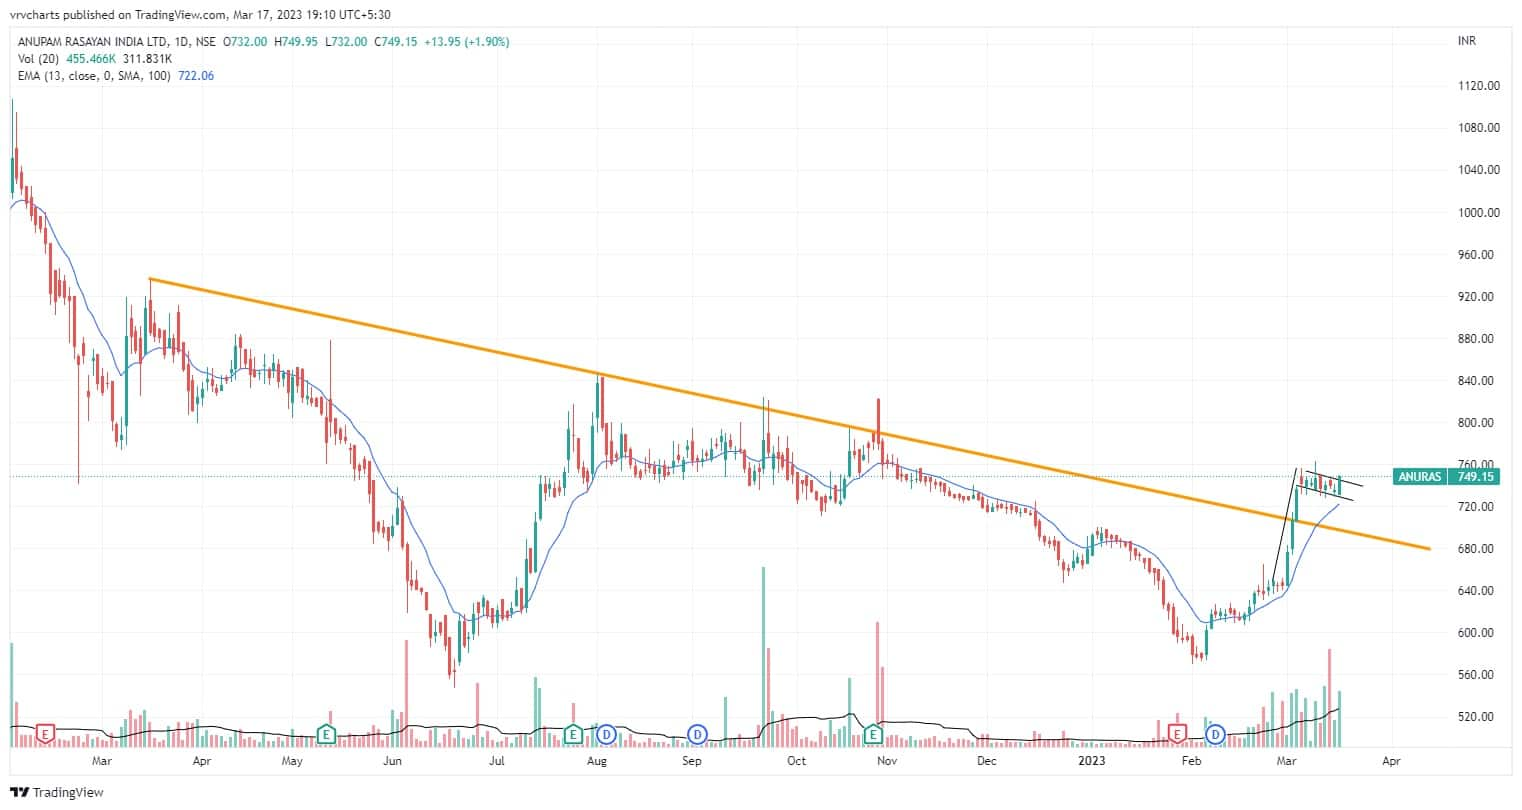
Anupam Rasayan India: Buy | LTP: Rs 749 | Stop-Loss: Rs 710 | Target: Rs 825 | Return: 10 percent
The stock has been experiencing a prolonged downtrend since its listing on two bourses. However, recent price action has been significant, with the stock breaking above a downward sloping trendline and experiencing a price surge accompanied by high trading volumes.
The stock has formed a Bullish Flag and Pole pattern which can trigger a sharp continuation of the ongoing recovery rally in the stock.
Expert: Mitesh Karwa, Research Analyst at Bonanza Portfolio
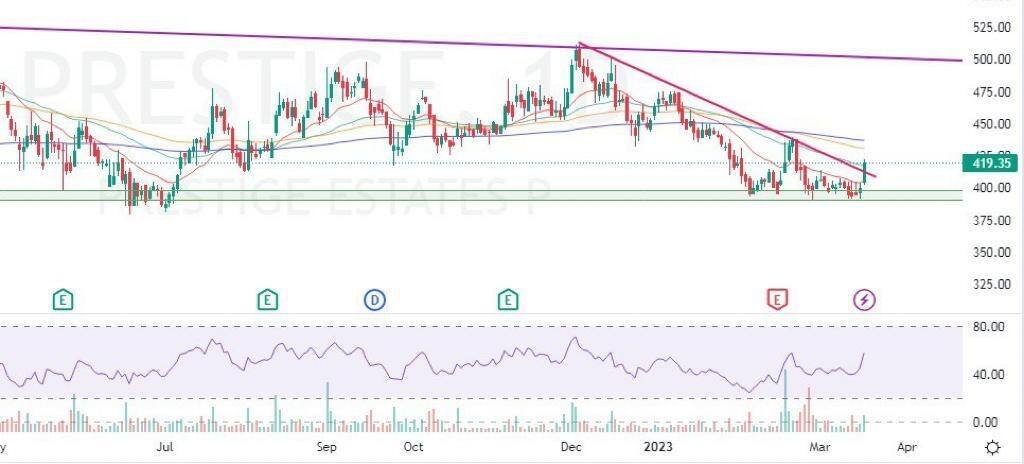
Prestige Estates Projects: Buy | LTP: Rs 419 | Stop-Loss: Rs 398 | Target: Rs 450 | Return: 7 percent
The stock has seen breaking out of a downwards sloping trendline after 3 months with a bullish candle on the daily timeframe, whereas on the weekly timeframe the stock has seen to be bouncing upwards from its support levels.
On the indicator front, the supertrend indicator is indicating a bullish trend which can be used as a confluence towards the bullish view. The ichimoku cloud is also suggesting a bullish move as the price is trading above the conversion and base line on the daily timeframe.
Momentum oscillator RSI (14) is at around 57 on the daily time frame indicating strength by sustaining above 50 and observation of the above factors indicates that a bullish move in Prestige is possible for targets upto Rs 450.
One can initiate a buy trade in between the range of Rs 415-419, with a stop-loss of Rs 398 on daily closing basis.
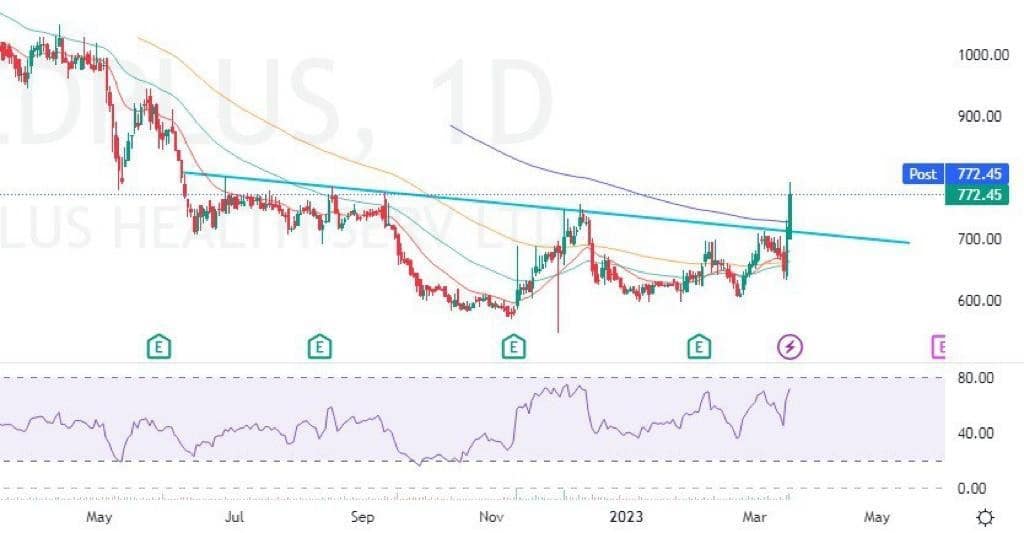
Medplus Health Services: Buy | LTP: Rs 772 | Stop-Loss: Rs 720 | Target: Rs 870 | Return: 13 percent
Medplus has seen to be breaking out of a sideways consolidation after almost 10 months with above average volumes and the stock is trading above its 20-50-100-200-day EMAs (exponential moving average) which can be used as confluence towards the bullish view.
Momentum oscillator RSI (14) is at around 71 on the daily time frame indicating strength by sustaining above 50 and the ichimoku cloud is also suggesting a bullish move as the price is trading above the cloud.
Observation of the above factors indicates that a bullish move in Medplus is possible for targets upto Rs 870. One can initiate a buy trade in between the range of Rs 768-772 with a stop-loss of Rs 720 on daily closing basis.
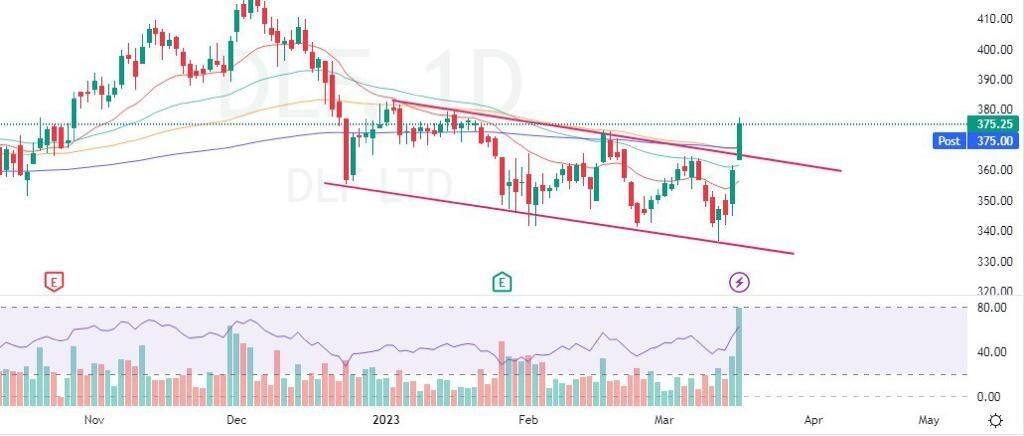
DLF: Buy | LTP: Rs 375 | Stop-Loss: Rs 345 | Target: Rs 413 | Return: 10 percent
The stock has seen to be breaking out of a downwards sloping parallel channel pattern with a bullish candle on the daily timeframe with above average volumes after 3 months and the supertrend lindicator is also indicating a bullish reversal which supports the bullish view.
Momentum oscillator RSI (14) is at around 62 on the daily time frame indicating strength by sustaining higher levels and at the same time the ichimoku cloud is also suggesting a bullish move as the price is trading above conversion and base line on the daily timeframe.
Observation of the above factors indicates that a bullish move in DLF is possible for targets upto Rs 413. One can initiate a buy trade in between the range of Rs 370-375 with a stop-loss of Rs 345 on daily closing basis.
Disclaimer: The views and investment tips expressed by investment experts on Moneycontrol.com are their own and not those of the website or its management. Moneycontrol.com advises users to check with certified experts before taking any investment decisions.
Discover the latest Business News, Sensex, and Nifty updates. Obtain Personal Finance insights, tax queries, and expert opinions on Moneycontrol or download the Moneycontrol App to stay updated!
Find the best of Al News in one place, specially curated for you every weekend.
Stay on top of the latest tech trends and biggest startup news.


