


The Commodity Channel Index (CCI) is an oscillator originally developed in 1980 by Donald Lambert and featured in his book Commodities Channel Index: Tools for Trading Cyclical Trends. The commodity channel index is an oscillator used to identify cyclical trends in indices, ETFs, stocks and commodities.
CCI measures the difference between a security's current price change and its average price change. The indicator interpretation is similar to other oscillator indicators like the Relative Strength Index (RSI). Being an oscillator indicator, CCI is used as alead indicator for price movement.
This indicator measures the current price level relative to an average price level over a given period of time; default period is taken as 20. CCI can be adjusted to the timeframe of the market traded on by changing the averaging period.
Why buy Reliance Industries?
There are a lot of trading strategies using CCI, below mentioned is one of the most popular among the trading community that involves buying after a bullish breakout by trading above the zero line and the trend line breakout, however, moving averages can be used for additional support.
Recently, the stock logged a key low of Rs 1,855 and managed to close higher above the previous two days' high, indicating bulls are active at lower levels and strong buying is emerging below Rs 1,850. Moreover, this stock gave a price action confirmation of reversal by closing above the previous day's high. Immediate resistance stands near Rs 2,000-2,015 and any decisive move above it will accelerate upside movement. At the same time, the CCI indicator has given a trend line breakout and managed to push above the zero line.
This CCI setup boosts buying sentiment among traders and suggests staying on the long side. Currently, RIL is trading above the crucial moving averages of 20 and 50 DMAs and is suggests hat price action will continue on the higher side.
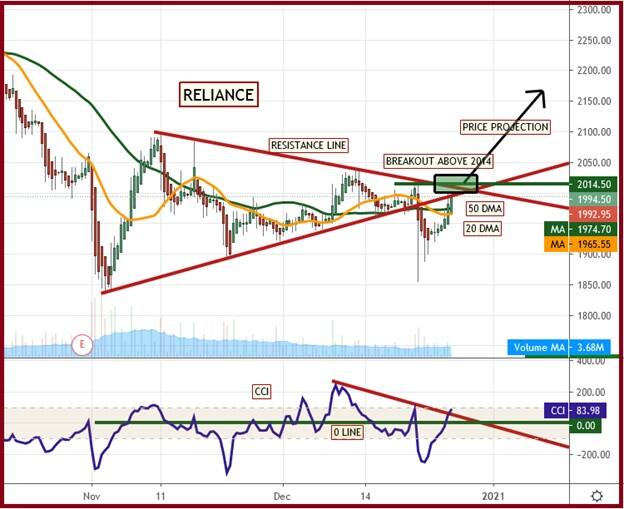
Figure .1. CCI breakout and Buy signal on Reliance
Buy signal
1. Recently CCI gave a breakout and traded above zero levels.
2. Strong bullish candle formation above the previous two days' high is giving confirmation of trend reversal in the short term.
3. The stock is trading above the short-term moving average 20-DMA, placed at around Rs 1,966.
4. A decent volume participation while forming a bullish candle has also given an additional confirmation.
Profit booking
Whenever a price candle nears the resistance line standing around Rs 2,170, the systematic method of booking profits can be used.
Stop loss
The entire bullish view negates on breaching of the last candles low and 20 DMA. In case of Reliance, it stands around Rs 1,960-mark.
Conclusion
We recommend buying Reliance Industries above Rs 2,014 levels, with a stop loss of Rs 1,960 for higher targets of Rs 2,170 and Rs 2,250 as indicated in the above chart.
(Shabbir Kayyumi is the Head-Technical Research at Narnolia Financial Advisors Ltd.)Disclosure: Reliance Industries Ltd. is the sole beneficiary of Independent Media Trust which controls Network18 Media & Investments Ltd which publishes Moneycontrol.
Disclaimer: The views and investment tips expressed by experts on Moneycontrol.com are his own and not those of the website or its management. Moneycontrol.com advises users to check with certified experts before taking any investment decisions.

Discover the latest Business News, Sensex, and Nifty updates. Obtain Personal Finance insights, tax queries, and expert opinions on Moneycontrol or download the Moneycontrol App to stay updated!
Find the best of Al News in one place, specially curated for you every weekend.
Stay on top of the latest tech trends and biggest startup news.


