


The market gathered strength for first time in last four sessions and reclaimed the 18,200 levels on the Nifty50 on May 19, backed by information technology, banks, auto, and select metal stocks.
The BSE Sensex climbed nearly 300 points to 61,730, while the Nifty50 gained 73 points to 18,203 and formed bullish hammer sort of a candlestick pattern on the daily charts, which is a bullish reversal pattern formed after a decline.
The Bank Nifty gained more than 200 points to end at 43,969 and formed a bullish pin bar kind of candlestick pattern with long lower shadow on daily scale which suggests buying is visible at lower zones.
India VIX, which measures the expected volatility for next 30-days in the Nifty50, fell by 3.84 percent to 12.30 levels, from 12.80 levels, giving some comfort for bulls, but overall has been within the range of 11.6-13.6 levels for several weeks now.
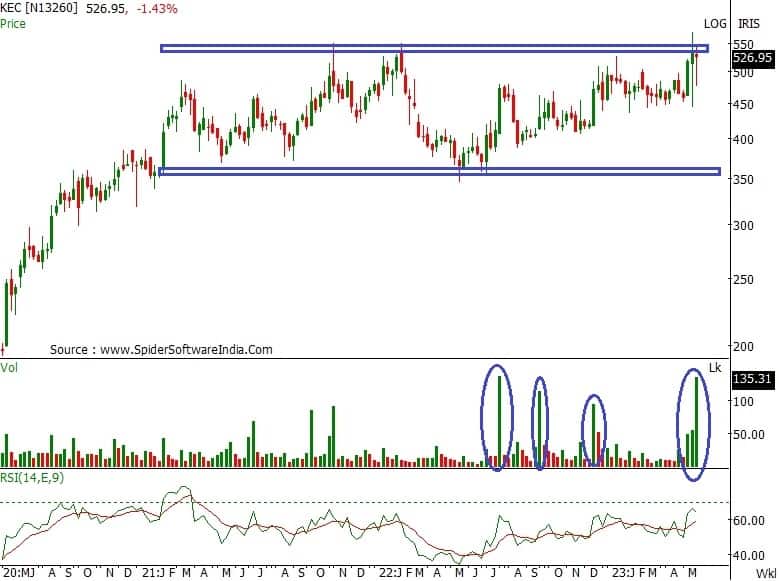
Stocks that performed better than broader markets included KEC International which surged over 12 percent to Rs 540 and recouped all the losses of previous five straight sessions. The stock has formed robust bullish candlestick pattern on the daily charts, with strong volumes.
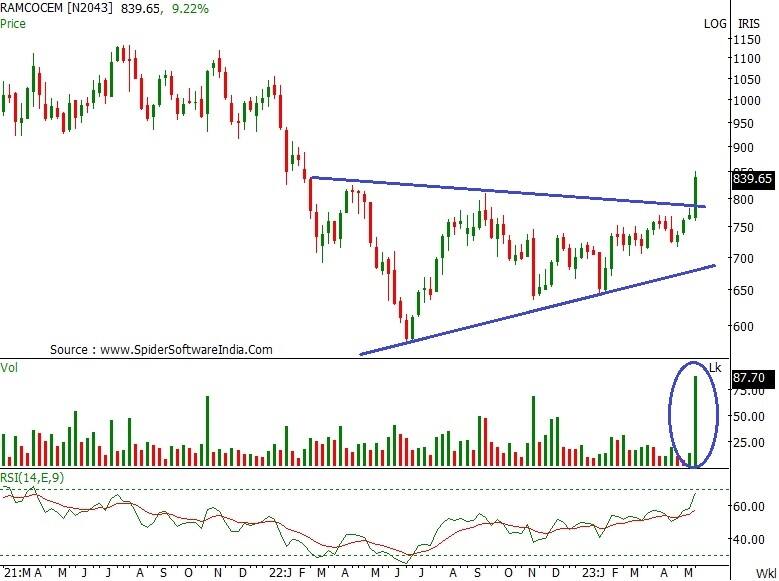
Ramco Cements shares rallied 8 percent to Rs 844, the highest closing level since February 17, 2022, and formed strong bullish candlestick pattern on the daily scale, with healthy volumes. Even on the weekly basis, it has seen healthy bullish candle formation with robust volumes, closing with 10 percent gains.
Mastek rose 6 percent to Rs 1,888, the highest closing level since September 13 last year, and formed long bullish candlestick pattern on the daily charts, with above average volumes. The stock has seen a decisive Mother candle breakout on the higher side on Friday, indicating potential continuation in the uptrend.
Here's what Rajesh Palviya of Axis Securities recommends investors should do with these stocks when the market resumes trading today:
Since past three years, the stock has been strongly consolidated within Rs 560-350 levels. This consolidation phase is backed with huge volume spikes which indicate increased participation.
With current levels, the stock is inching up towards a major "multiple resistance zone" breakout of Rs 550 levels hence any decisive close above the same may lead upside momentum towards Rs 650-700 levels.
Past couple of week's buying momentum was observed from the 200-day SMA (simple moving average - Rs 453) which remains a crucial support zone. The daily weekly and monthly RSI (relative strength index) is in bullish mode which signals rising strength. The weekly and monthly "band Bollinger" buy signals indicate increased momentum.
Investors should buy, hold and accumulate this stock with an expected upside of Rs 650-700 and the downside support zone is at Rs 480-440 levels.
With last week's price action the stock has registered 10 percent gains and also confirmed "symmetrical triangle" breakout around Rs 800 levels. This breakout is accompanied with huge volumes which indicates increased participation.
On the daily and weekly time frame, the stock is in uptrend forming a series of higher tops and bottoms. In addition, the stock is also well placed above its 20, 50, 100 and 200-day SMA which reconfirms bullish sentiments. The daily weekly and monthly RSI is in bullish mode which signals rising strength.
Investors should buy, hold and accumulate this stock with an expected upside of Rs 900-950 and with a downside support zone of Rs 820-800 levels.
Since September 2022, the stock was consolidating within Rs 1,850-1,480 levels, however with current week's price action the stock has decisively broken out this consolidation on a weekly closing basis indicating positive bias.
On the daily and weekly time frame, the stock has witnessed trend reversal. Rising volumes confirms increased participation. The stock is sustaining above its 20, 50, 100 and 200-day SMA which supports bullish sentiments. The daily and weekly "band Bollinger" buy signals indicate increased momentum.
Investors should buy, hold and accumulate this stock with an expected upside of Rs 2,000-2,200, with downside support zone of Rs 1,760-1,700 levels.

Disclaimer: The views and investment tips expressed by investment experts on Moneycontrol.com are their own and not those of the website or its management. Moneycontrol.com advises users to check with certified experts before taking any investment decisions.
Discover the latest Business News, Sensex, and Nifty updates. Obtain Personal Finance insights, tax queries, and expert opinions on Moneycontrol or download the Moneycontrol App to stay updated!
Find the best of Al News in one place, specially curated for you every weekend.
Stay on top of the latest tech trends and biggest startup news.


