


The market seems to be getting strong day-after-day, as after forming bottom around 17,550 last week, the benchmark indices continued uptrend since the beginning of this week. The Nifty50 rallied over 100 points to close above 17,900 mark on April 27, the expiry day for April derivative contracts.
The BSE Sensex gained nearly 350 points to close at 60,649, while the broader markets also followed suit with the Nifty Midcap 100 and Smallcap 100 indices rising six-tenth of a percent and 0.8 percent respectively.
The volatility cooled down further, giving more comfort for bulls and stability for the market. The India VIX, which measures the expected volatility in the Nifty50 for next thirty days, fell by 1.95 percent from 11.65 levels, to 11.43 levels, the lowest level since December 30, 2019.
Stocks that performed better than broader markets on Thursday included Vijaya Diagnostic Centre which rallied nearly 10 percent to Rs 386.6 on the NSE after taking a support around Rs 350 levels in previous session. The stock has formed bullish candlestick pattern on the daily charts with robust volumes.
BSE was also in action, climbing over 4 percent to Rs 521, continuing uptrend for fifth consecutive session. The stock has formed long bullish candle on the daily scale with strong volumes and made higher tops higher bottoms formation for fourth straight day.
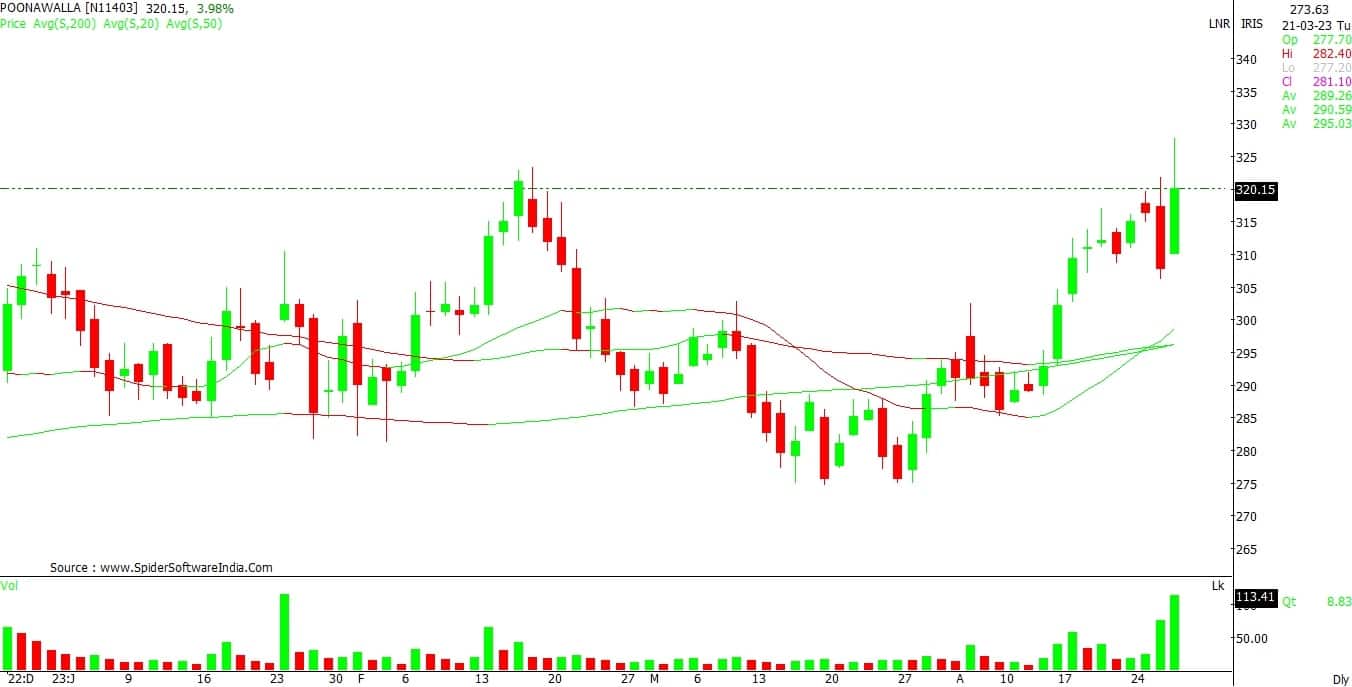
Poonawalla Fincorp rose 3.7 percent to Rs 319 and formed bullish candlestick pattern with long upper shadow on the daily timeframe, indicating a bit of profit taking at higher levels. The volume remained robust, with the stock trading above all key moving averages (21, 50, 100, and 200-day EMA - exponential moving average).
Here's what Shrikant Chouhan of Kotak Securities recommends investors should do with these stocks when the market resumes trading today:
In this week so far, the stock rallied nearly 15 percent. On daily and weekly charts, the stock has formed long bullish candle and on intraday charts it is holding higher bottom formation which is largely positive.
In addition, a promising price volume breakout continuation formation also indicating continuation of uptrend in the near future. For the breakout traders now Rs 495 and Rs 490 would be the key levels to watch.
The overall chart structure suggests if the stock sustained above the same then breakout continuation texture likely to continue till Rs 540-550 or 200-day SMA (simple moving average).

After a short term price correction eventually, the stock took the support near Rs 350 and bounced back sharply. Post reversal, on last Thursday, it rallied nearly 10 percent. A promising reversal formation on daily charts and incremental volume activity indicates further uptrend from the current levels.
We are of the view that, the short term formation is bullish but due to temporary overbought conditions we could see some profit booking at higher levels.
In the short run, 200-day SMA or Rs 410 and Rs 420 would be the key resistance zones, whereas Rs 380-375 could act as a key support area.
For traders buying on dips and sell on rallies would be the ideal strategy. However, below Rs 375, bulls may prefer to exit from the trading long positions.

After a medium term correction, the stock comfortably trading above 200, 50 and 20-day SMA which is broadly positive. A promising higher high and higher low formation on daily and weekly charts suggesting continuation of uptrend wave in the near future.
For the trend following traders, Rs 305 would be the key level to watch. The overall chart structure suggests if the stock sustained above the same then positive sentiment is likely to continue till Rs 335-345.
Discover the latest Business News, Sensex, and Nifty updates. Obtain Personal Finance insights, tax queries, and expert opinions on Moneycontrol or download the Moneycontrol App to stay updated!
Find the best of Al News in one place, specially curated for you every weekend.
Stay on top of the latest tech trends and biggest startup news.


