


Given the bulls gaining strength in late trade after consolidation since the beginning of trade on February 20, and continuation of upward journey for six days in a row with higher highs, higher lows formation in four consecutive sessions, the Nifty may try to march towards 22,300 in the coming sessions, followed by 22,500, with support at 22,000 mark, experts said.
On February 20, the Nifty 50 rallied 75 points to 22,197 and formed bullish candlestick pattern on the daily charts after neutral patterns formation in previous couple of days. The BSE Sensex gained 349 points at 73,057.
However, the broader markets saw some profit-taking as the Nifty Midcap 100 and Smallcap 100 indices were down 0.13 percent and 0.53 percent.
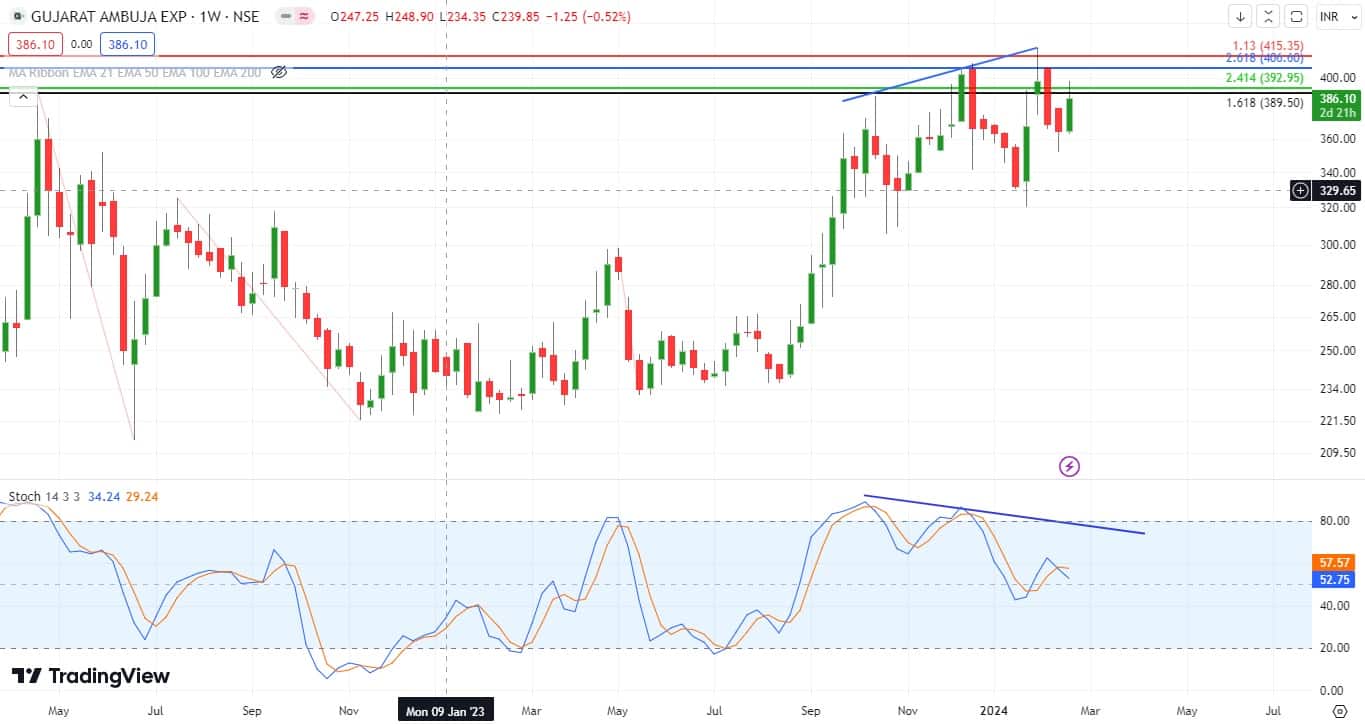
Stocks that performed far better than the broader markets on Tuesday included Gujarat Ambuja Exports, Craftsman Automation, and Glenmark Pharma. Gujarat Ambuja Exports has formed long bullish candlestick pattern on the daily charts after several day of consolidation. The stock rallied 6 percent to Rs 386 with robust volumes and traded above all key moving averages, which is a positive sign.
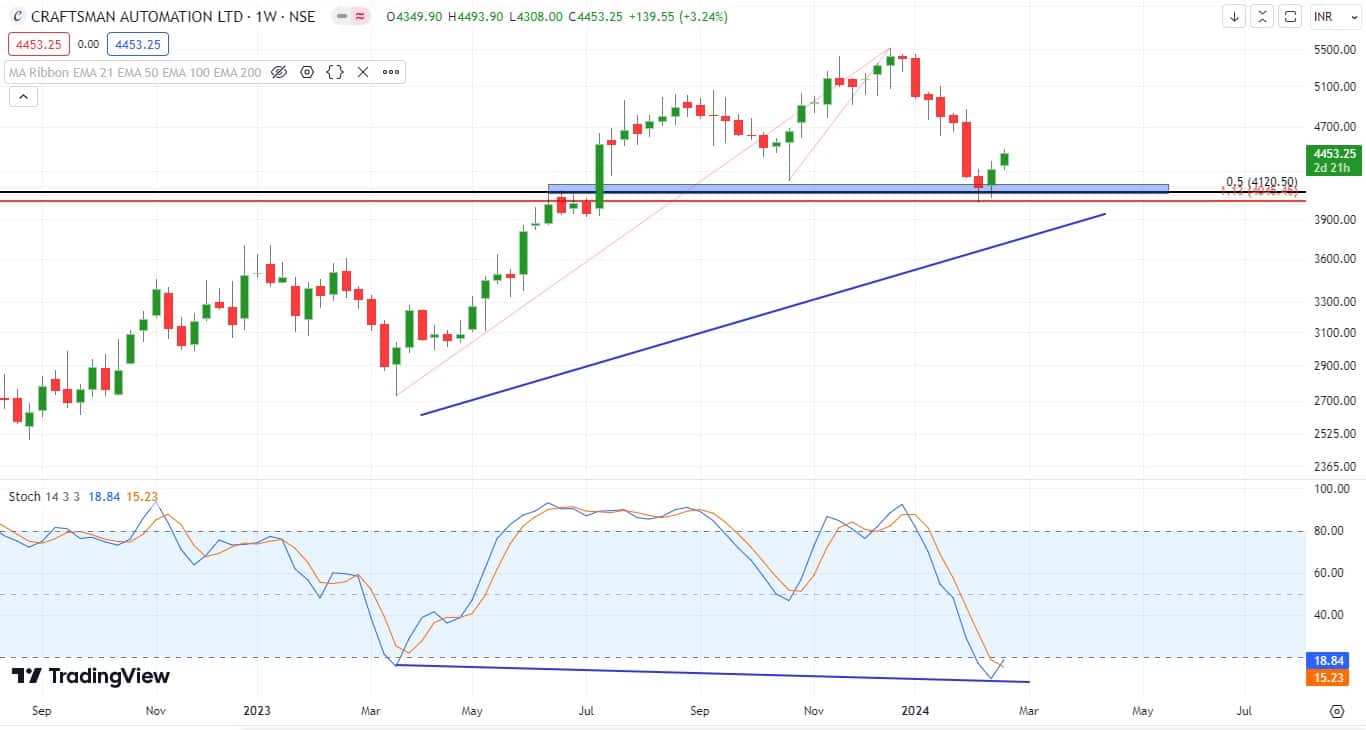
Craftsman Automation maintained upward journey for six days in a row, and gained 2.8 percent at Rs 4,453. The stock has formed bullish candlestick pattern on the daily timeframe with average volumes. The stock climbed above 21-day EMA (exponential moving average) and closed near 200-day EMA. Sustaining above 200-day EMA is key to watch out for.
Glenmark Pharma jumped 3.7 percent to Rs 894 and formed bullish candlestick pattern on the daily scale with above average volumes. The stock showed nice recovery in last four days after falling closer to 200-day EMA, and now traded above all key moving averages.
Here's what Jigar Patel of Anand Rathi recommends investors should do with these stocks when the market resumes trading today:Gujarat Ambuja ExportsThe recent surge in GAEL may appear attractive at first glance, yet a closer examination reveals potential concerns. Analyzing the weekly chart reveals the presence of several Bearish Engulfing candlestick patterns, signaling a potential reversal in trend.
Additionally, resistance levels between Rs 400-410 are notably strong, marked by Fibonacci clustering as depicted in the chart. Furthermore, the weekly stochastic indicator shows consistent bearish divergence, adding to the cautious outlook.
For investors who have already entered the market, considering profit-taking in Rs 395-410 range is advisable. Conversely, a breakthrough above Rs 415 on a weekly basis could signal an opportunity for fresh long positions in Rs 415-420 zone, targeting a potential upside of Rs 450. It's prudent to set a stop-loss near Rs 399 based on daily closing prices to manage risk effectively.
Following its peak near Rs 5,500, Craftsman experienced a significant decline of approximately 1,500 rupees, constituting a substantial 27 percent decrease. Over the past two weeks, the stock has stabilized around the support level of approximately Rs 4,000, coincidentally aligning with its previous breakout range. This support zone of Rs 4,000-4,100 is reinforced by Fibonacci clustering, as indicated in the chart, instilling further confidence in its stability.
Moreover, recent developments on the indicator front reveal a hidden bullish divergence in the weekly stochastics, suggesting the potential for continued upward momentum in the near future.
Given these factors, traders and investors may consider initiating fresh long positions within the range of Rs 4,350-4,500, anticipating an upside target of Rs 5,100. To manage risk effectively, a stop-loss should be placed near Rs 4,050 based on daily closing prices.
Note: Hidden bullish divergence is a setup where the oscillator forms progressively lower lows at the same time that the price is forming higher lows
Since the onset of February 2024, Glenmark Pharma has experienced a tumultuous journey marked by significant fluctuations. Initially, following its peak at Rs 922, the stock witnessed a sharp decline of nearly 150 points, equating to a substantial 16 percent
However, it swiftly rebounded from a low of Rs 771 with an impressive gain of approximately 134 points, constituting a notable 17 percent recovery. Despite this rebound, the stock faces formidable resistance around Rs 920 zone, characterized by a triple top formation.
Given this resistance barrier, investors who have already entered the market may consider capitalizing on gains within the range of Rs 910-920. As for initiating new long positions, caution is warranted at present, and it's advisable to refrain from entering fresh positions until a clearer trend emerges.

Discover the latest Business News, Sensex, and Nifty updates. Obtain Personal Finance insights, tax queries, and expert opinions on Moneycontrol or download the Moneycontrol App to stay updated!
Find the best of Al News in one place, specially curated for you every weekend.
Stay on top of the latest tech trends and biggest startup news.


