


A strong recovery in the Nifty50 from the 19,500 levels intraday on October 19 indicated buying interest at lower levels while the index formed a bullish candlestick pattern with upper shadow on the daily charts. This level can act as a crucial support in the coming sessions. As long as the index holds it, 19,700-19,800 can be possible on the higher side, whereas breaking of the same can drag the index down to 19,300, the low of current month, experts said.
The Nifty50 closed off the day's low, down 46 points at 19,625, while the BSE Sensex fell 248 points to 65,629. The breadth was slightly tilted in favour of declines.
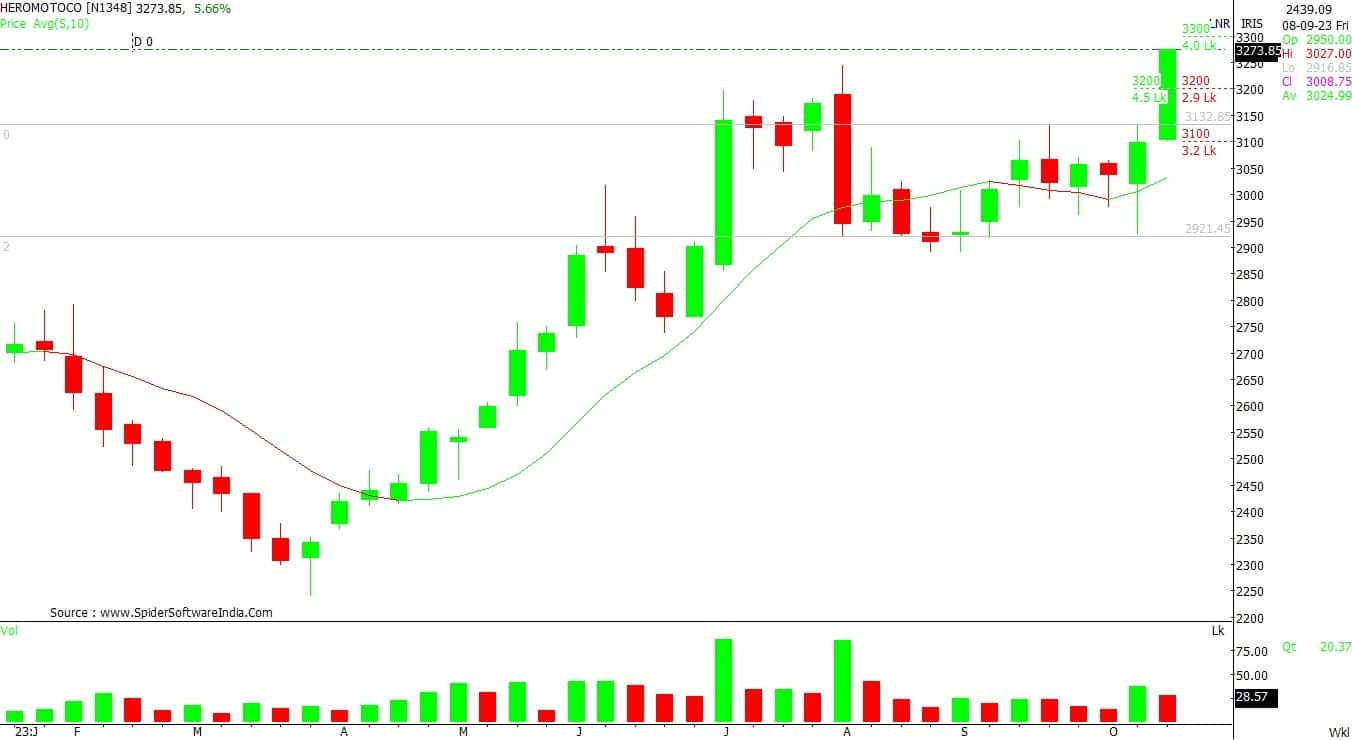
Stocks that bucked the trend in the falling market included Hero MotoCorp, NBCC (India), and Welspun India. Hero MotoCorp has seen a breakout of several weeks of consolidation and has formed robust bullish candlestick pattern on the daily charts, with healthy volumes as the stock climbed 3.6 percent to Rs 3,265.85 on the NSE. Also the stock traded well above all key moving averages (20, 50, 100, and 200-day EMA - exponential moving average), which is a positive sign.
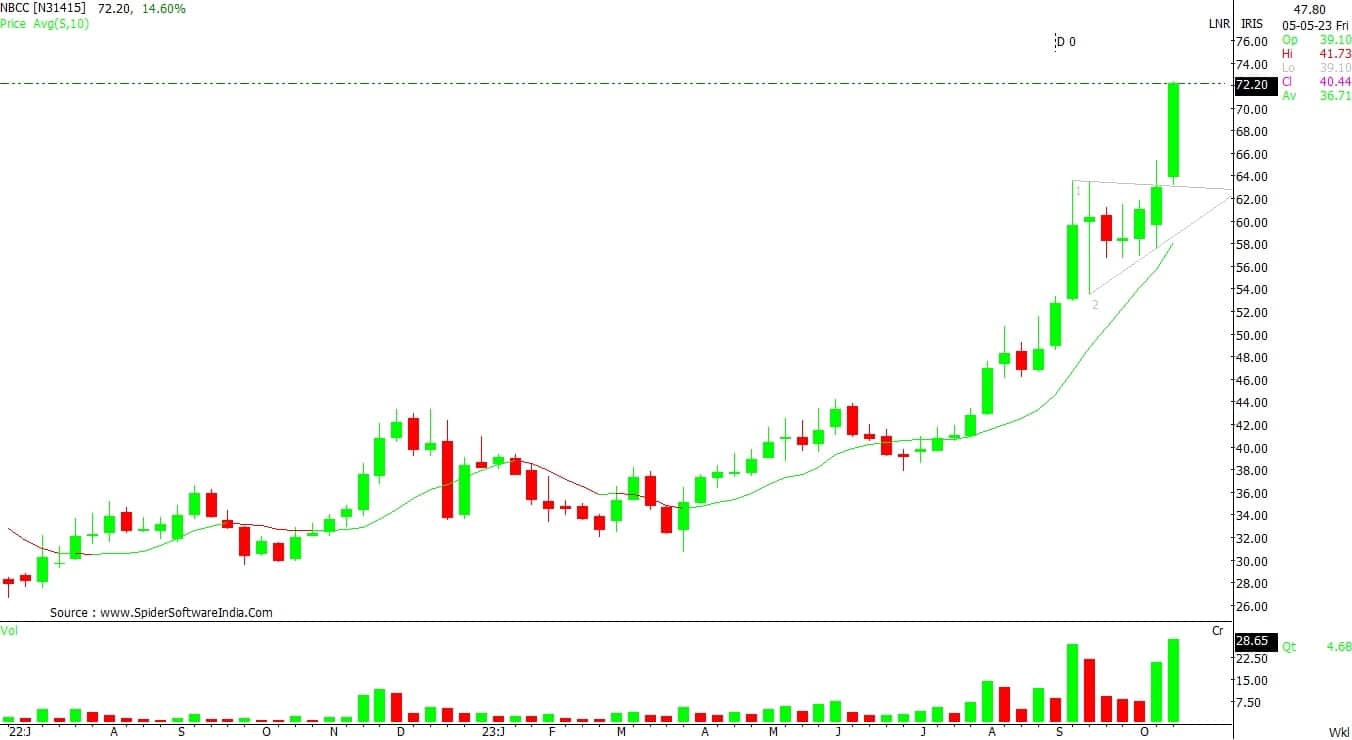
NBCC also traded above all key moving averages since the second half of July, and formed long bullish candlestick pattern with upper and lower shadows on the daily charts, with robust volumes. The stock jumped 9.5 percent to Rs 70.75, the highest closing level since September 7, 2018.
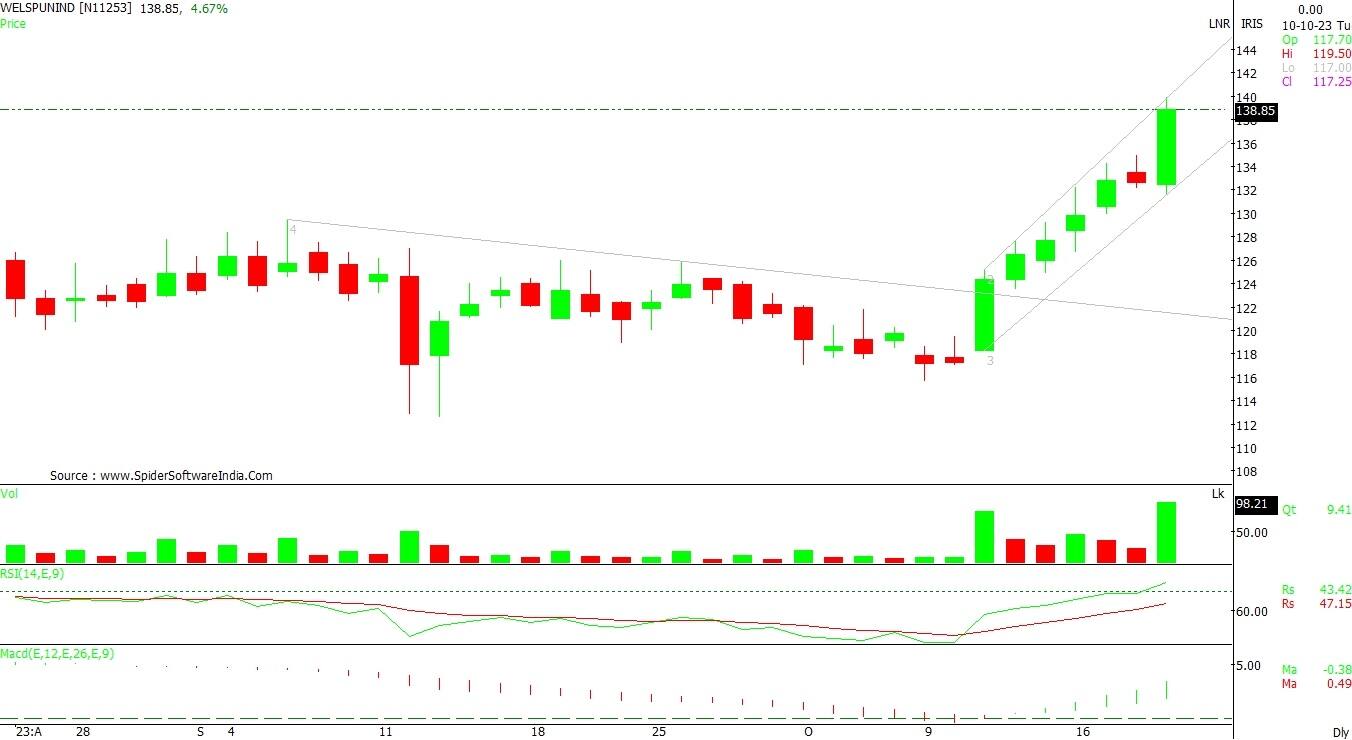
Welspun India shares gained eight out of last nine consecutive sessions and formed long bullish canldlestick pattern on the daily timeframe with healthy volumes. The stock rose 4.5 percent to Rs 138.55, the highest closing level since February 2, 2022, while on the weekly charts, it has seen a breakout of long downward sloping resistance trendline in previous week and maintained upward journey in the current week too.
Here's what Shrikant Chouhan of Kotak Securities recommends investors should do with these stocks when the market resumes trading today:
After the sharp upward rally, the stock went into the consolidation mode, which resulted in the formation of a flag chart pattern on weekly scale. The recent breakout formation in the stock is representing a bullish continuation pattern, which is signifying a new leg of up move from the current levels.
For the traders, Rs 68 would be the key support level to watch out. Above which the uptrend structure should continue until Rs 78.
The counter is into a rising channel chart formation with higher high and higher low series pattern. The technical indicators like RSI (relative strength index) and MACD (moving average convergence divergence) also indicating further up trend from current levels which could boost the bullish momentum in coming horizon.
As long as the stock is trading above Rs 131 the uptrend formation is likely to continue. Above which, the counter could move up to Rs 150. On the flip side, fresh sell off possible only after dismissal of Rs 131. Below the same, the stock could retest the level of Rs 126.
After short-term correction from the higher levels, the counter was in the accumulation zone where it was trading in a rectangle formation. However, on the weekly charts there is a range breakout in the counter along with decent volume activity, which suggest a new leg of bullish trend in the near term.
Unless it is trading below Rs 3,150, positional traders can retain an optimistic stance and look for a target of Rs 3,500.
Discover the latest Business News, Sensex, and Nifty updates. Obtain Personal Finance insights, tax queries, and expert opinions on Moneycontrol or download the Moneycontrol App to stay updated!
Find the best of Al News in one place, specially curated for you every weekend.
Stay on top of the latest tech trends and biggest startup news.


