


The market reported an intraday all-time high with the Nifty 50 surpassing the 23,000 mark for the first time but failed to sustain above it at close on May 24. The benchmark indices, the BSE Sensex and Nifty 50, closed flat with a negative bias, though they clocked 2 percent gains for the week, forming a strong bullish candlestick pattern on the weekly charts. However, market breadth remained in favour of the bears as approximately 1,374 equity shares declined against 884 shares advancing on the NSE. The 23,000 level is expected to play a key role in the Nifty's further direction, and sustaining this level can take the index towards the upper band of the Rising Channel (i.e., 23,100-23,200), followed by 23,500, with support at 22,800. Here are some trading ideas for the near term:
Vinay Rajani, CMT, Senior Technical/Derivative Analyst at HDFC Securities
UltraTech Cement | CMP: Rs 10,231

UltraTech has broken out from the downward sloping channel on the weekly charts. The price breakout is accompanied by a jump in volumes. Cement stocks have regained momentum, which is expected to continue. The stock is placed above all important moving averages, indicating a bullish trend across all time frames. Indicators and oscillators are showing strength in the current uptrend.
Strategy: Buy
Target: Rs 11,000
Stop-Loss: Rs 9,762
Central Depository Services | CMP: Rs 2,145.55
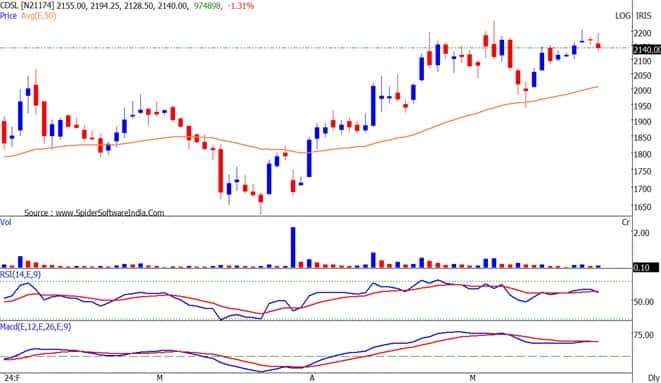
CDSL has been consolidating in a range for the last 5 weeks. The primary trend of the stock is bullish as it has been forming higher tops and higher bottoms on the weekly chart. It is placed above all important moving averages, indicating a bullish trend across all time frames.
Strategy: Buy
Target: Rs 2,320
Stop-Loss: Rs 2,000
Axis Bank | CMP: Rs 1,174
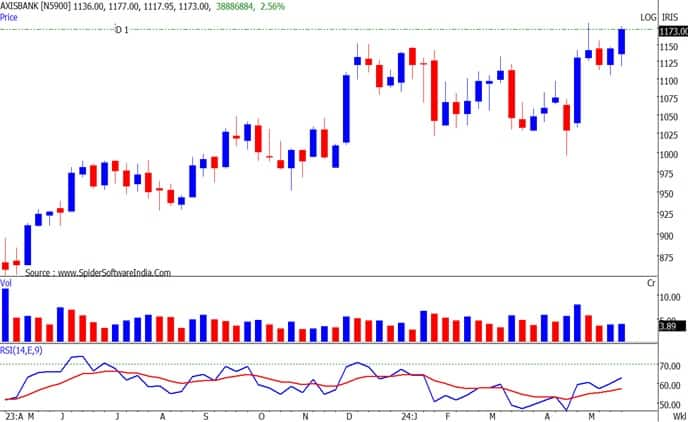
Axis Bank registered a running correction and now seems to have resumed its uptrend. The stock has taken support near its previous swing high on the daily chart. The primary trend of the stock has been bullish with higher tops and higher bottoms. It is placed above all important moving averages, indicating a bullish trend across all time frames.
Strategy: Buy
Target: Rs 1,260
Stop-Loss: Rs 1,117
Rajesh Palviya, Senior Vice President Research (Head Technical Derivatives) at Axis Securities
Ashok Leyland | CMP: Rs 210.70

Ashok Leyland is in a strong uptrend across all time frames, forming a series of higher tops and bottoms, indicating a positive bias. It has registered an all-time high at Rs 219, indicating bullish sentiments. It is well placed above its 20, 50, 100, and 200-day SMAs (simple moving averages), and these averages are also inching up along with the price rise, reaffirming the bullish trend.
The daily, weekly, and monthly strength indicators (RSI) are in positive terrain, which justifies the rising strength across all time frames. The weekly "Bollinger Band" buy signal shows increased momentum. Investors should buy, hold, and accumulate this stock with an expected upside of Rs 230-245, with a downside support zone of Rs 204-200 levels.
Strategy: Buy
Target: Rs 230, 245
Stop-Loss: Rs 204, 200
ISGEC Heavy Engineering | CMP: Rs 1,188

On the daily chart, ISGEC has confirmed a "Cup & Handle" formation breakout at Rs 1,150 levels on a closing basis. This breakout is accompanied by huge volumes, showing increased participation. The stock is well placed above its 20, 50, 100, and 200-day SMAs, and these averages are also inching up along with the price rise, reaffirming the bullish trend.
The daily, weekly, and monthly strength indicators (RSI) are in positive terrain, which justifies the rising strength across all time frames. Investors should buy, hold, and accumulate this stock with an expected upside of Rs 1,285-1,380, with a downside support zone of Rs 1,100-1,050 levels.
Strategy: Buy
Target: Rs 1,285, 1,380
Stop-Loss: Rs 1,100, 1,050
Bharat Electronics | CMP: Rs 297

Bharat Electronics is in a strong uptrend across all time frames, forming a series of higher tops and bottoms, indicating a positive bias. It has registered an all-time high at Rs 299, indicating bullish sentiments. The stock is well placed above its 20, 50, 100, and 200-day SMAs, and these averages are also inching up along with the price rise, reaffirming the bullish trend.
The daily, weekly, and monthly strength indicators (RSI) are in positive terrain, which justifies the rising strength across all time frames. The weekly "Bollinger Band" buy signal shows increased momentum. The huge rising volumes over the past three weeks signify increased participation in the rally. Investors should buy, hold, and accumulate this stock with an expected upside of Rs 313-345, with a downside support zone of Rs 280-265 levels.
Strategy: Buy
Target: Rs 313, 345
Stop-Loss: Rs 280, 265
Rajesh Bhosale, Technical Analyst at Angel One
Metropolis Healthcare | CMP: Rs 1,970.75
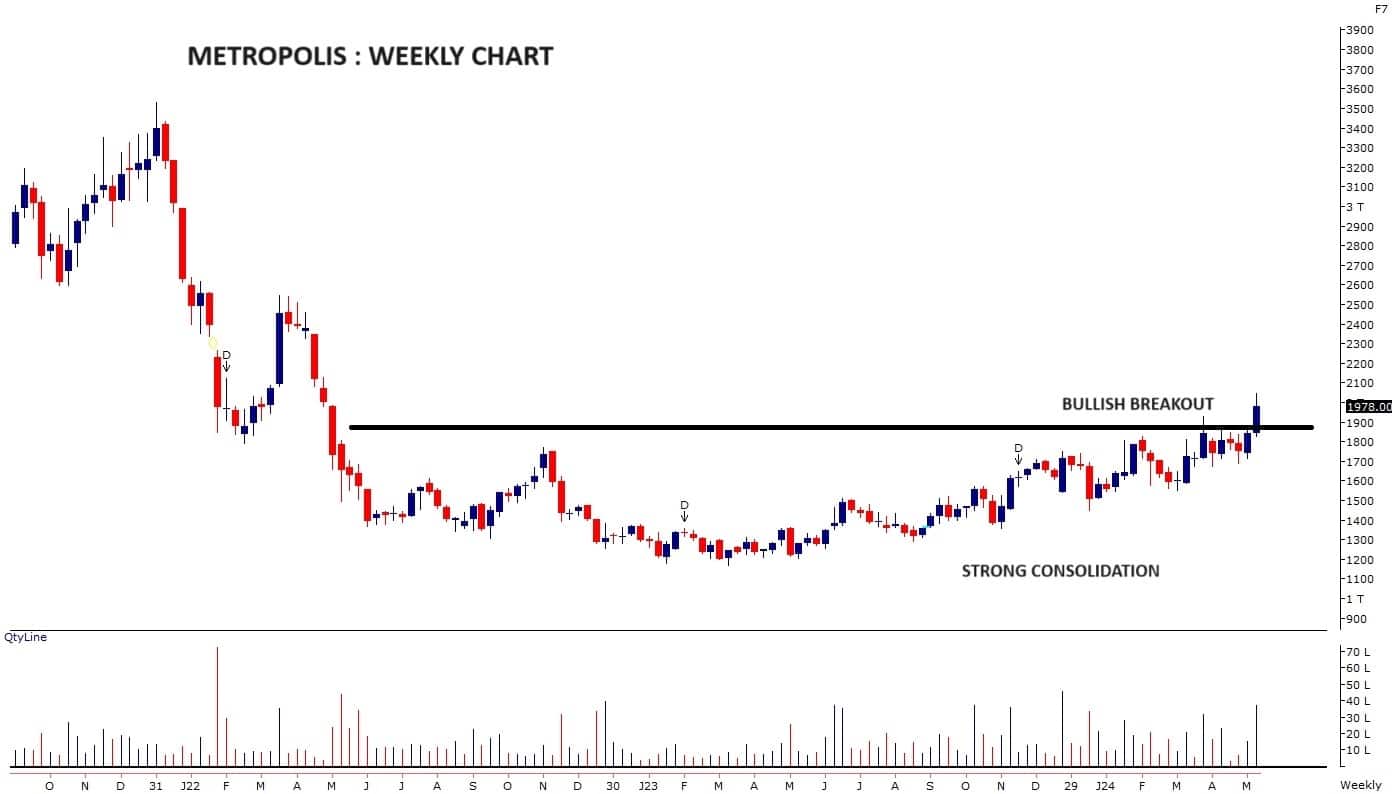
For the past two years, Metropolis prices have been consolidating within a range of Rs 1,200 to 1,900, forming a base. In the week ending May 24, prices finally broke out above this range, confirming a bullish "Rounding Bottom" reversal pattern. This upward movement has been supported by strong volumes, and on the daily chart, prices are comfortably trading in a "higher top higher bottom" formation, indicating that every dip is being bought.
Additionally, prices are well above key averages, and oscillators are positively aligned, supporting a buy recommendation. Considering all the above factors, we have a strong bullish view on this counter. Hence, we recommend buying Metropolis around Rs 1,970 - 1,960, with a stop-loss at Rs 1,820 and a target of Rs 2,220 - 2,250.
Strategy: Buy
Target: Rs 2,220, 2,250
Stop-Loss: Rs 1,820
Rashtriya Chemicals and Fertilisers | CMP: Rs 157
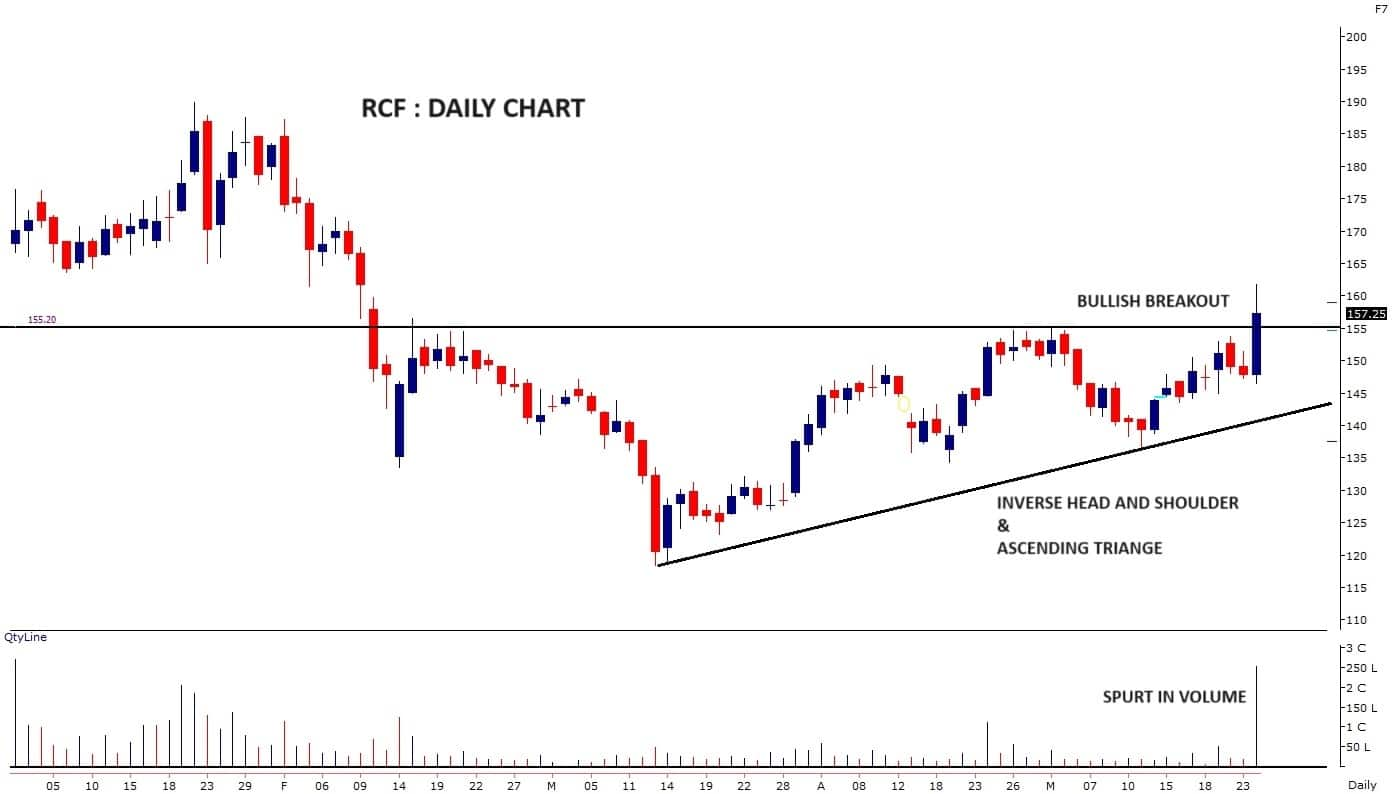
Rashtriya Chemicals has achieved a significant bullish breakout by closing above the key resistance level of Rs 155, which has held for the past three months. By surpassing this hurdle, the prices have confirmed both an 'Inverse Head and Shoulders' and an 'Ascending Triangle' breakout on the daily chart. This breakout is supported by a surge in volumes and a large bullish candle.
Prices have established a strong base on the 200 SMA and have now moved above the Super Trend indicator, indicating strong momentum in the near term. Given the buzz in this space, we expect this stock to take the lead. Hence, we recommend buying RCF around Rs 156 - 153, with a stop-loss at Rs 145 and a target of Rs 173.
Strategy: Buy
Target: Rs 173
Stop-Loss: Rs 145
IRB Infrastructure Developers | CMP: Rs 72.55
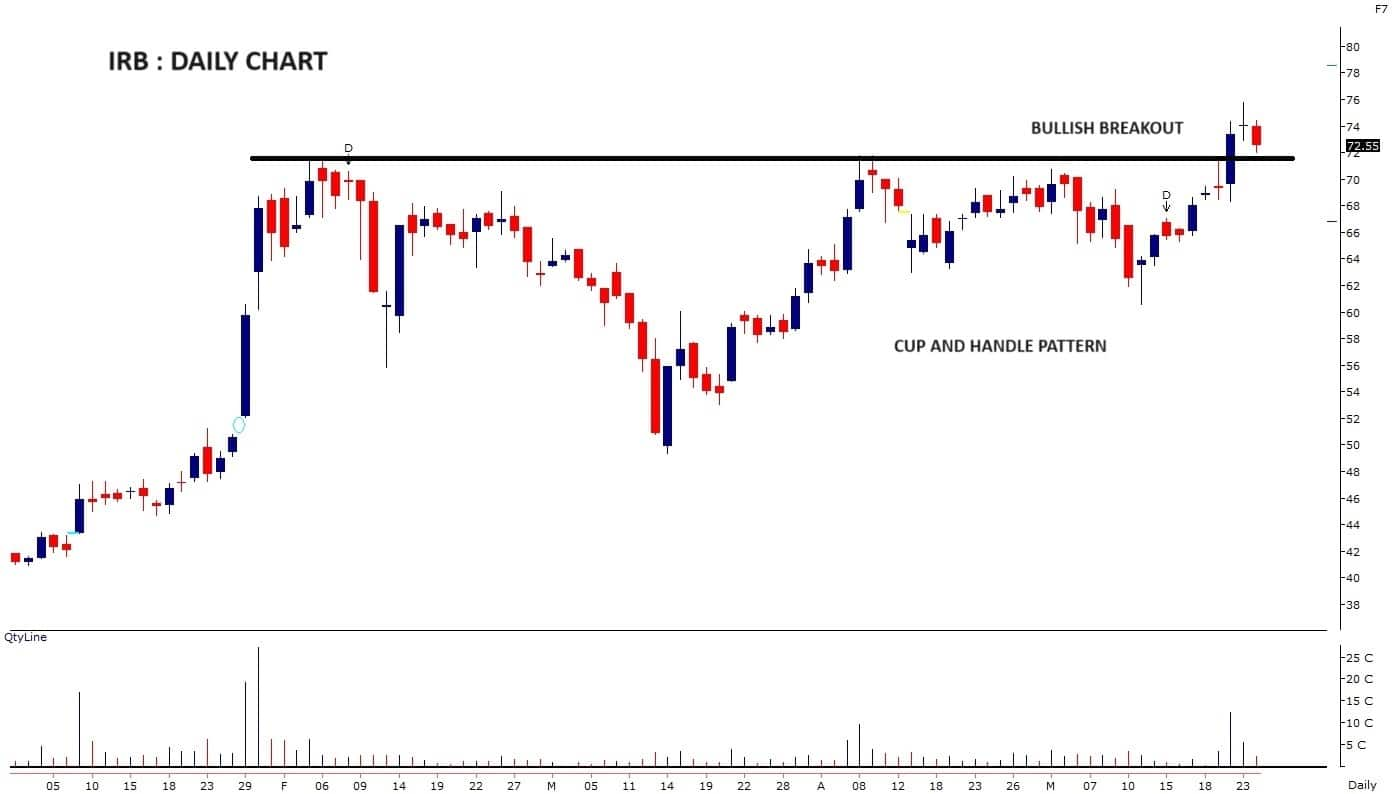
After reaching new highs around Rs 72 in February, IRB Infrastructure prices entered a correction phase where any rally towards Rs 72 was met with selling pressure. Now, after three months, this range has been broken with prices closing above this hurdle, confirming a continuation 'Cup and Handle' pattern breakout. The prices are now in uncharted territory, indicating strong bullish sentiment.
Additionally, the volume activity has increased, and momentum, after a recent cooldown, is once again pointing upward, supporting the bullish outlook. Known for its momentum moves, we expect strong trending activity in this stock in the near term based on these formations. Hence, we recommend buying IRB around Rs 72 - 70, with a stop-loss at Rs 65.8 and a target of Rs 80.
Strategy: Buy
Target: Rs 80
Stop-Loss: Rs 65.8
Jigar S Patel, Senior Manager - Equity Research at Anand Rathi
Sumitomo Chemical India | CMP: Rs 440

Sumitomo Chemical India has recently faced a significant decline in its stock price and is currently trading around Rs 418, which is close to its 200-day exponential moving average (DEMA). This proximity to the DEMA suggests that the stock might find support at this level, as the 200-day DEMA is commonly regarded as a crucial indicator of long-term trends and support. Additionally, technical analysis reveals that the daily Moving Average Convergence Divergence (MACD) indicator has formed a bullish crossover. This occurs when the MACD line crosses above the signal line, indicating a potential shift from a downward trend to an upward trend.
Moreover, a bullish Bat pattern has appeared on the weekly chart. This harmonic pattern typically signifies a reversal in the market, suggesting that the recent downtrend may be nearing its end and an upward movement might be forthcoming. These combined indicators—the support level near the 200-day DEMA, the bullish MACD crossover, and the bullish Bat pattern—suggest a potentially favourable buying opportunity for investors.
Based on these positive technical signals, we recommend that traders and investors consider entering long positions in Sumitomo Chemical within the price range of Rs 430-Rs 440. The target for this trade is Rs 495, which represents a substantial potential gain from the current levels. To manage risks effectively, we advise setting a stop-loss at Rs 405 on a daily closing basis.
Strategy: Buy
Target: Rs 495
Stop-Loss: Rs 405
Disclaimer: The views and investment tips expressed by investment experts on Moneycontrol.com are their own and not those of the website or its management. Moneycontrol.com advises users to check with certified experts before taking any investment decisions.
Discover the latest Business News, Sensex, and Nifty updates. Obtain Personal Finance insights, tax queries, and expert opinions on Moneycontrol or download the Moneycontrol App to stay updated!
Find the best of Al News in one place, specially curated for you every weekend.
Stay on top of the latest tech trends and biggest startup news.


