


The Nifty 50 failed to sustain the psychological 25,000 mark, falling over a percent to 24,718 on August 2. The index experienced a lower high-lower low pattern, forming a bearish candlestick on the daily charts. If selling pressure continues in the upcoming sessions, the index may find support at the 24,600-24,500 levels. On the NSE, 1,497 shares declined, while 851 shares advanced. Here are some trading ideas for the near term:
Rajesh Palviya, Senior Vice President Research (Head Technical Derivatives) at Axis Securities
Firstsource Solutions | CMP: Rs 297
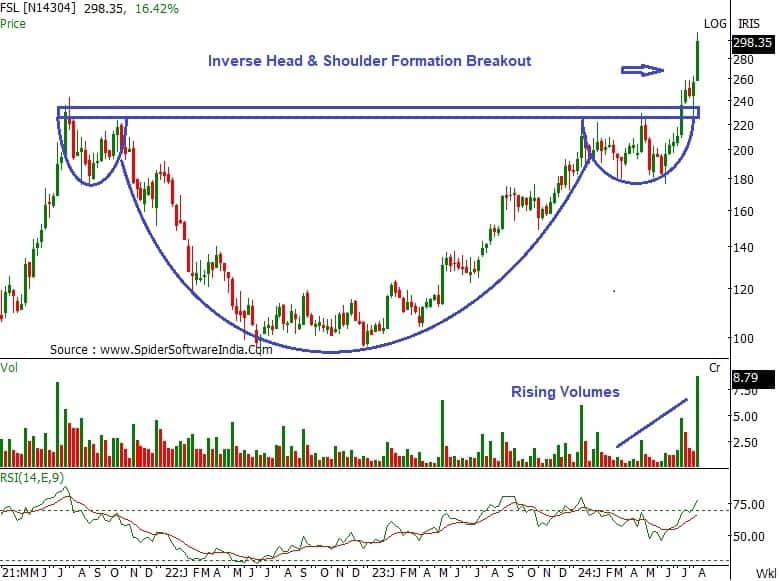
Firstsource is in a strong uptrend across all time frames, forming a series of higher tops and bottoms, indicating a positive bias. It has also confirmed an "Inverse Head & Shoulder" formation breakout on the weekly chart at Rs 236 levels, indicating further bullish momentum. This breakout is accompanied by substantial volumes, indicating increased participation.
The stock is positioned well above its 20, 50, 100, and 200-day SMAs (Simple Moving Averages), and these averages are also rising, which reaffirms the bullish trend. The daily, weekly, and monthly RSI (Relative Strength Index) are in positive terrain, justifying rising strength across all time frames. Investors should buy, hold, and accumulate this stock with an expected upside of Rs 330-355, and with downside support in the Rs 273-255 range.
Strategy: Buy
Target: Rs 330, Rs 355
Stop-Loss: Rs 273
Gujarat Heavy Chemicals | CMP: Rs 628.5
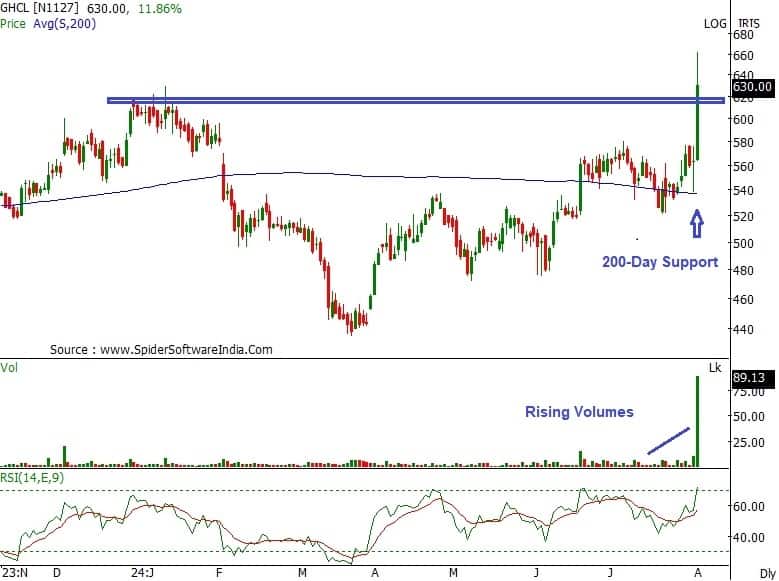
GHCL has confirmed a weekly "downsloping trendline" breakout at Rs 580 on a closing basis, indicating a trend reversal. It has also surpassed a "multiple resistance zone" at Rs 611, accompanied by large volumes, suggesting a strong comeback of bullish sentiment. The stock has recaptured its 200-day SMA (Rs 537) and rebounded sharply, reconfirming bullish sentiments. The daily, weekly, and monthly RSI are in positive terrain, justifying rising strength across all time frames. Investors should buy, hold, and accumulate this stock with an expected upside of Rs 685-730, with downside support in the Rs 580-535 range.
Strategy: Buy
Target: Rs 685, Rs 730
Stop-Loss: Rs 580
Khadim India | CMP: Rs 432.75
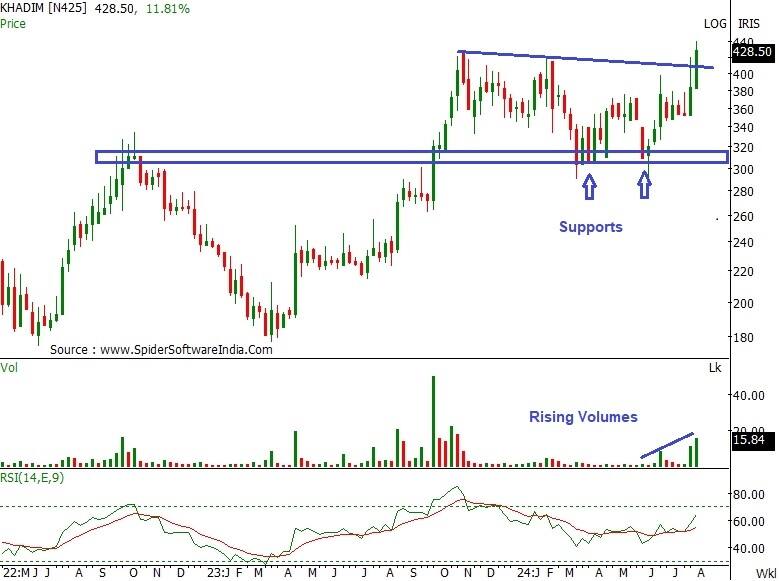
On the weekly chart, Khadim has decisively broken out of an 8-10 month consolidation range at Rs 400 on a closing basis, indicating a positive bias. The large volumes on this breakout signify increased participation. The stock is well-placed above its 20, 50, 100, and 200-day SMAs, and these averages are also rising along with the price, reaffirming the bullish trend. The daily, weekly, and monthly RSI are in positive terrain, justifying rising strength across all time frames. Investors should buy, hold, and accumulate this stock with an expected upside of Rs 475-513, with downside support in the Rs 405-380 range.
Strategy: Buy
Target: Rs 475, Rs 513
Stop-Loss: Rs 405
Osho Krishan, Senior Analyst - Technical & Derivative Research at Angel One
Indian Energy Exchange | CMP: Rs 195.3
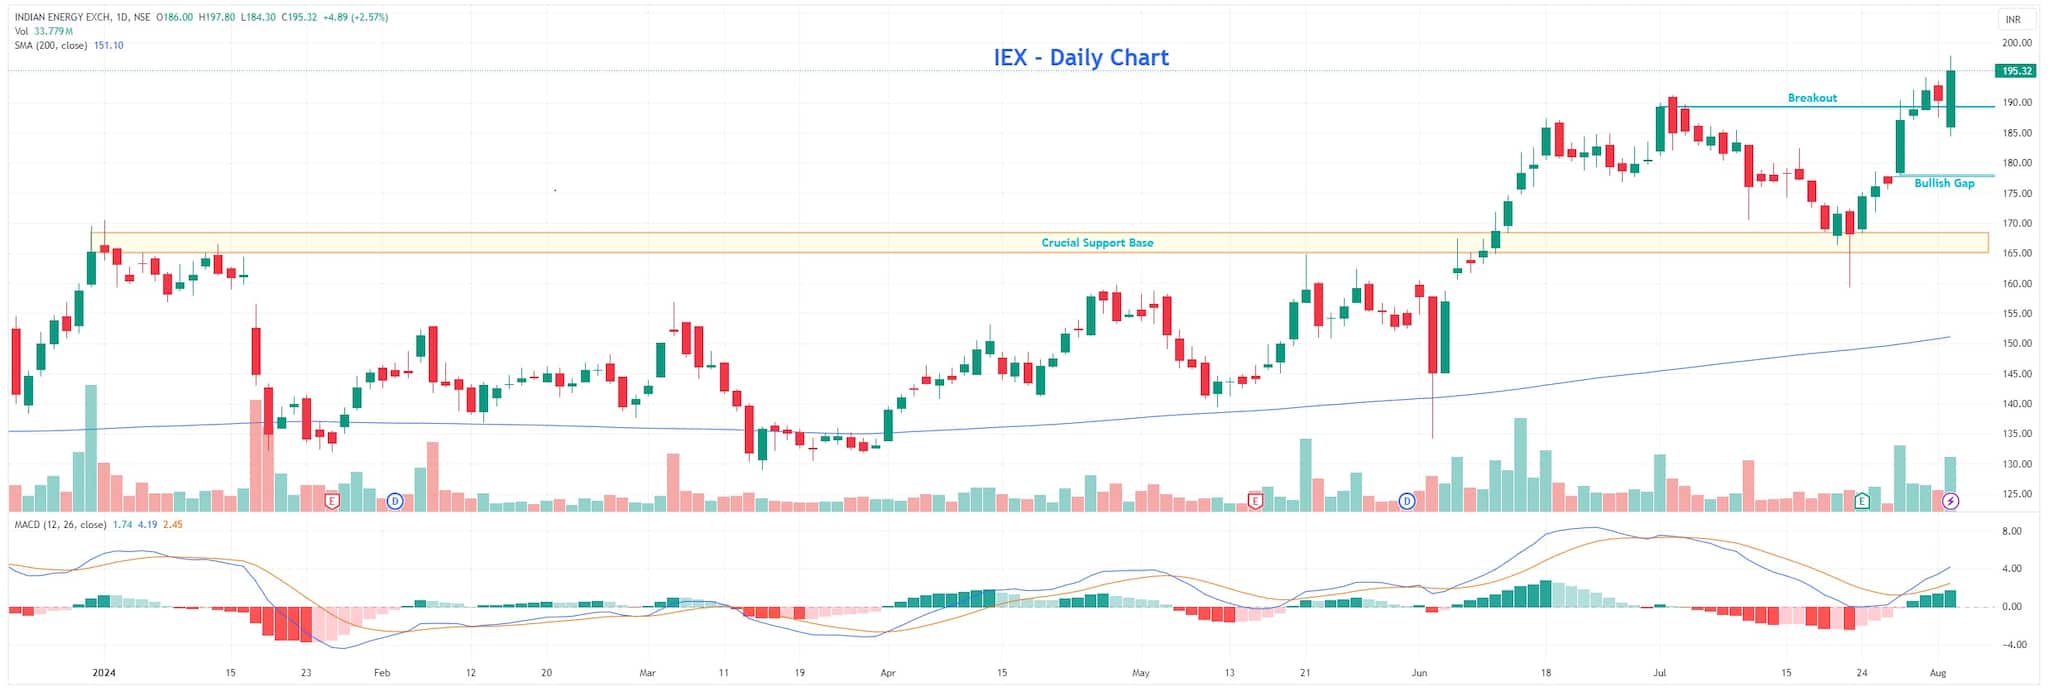
IEX witnessed a substantial increase in price over the last couple of trading sessions, rebounding from the 21 DEMA (Daily Exponential Moving Average) on the daily chart. Additionally, the counter witnessed a runaway gap, followed by a V-shaped recovery on the daily timeframe, indicating a positive development. From a technical standpoint, the counter has gained significant traction in terms of volumes recently, which is likely to support a positive short to medium-term outlook. On the oscillator front, the MACD (Moving Average Convergence Divergence) signals a continuation move, suggesting potential upside in the near term. Therefore, buying IEX around Rs 192-190 is recommended.
Strategy: Buy
Target: Rs 215, Rs 220
Stop-Loss: Rs 178
Mahindra & Mahindra Financial Services | CMP: Rs 305.5
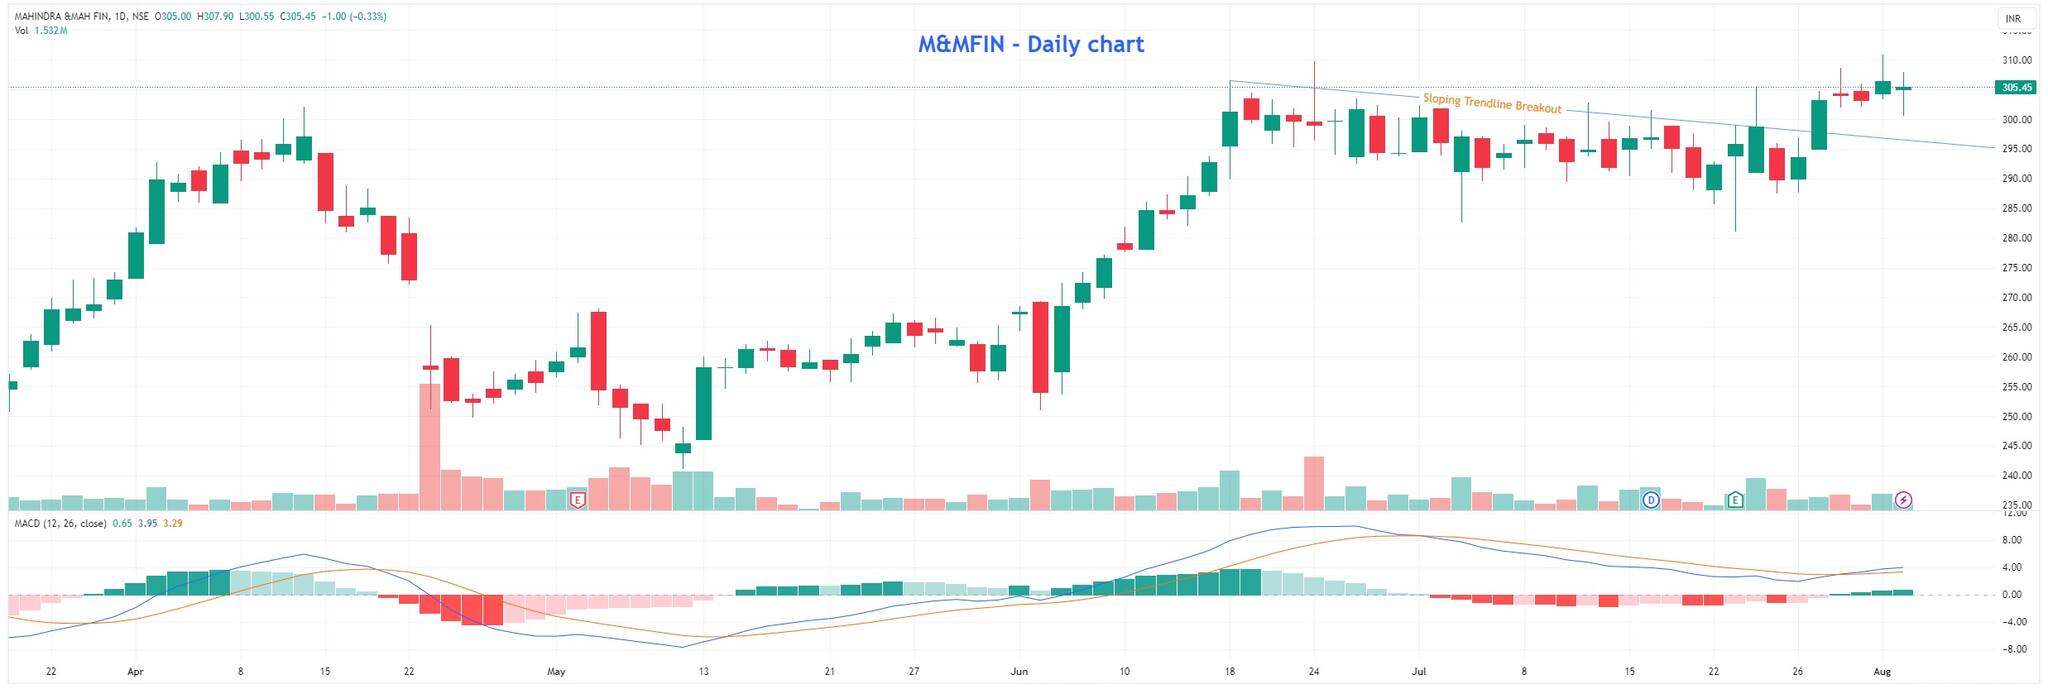
M&M Financial Services witnessed a decisive multi-week breakout on a closing basis, rising 4 percent last week. The counter has shown strong traction in recent trading weeks and seems poised to continue its upward movement in the near term. Additionally, the stock experienced a sloping trendline breakout, adding a bullish undertone. On the oscillator front, the 14-period RSI showed a positive crossover, and the MACD signals a continuation move, suggesting further potential upside. Therefore, buying the stock around Rs 302-300 is recommended.
Strategy: Buy
Target: Rs 345
Stop-Loss: Rs 282
Chemplast Sanmar | CMP: Rs 550
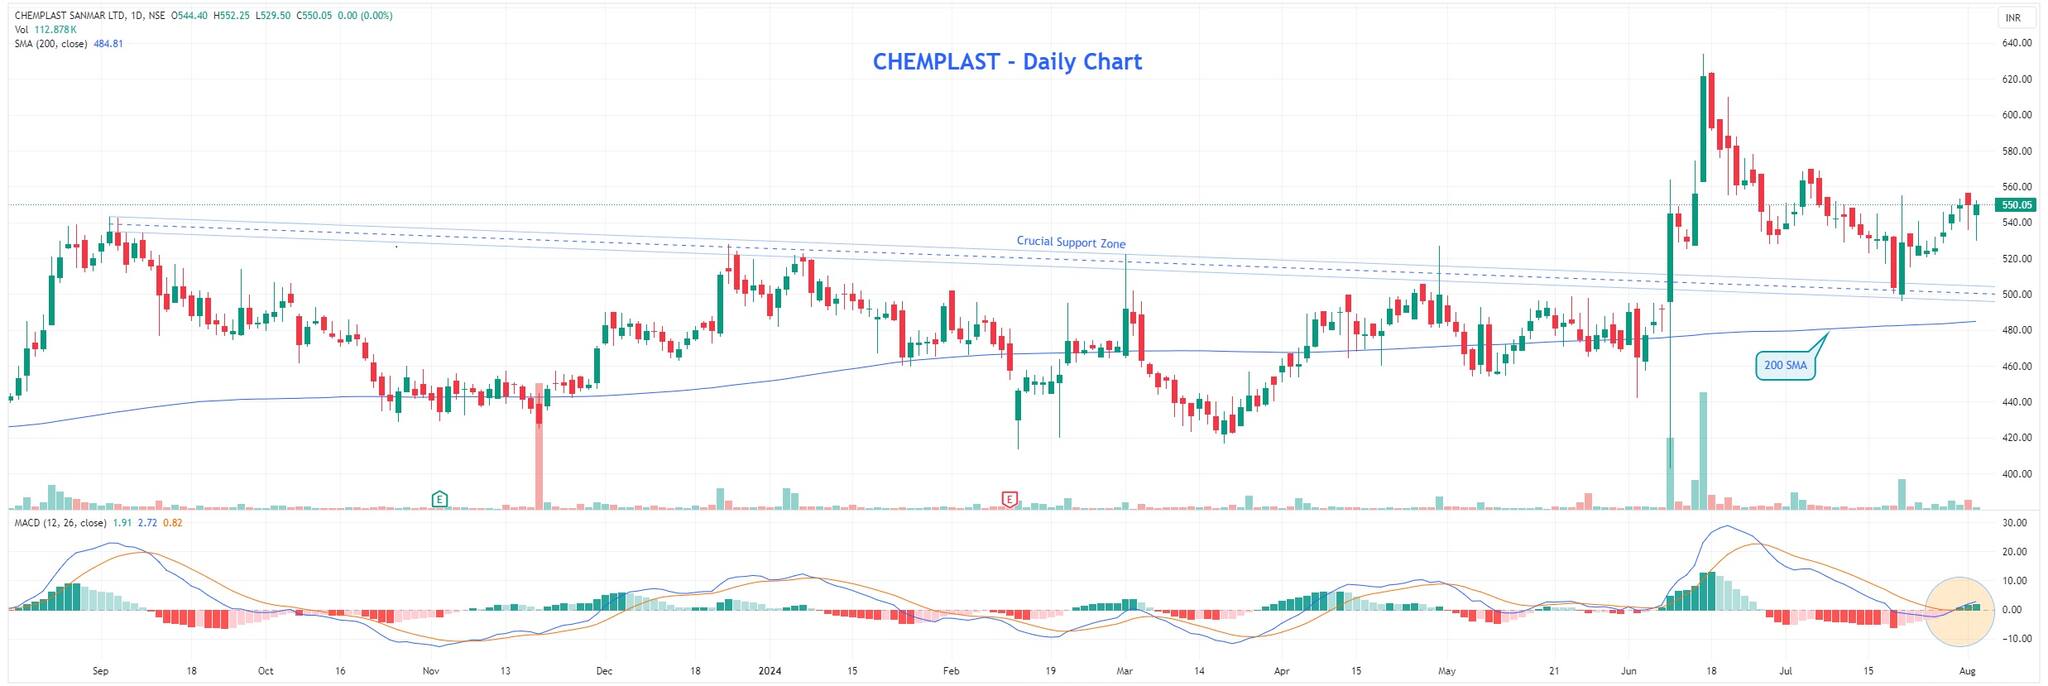
Chemplast Sanmar saw a substantial increase in price over the last few trading sessions and is comfortably hovering above its cluster of major EMAs (Exponential Moving Averages). Additionally, the counter has rebounded from the crucial support of the sloping trendline and has maintained positive momentum. On the oscillator front, most indicators are strongly aligned with the uptrend, suggesting a gradual but potential upside in the near term. Therefore, buying Chemplast Sanmar around Rs 540 is recommended.
Strategy: Buy
Target: Rs 620
Stop-Loss: Rs 495
Nagaraj Shetti, Senior Technical Research Analyst at HDFC Securities
Rossari Biotech | CMP: Rs 908.55
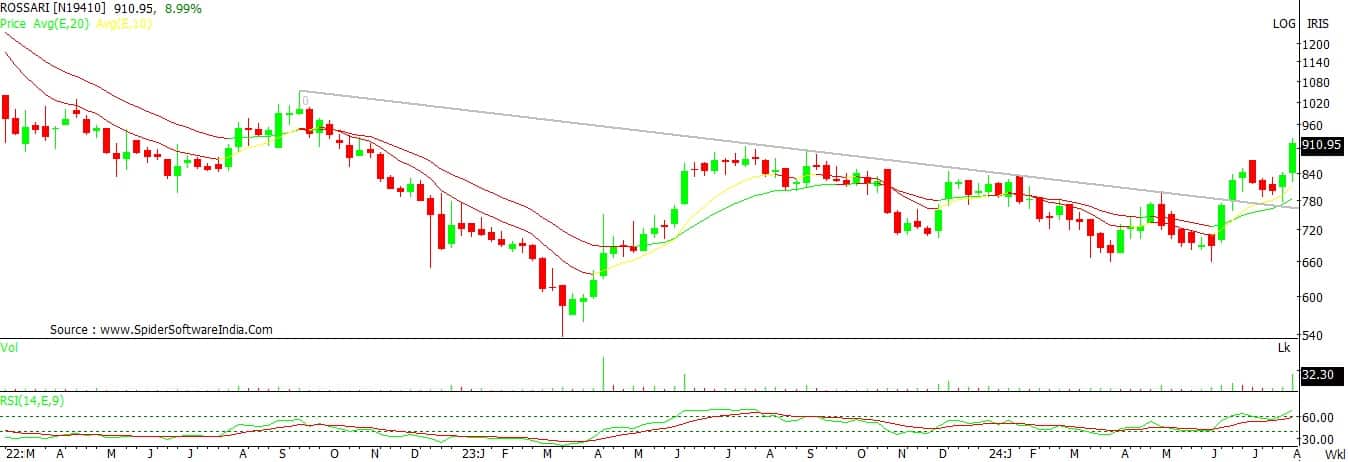
Rossari Biotech has recently experienced a sharp upside breakout following a downward correction. Currently, it has confirmed a decisive upside breakout of the downsloping trendline and closed higher on the weekly timeframe chart. The bullish chart pattern of higher tops and bottoms remains intact on the weekly chart. Volume has started to expand during the upside breakout, and the weekly 14-period RSI shows a positive indication.
Strategy: Buy
Target: Rs 1,015
Stop-Loss: Rs 865
Jubilant Ingrevia | CMP: Rs 640

Jubilant Ingrevia has been in a sustainable uptrend over the last few months. The bullish chart pattern of higher tops and bottoms is visible on the weekly timeframe chart. Currently, it is positioned near the hurdle of Rs 650-660. A sustainable move above this hurdle could trigger sharp upside momentum. Volume and RSI are showing a positive outlook for the stock price.
Strategy: Buy
Target: Rs 710
Stop-Loss: Rs 605
Advanced Enzyme Technologies | CMP: Rs 433
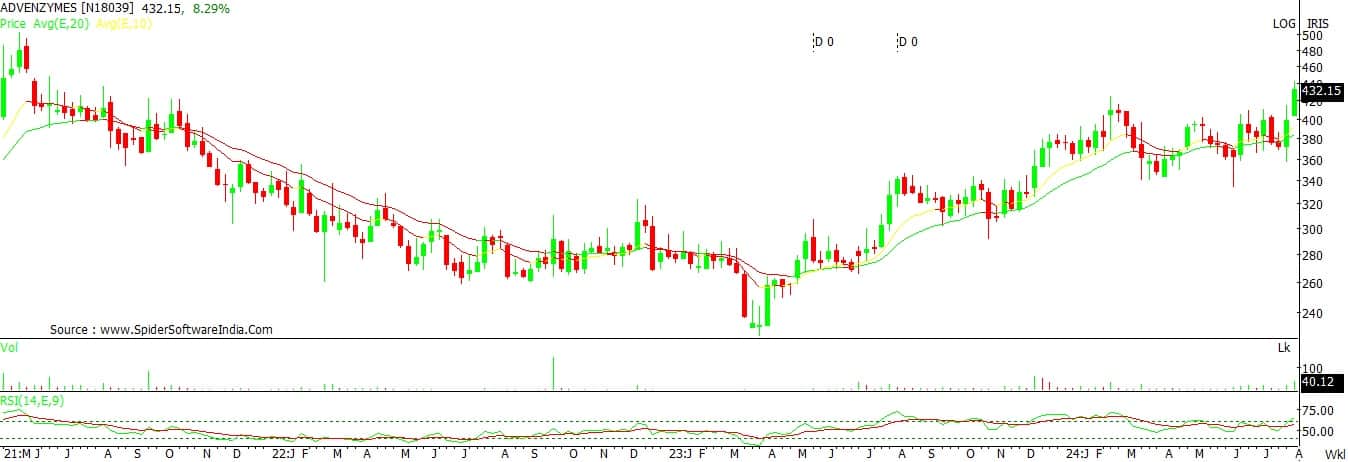
After showing a broader range-bound movement in the last couple of months, Advanced Enzyme witnessed a decisive upside breakout last week and closed higher. The chart pattern indicates a crucial trend reversal on the upside for the near term. Volume has expanded during the upside breakout, and the weekly 14-period RSI has moved above the upper 60 levels, which is a positive indication.
Strategy: Buy
Target: Rs 480
Stop-Loss: Rs 408
Disclaimer: The views and investment tips expressed by investment experts on Moneycontrol.com are their own and not those of the website or its management. Moneycontrol.com advises users to check with certified experts before taking any investment decisions.Discover the latest Business News, Sensex, and Nifty updates. Obtain Personal Finance insights, tax queries, and expert opinions on Moneycontrol or download the Moneycontrol App to stay updated!
Find the best of Al News in one place, specially curated for you every weekend.
Stay on top of the latest tech trends and biggest startup news.


