


Bulls staged a healthy comeback after a day of bearish action, driving the Nifty 50 higher by 135 points on September 3. However, the index could not surpass the previous day's high of 24,756, which remains a crucial level for any further upmove. While market sentiment improved, technical and momentum indicators still signal a mixed trend. If the index reclaims and sustains above 24,750, the 24,800 level (coinciding with the 50-day EMA) and 25,000 will be key levels to watch in the upcoming sessions. Conversely, if the index fails to hold above this zone, it could remain in a consolidation phase, with immediate support at 24,500, followed by a crucial support zone in the 24,400–24,300 range, according to experts.
Here are 15 data points we have collated to help you spot profitable trades:
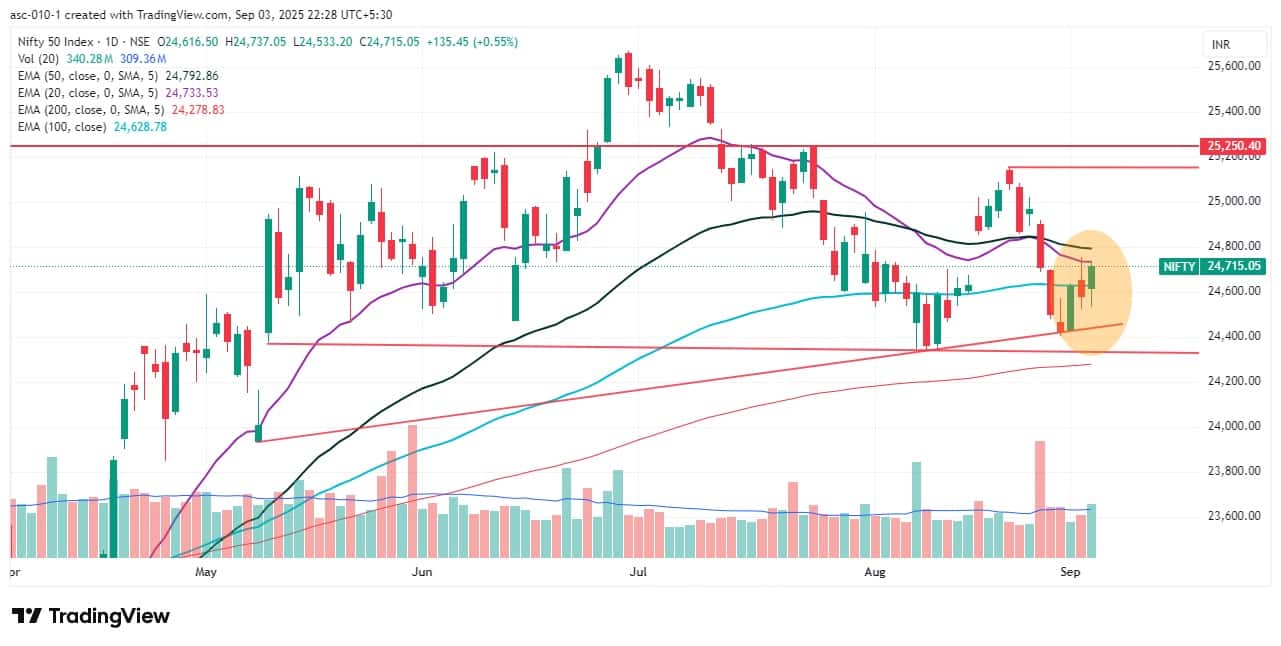
1) Key Levels For The Nifty 50 (24,715)
Resistance based on pivot points: 24,740, 24,788, and 24,866
Support based on pivot points: 24,584, 24,536, and 24,458
Special Formation: The Nifty 50 formed a bullish candle with a lower shadow on the daily chart, accompanied by above-average volumes—indicating a positive trend and buying interest at lower levels. The index’s higher-lows structure was maintained for the third consecutive session. It surpassed the 100-day EMA and the midline of the Bollinger Bands in a single session, but still closed below the 20- and 50-day EMAs. The RSI stands at 48.51 and is on the verge of a bullish crossover, while the Stochastic RSI displayed a positive crossover. However, the MACD continues to remain below both the zero line and the signal line. These mixed signals suggest emerging bullish potential, but a clear trend requires more confirmation.
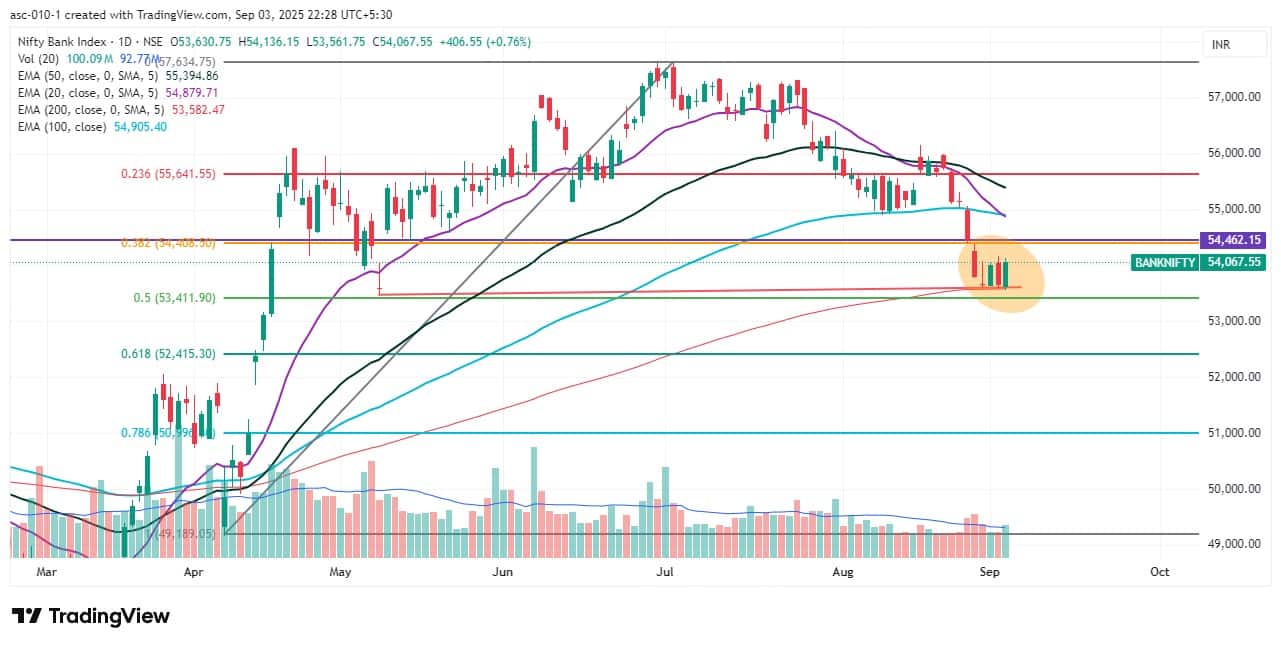
2) Key Levels For The Bank Nifty (54,068)
Resistance based on pivot points: 54,141, 54,277, and 54,496
Support based on pivot points: 53,702, 53,567, and 53,348
Resistance based on Fibonacci retracement: 54,531, 55,128
Support based on Fibonacci retracement: 53,412, 52,415
Special Formation: The Bank Nifty remained rangebound despite a strong 407-point rally, forming a long green candle next to the previous day's red candle on the daily timeframe. However, the broader trend still suggests bearishness, as the index continues to trade below its 20-, 50-, and 100-day EMAs. Notably, the 20-day EMA has fallen below the 100-day EMA, reinforcing the weak technical structure. The index once again tested its upward-sloping trendline support and the 200-day EMA (53,582), but managed to close above both levels. Momentum indicators remain weak. The MACD and its histogram continued to stay below the zero line, while the RSI remained below the signal line at 37.16—indicating lack of strength despite the price recovery.
According to the weekly options data, the 25,000 strike holds the maximum Call open interest (with 89.14 lakh contracts). This level can act as a key resistance for the Nifty in the short term. It was followed by the 25,500 strike (74.83 lakh contracts), and the 24,800 strike (61.03 lakh contracts).
Maximum Call writing was observed at the 25,000 strike, which saw an addition of 30.88 lakh contracts, followed by the 25,500 and 24,800 strikes, which added 25.68 lakh and 20.87 lakh contracts, respectively. There was hardly any Call unwinding seen in the 24,050-25,600 strike band.

On the Put side, the maximum Put open interest was seen at the 24,500 strike (with 1.17 crore contracts), which can act as a key support level for the Nifty. It was followed by the 24,600 strike (94.91 lakh contracts) and the 24,000 strike (87.12 lakh contracts).
The maximum Put writing was placed at the 24,500 strike, which saw an addition of 67.44 lakh contracts, followed by the 24,600 and 24,000 strikes, which added 60.81 lakh and 43.66 lakh contracts, respectively. There was hardly any Put unwinding seen in the 24,000-25,600 strike band.

5) Bank Nifty Call Options Data
According to the monthly options data, the maximum Call open interest was placed at the 55,000 strike, with 12.5 lakh contracts. This can act as a key resistance level for the index in the short term. It was followed by the 56,000 strike (12.22 lakh contracts) and the 54,000 strike (10.57 lakh contracts).
Maximum Call writing was observed at the 55,500 strike (with the addition of 58,845 contracts), followed by the 55,300 strike (48,300 contracts), and the 55,700 strike (28,735 contracts). The maximum Call unwinding was seen at the 54,000 strike, which shed 1.28 lakh contracts, followed by 56,000 and 55,000 strikes, which shed 99,890 and 61,320 contracts, respectively.
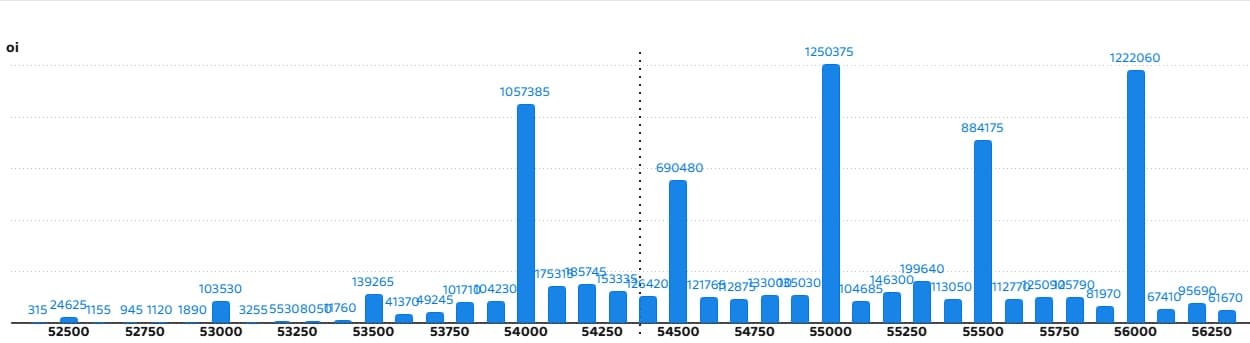
6) Bank Nifty Put Options Data
On the Put side, the 54,000 strike holds the maximum Put open interest (with 13.1 lakh contracts), which can act as a key support level for the index. This was followed by the 53,000 strike (8.91 lakh contracts) and the 55,000 strike (7.01 lakh contracts).
The maximum Put writing was observed at the 53,500 strike (which added 82,600 contracts), followed by the 53,700 strike (76,545 contracts) and the 53,600 strike (54,775 contracts). The maximum Put winding was seen at the 56,000 strike, which shed 13,440 contracts, followed by the 52,400 and 55,500 strikes, which shed 9,240 and 7,650 contracts, respectively.

The Nifty Put-Call ratio (PCR), which indicates the mood of the market, climbed to 1.21 on September 03, compared to 0.99 in the previous session.
The increasing PCR, or being higher than 0.7 or surpassing 1, means traders are selling more Put options than Call options, which generally indicates the firming up of a bullish sentiment in the market. If the ratio falls below 0.7 or moves towards 0.5, then it indicates selling in Calls is higher than selling in Puts, reflecting a bearish mood in the market.

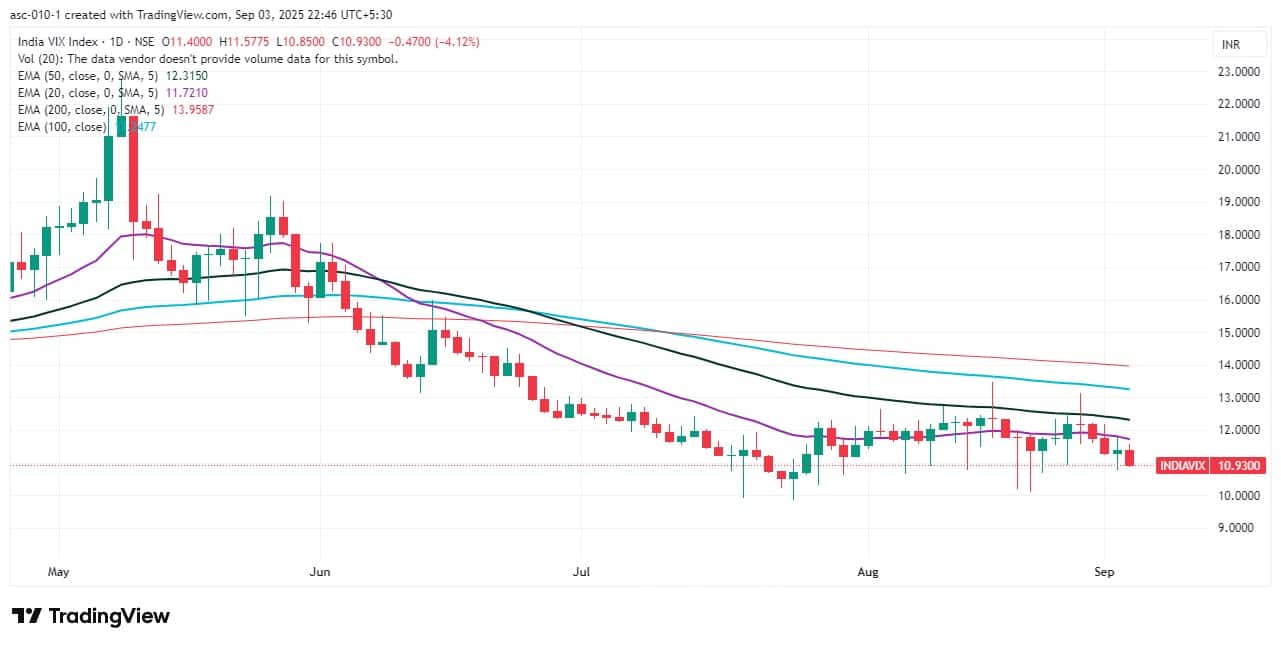
9) India VIX
The India VIX, which measures expected market volatility, fell 4.12 percent to 10.93—its lowest closing level since July 24—providing comfort to the bulls and suggesting stable near-term sentiment.
A long build-up was seen in 88 stocks. An increase in open interest (OI) and price indicates a build-up of long positions.

11) Long Unwinding (17 Stocks)
17 stocks saw a decline in open interest (OI) along with a fall in price, indicating long unwinding.
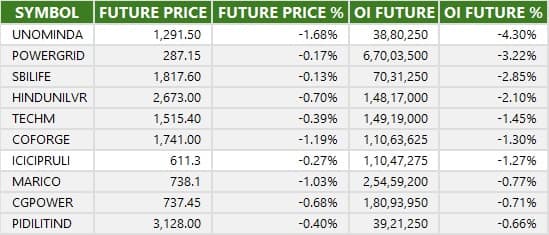
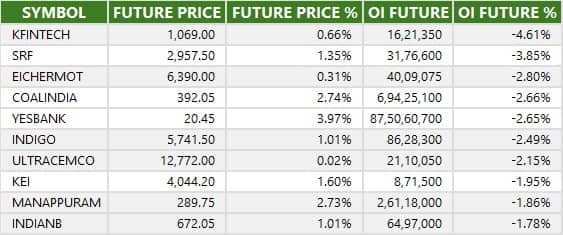
12) Short Build-up (29 Stocks)
29 stocks saw an increase in OI along with a fall in price, indicating a build-up of short positions.

13) Short-Covering (77 Stocks)
77 stocks saw short-covering, meaning a decrease in OI, along with a price increase.
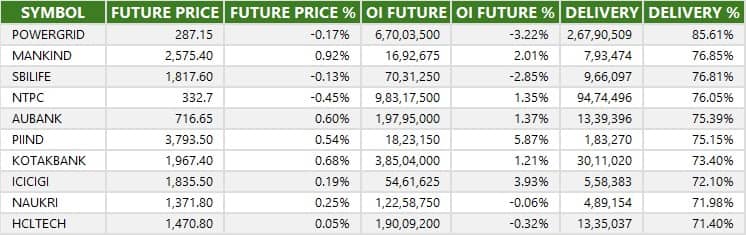
Here are the stocks that saw a high share of delivery trades. A high share of delivery reflects investing (as opposed to trading) interest in a stock.
Securities banned under the F&O segment include companies where derivative contracts cross 95 percent of the market-wide position limit.
Stocks added to F&O ban: RBL Bank
Stocks retained in F&O ban: Nil
Stocks removed from F&O ban: Nil
Disclaimer: The views and investment tips expressed by experts on Moneycontrol are their own and not those of the website or its management. Moneycontrol advises users to check with certified experts before taking any investment decisions.Disclosure: Moneycontrol is a part of the Network18 group. Network18 is controlled by Independent Media Trust, of which Reliance Industries is the sole beneficiary.Discover the latest Business News, Sensex, and Nifty updates. Obtain Personal Finance insights, tax queries, and expert opinions on Moneycontrol or download the Moneycontrol App to stay updated!
Find the best of Al News in one place, specially curated for you every weekend.
Stay on top of the latest tech trends and biggest startup news.


