


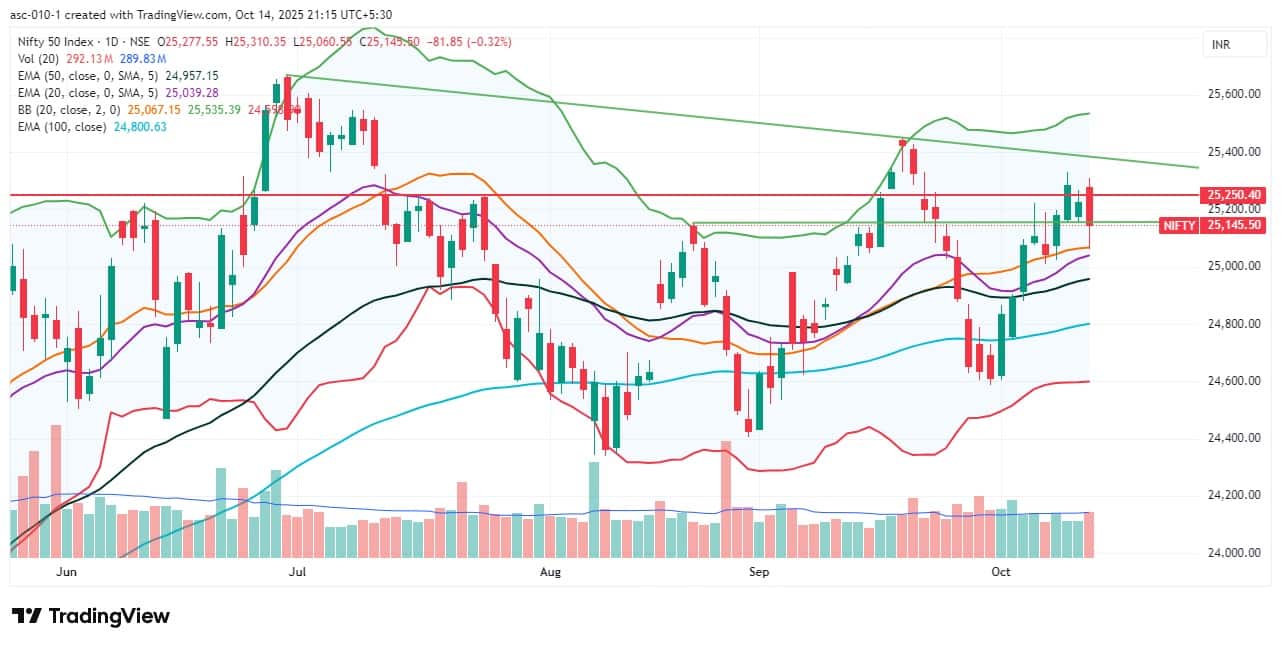
The Nifty 50 extended its southward journey amid volatility for the second consecutive session, falling 0.32 percent on October 14. Considering that the index stayed above all key moving averages & midline of Bollinger bands, and momentum indicators remain favourable, the overall trend continues to favour the bulls despite the ongoing consolidation. However, if the index breaks below the 25,060 and 24,950 support levels, the bears may take full control. Until then, consolidation and range-bound trading may persist, according to experts.
Here are 15 data points we have collated to help you spot profitable trades:
1) Key Levels For The Nifty 50 (25,146)
Resistance based on pivot points: 25,268, 25,326, and 25,422
Support based on pivot points: 25,077, 25,018, and 24,922
Special Formation: The Nifty 50 formed a long bearish candle with a lower shadow on the daily charts, indicating weakness; however, there was evident buying interest at lower levels. The index sustained above all key moving averages and the midline of the Bollinger Bands, continuing its higher high–higher low formation. The RSI maintained a positive crossover, though it tilted down to 55.08. The MACD also sustained its positive crossover, while the histogram held above the zero line. All of this indicates underlying strength in the trend, despite near-term volatility.
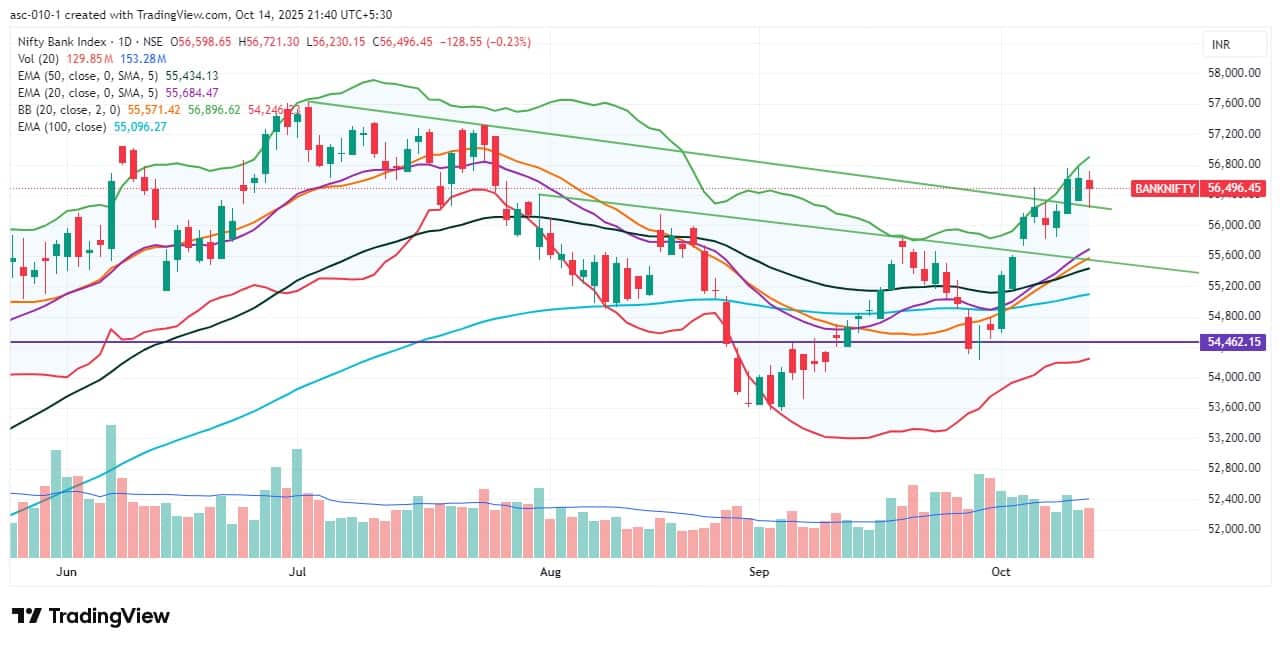
2) Key Levels For The Bank Nifty (56,496)
Resistance based on pivot points: 56,670, 56,786, and 56,974
Support based on pivot points: 56,295, 56,179, and 55,991
Resistance based on Fibonacci retracement: 56,758, 57,628
Support based on Fibonacci retracement: 56,014, 55,545
Special Formation: The Bank Nifty snapped its four-day winning streak and fell 129 points, forming a small bearish candle with a minor upper shadow and a long lower shadow on the daily charts. This pattern suggests moderate weakness, but also healthy buying interest at lower zones. Notably, the index defended the falling support trendline. It traded above all key moving averages, which are trending upward. Momentum indicators also showed a positive bias. All of this indicates that the index retains strength and resilience, despite the minor dip.
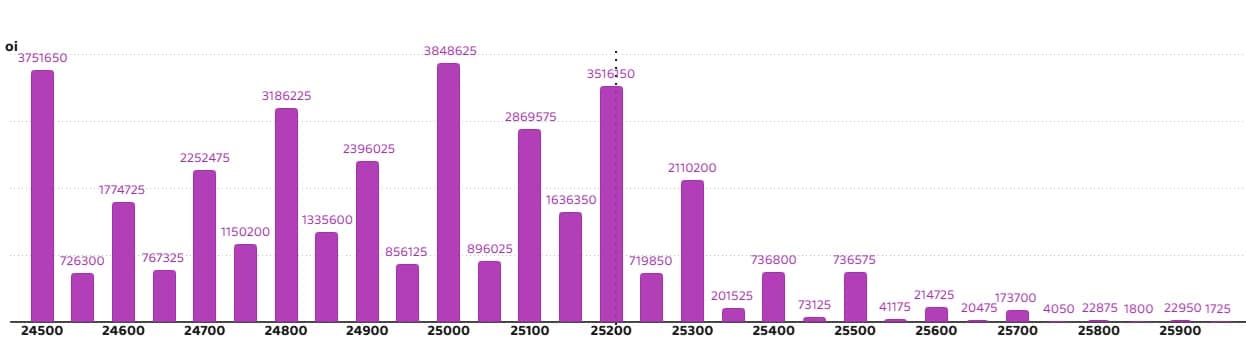
According to the weekly options data, the 25,200 strike holds the maximum Call open interest (with 61.77 lakh contracts). This level can act as a key resistance for the Nifty in the short term. It was followed by the 25,500 strike (61.27 lakh contracts), and the 25,300 strike (57.31 lakh contracts).
Maximum Call writing was observed at the 25,200 strike, which saw an addition of 39.8 lakh contracts, followed by the 25,300 and 25,400 strikes, which added 29.67 lakh and 25.14 lakh contracts, respectively. There was hardly any Call unwinding seen in the 24,500-25,950 strike band.

On the Put side, the maximum Put open interest was seen at the 25,000 strike (with 38.48 lakh contracts), which can act as a key support level for the Nifty. It was followed by the 24,500 strike (37.51 lakh contracts) and the 25,200 strike (35.16 lakh contracts).
The maximum Put writing was placed at the 25,100 strike, which saw an addition of 16.51 lakh contracts, followed by the 24,500 and 24,800 strikes, which added 14.8 lakh and 14.41 lakh contracts, respectively. The maximum Put unwinding was seen at the 25,250 strike, which shed 1.61 lakh contracts, followed by the 25,850 strike, which shed 225 contracts.
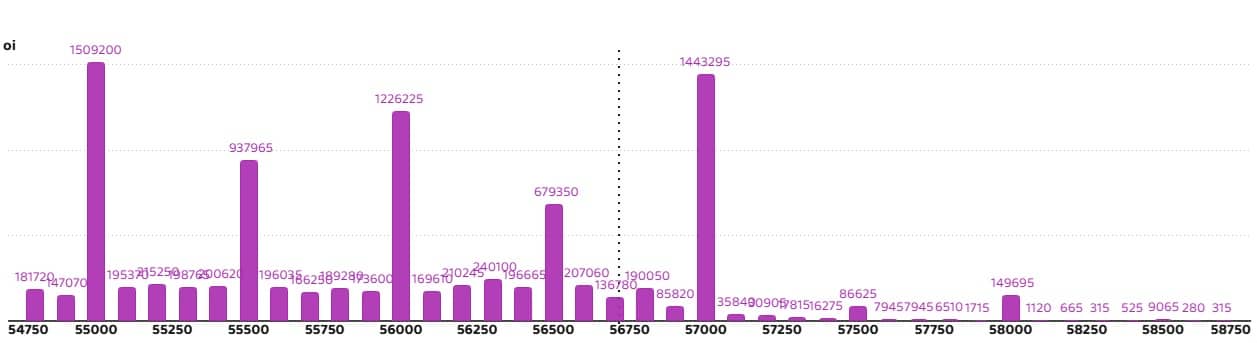
5) Bank Nifty Call Options Data
According to the monthly options data, the maximum Call open interest was placed at the 57,000 strike, with 23.6 lakh contracts. This can act as a key resistance level for the index in the short term. It was followed by the 58,000 strike (12.62 lakh contracts) and the 56,500 strike (10.07 lakh contracts).
Maximum Call writing was observed at the 56,500 strike (with the addition of 2.12 lakh contracts), followed by the 56,600 (1.32 lakh contracts) and 57,000 strike (95,585 contracts). The maximum Call unwinding was seen at the 58,500 strike, which shed 51,555 contracts, followed by the 56,000 and 57,300 strikes, which shed 39,235 and 37,345 contracts, respectively.
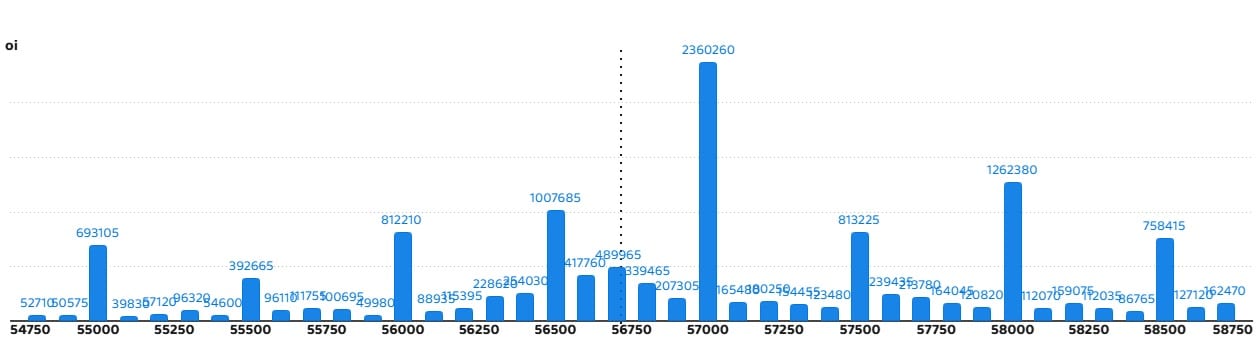
6) Bank Nifty Put Options Data
On the Put side, the 55,000 strike holds the maximum Put open interest (with 15.09 lakh contracts), which can act as a key support level for the index. This was followed by the 57,000 strike (14.43 lakh contracts) and the 56,000 strike (12.26 lakh contracts).
The maximum Put writing was placed at the 56,300 strike (which added 20,230 contracts), followed by the 55,100 strike (15,505 contracts) and the 55,200 strike (9,170 contracts). The maximum Put unwinding was seen at the 55,000 strike which shed 83,720 contracts, followed by the 56,700 and 56,000 strikes, which shed 75,600 and 64,260 contracts, respectively.

The Nifty Put-Call ratio (PCR), which indicates the mood of the market, dropped to 0.91 on October 14, compared to 1.05 in the previous session.
The increasing PCR, or being higher than 0.7 or surpassing 1, means traders are selling more Put options than Call options, which generally indicates the firming up of a bullish sentiment in the market. If the ratio falls below 0.7 or moves towards 0.5, then it indicates selling in Calls is higher than selling in Puts, reflecting a bearish mood in the market.

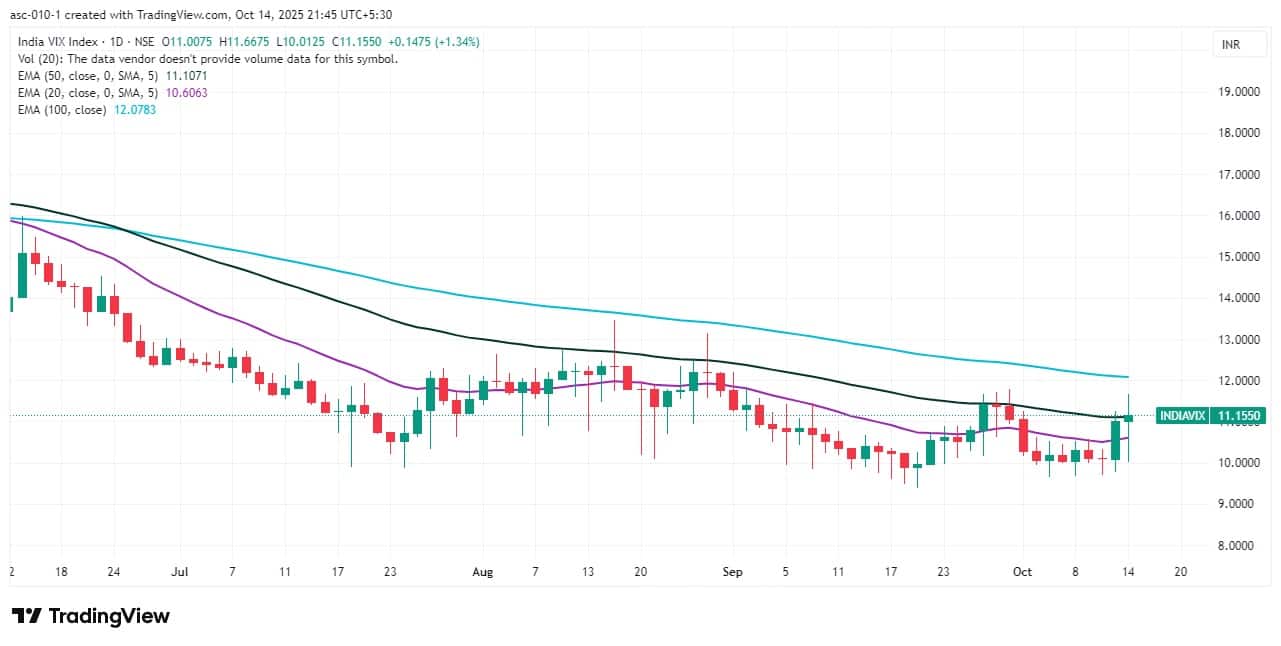
9) India VIX
The India VIX, which measures expected market volatility, gained further and climbed above the short- and medium-term moving averages, rising 1.34 percent to 11.16. This signals some caution for the bulls, as rising volatility could introduce short-term uncertainty.
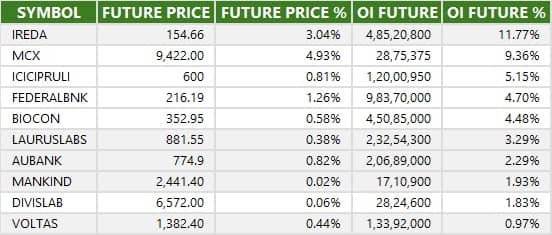
A long build-up was seen in 16 stocks. An increase in open interest (OI) and price indicates a build-up of long positions.
11) Long Unwinding (68 Stocks)
68 stocks saw a decline in open interest (OI) along with a fall in price, indicating long unwinding.
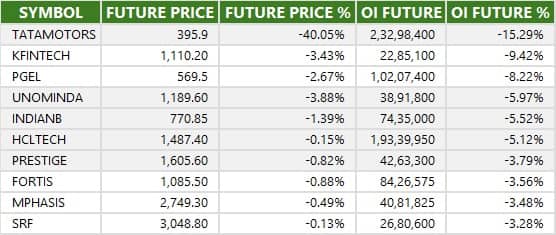
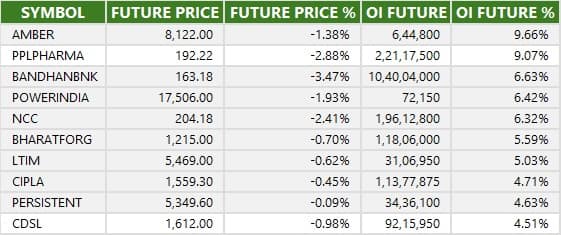
12) Short Build-up (106 Stocks)
106 stocks saw an increase in OI along with a fall in price, indicating a build-up of short positions.
13) Short-Covering (22 Stocks)
22 stocks saw short-covering, meaning a decrease in OI, along with a price increase.

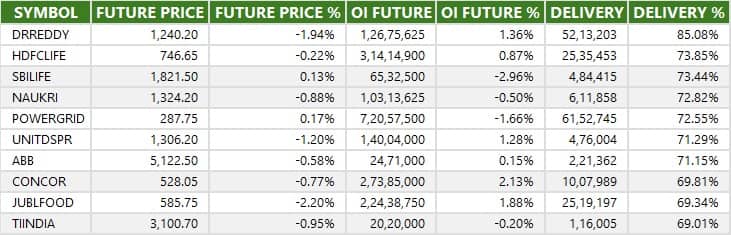
Here are the stocks that saw a high share of delivery trades. A high share of delivery reflects investing (as opposed to trading) interest in a stock.
Securities banned under the F&O segment include companies where derivative contracts cross 95 percent of the market-wide position limit.
Stocks added to F&O ban: Nil
Stocks retained in F&O ban: RBL Bank, Sammaan Capital
Stocks removed from F&O ban: Nil
Disclaimer: The views and investment tips expressed by experts on Moneycontrol are their own and not those of the website or its management. Moneycontrol advises users to check with certified experts before taking any investment decisions.
Disclaimer: Moneycontrol is a part of the Network18 group. Network18 is controlled by Independent Media Trust, of which Reliance Industries is the sole beneficiary.
Discover the latest Business News, Sensex, and Nifty updates. Obtain Personal Finance insights, tax queries, and expert opinions on Moneycontrol or download the Moneycontrol App to stay updated!
Find the best of Al News in one place, specially curated for you every weekend.
Stay on top of the latest tech trends and biggest startup news.


