


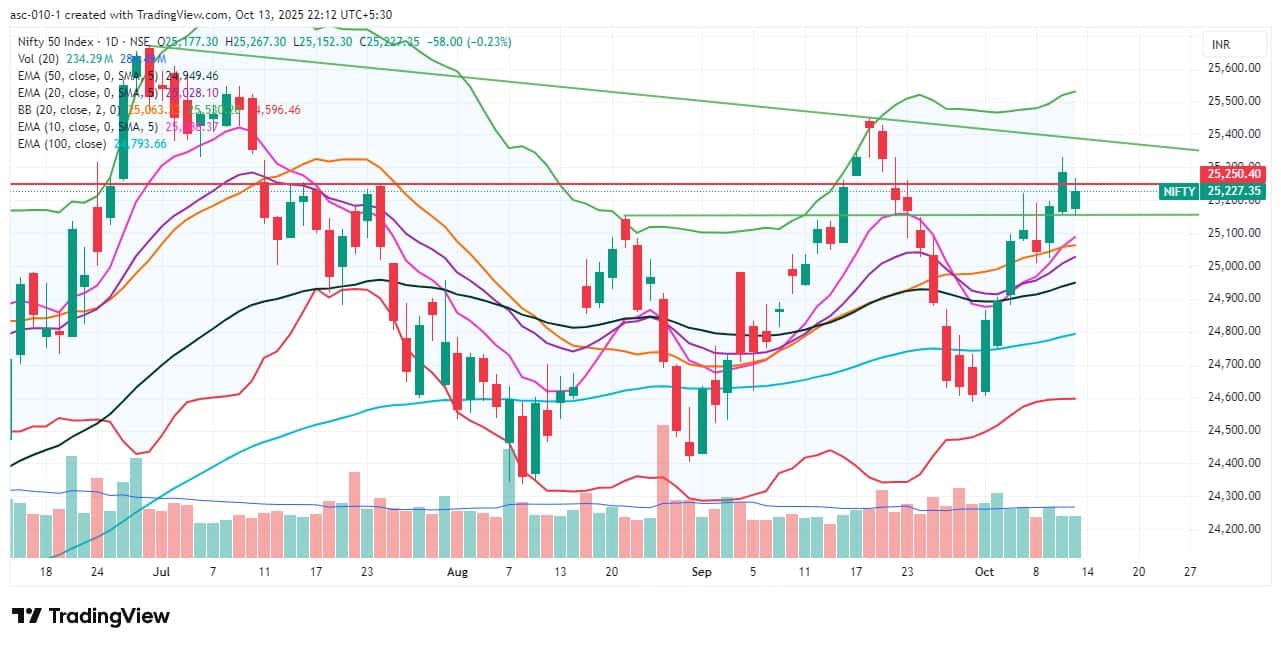
Bulls took a breather after a two-day rally as the Nifty 50 fell 0.23 percent following a gap-down opening on October 13, driven by renewed US-China trade tensions. However, the broader bullish trend remained intact. The index continued to form a higher high–higher low pattern, supported by healthy momentum indicators. It defended the 25,150–25,200 zone, which can act as immediate support, with 25,000 serving as a key support level. On the higher side, the 25,400–25,500 range is expected to be a key resistance zone. A decisive move above this range could open the door to test the June swing high of 25,670, according to experts.
Here are 15 data points we have collated to help you spot profitable trades:
1) Key Levels For The Nifty 50 (25,227)
Resistance based on pivot points: 25,260, 25,287, and 25,331
Support based on pivot points: 25,172, 25,145, and 25,101
Special Formation: The Nifty 50 formed a bullish candle with minor upper and lower shadows on the daily charts, despite a moderate correction, indicating strong recovery from the day's low amid volatility. The index traded well above the 20-, 50-, and 100-day EMAs, all of which are trending higher. The MACD maintained its bullish crossover with consistent strength in the histogram. The RSI also held a positive bias, though it tilted down to 58.5, while the Stochastic RSI sustained a bullish crossover. All of this indicates underlying strength and continued positive momentum.
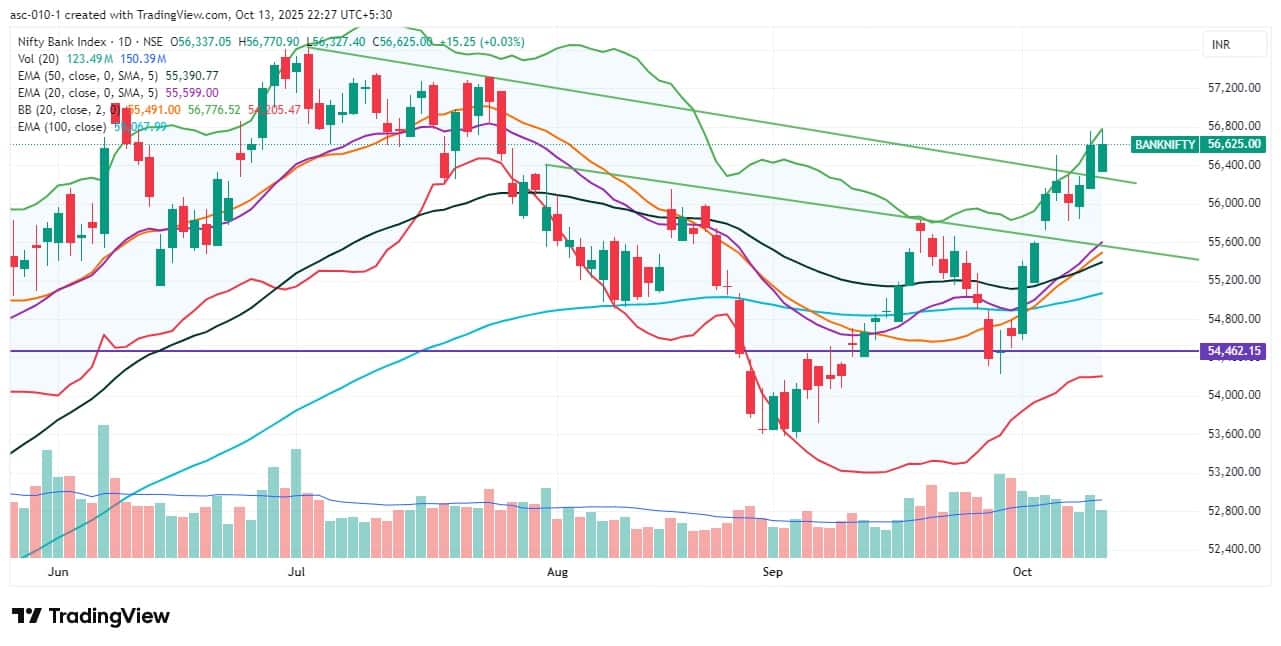
2) Key Levels For The Bank Nifty (56,625)
Resistance based on pivot points: 56,744, 56,849, and 57,018
Support based on pivot points: 56,405, 56,300, and 56,131
Resistance based on Fibonacci retracement: 56,758, 57,628
Support based on Fibonacci retracement: 56,014, 55,545
Special Formation: The Bank Nifty also formed a bullish candle with a minor upper shadow on the daily timeframe, reflecting buying interest despite some pressure at higher levels. The index stayed above the downward-sloping resistance trendline for another session and continued to trade above all key moving averages. The 20-, 50-, and 100-day EMAs remained upward-trending. Meanwhile, the RSI rose to 66.90, and the MACD remained strong, with continued strength in the histogram. All of this indicates sustained bullish momentum and underlying strength in the index.
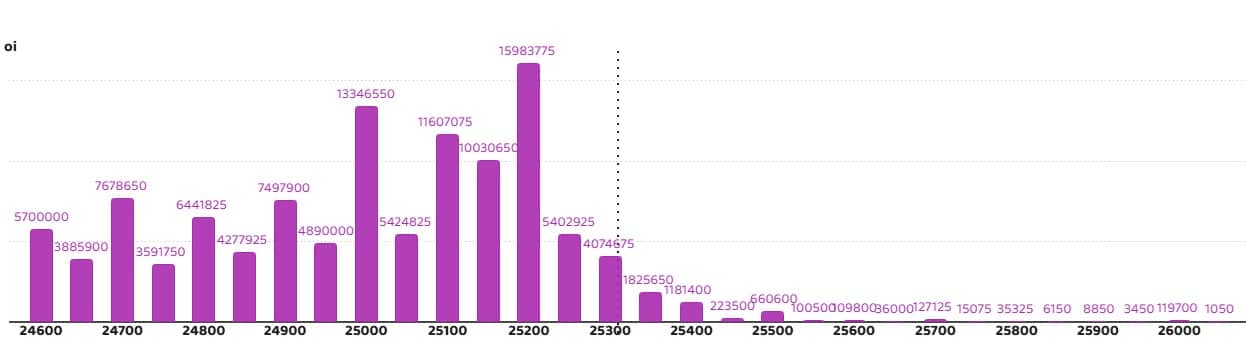
According to the weekly options data, the maximum Call open interest was seen at the 25,300 strike (with 1.53 crore contracts). This level can act as a key resistance for the Nifty in the short term. It was followed by the 25,500 strike (1.48 crore contracts), and the 25,400 strike (1.39 crore contracts).
Maximum Call writing was observed at the 25,200 strike, which saw an addition of 73.56 lakh contracts, followed by the 25,300 and 25,250 strikes, which added 67.28 lakh and 63.36 lakh contracts, respectively. The maximum Call unwinding was seen at the 25,000 strike, which shed 7.43 lakh contracts, followed by the 25,450 and 25,050 strikes, which shed 6.49 lakh and 3.5 lakh contracts, respectively.

On the Put side, the 25,200 strike holds the maximum Put open interest (with 1.59 crore contracts), which can act as a key support level for the Nifty. It was followed by the 25,000 strike (1.33 crore contracts) and the 25,100 strike (1.16 crore contracts).
The maximum Put writing was placed at the 25,200 strike, which saw an addition of 21.91 lakh contracts, followed by the 25,150 and 24,950 strikes, which added 16.63 lakh and 3.76 lakh contracts, respectively. The maximum Put unwinding was seen at the 25,300 strike, which shed 60.77 lakh contracts, followed by the 25,250 and 25,350 strikes, which shed 32.42 lakh and 23.86 lakh contracts, respectively.
5) Bank Nifty Call Options Data
According to the monthly options data, the 57,000 strike holds the maximum Call open interest, with 22.64 lakh contracts. This can act as a key resistance level for the index in the short term. It was followed by the 58,000 strike (11.81 lakh contracts) and the 56,000 strike (8.51 lakh contracts).
Maximum Call writing was observed at the 56,700 strike (with the addition of 1.12 lakh contracts), followed by the 58,500 (1.03 lakh contracts) and 57,000 strike (89,985 contracts). The maximum Call unwinding was seen at the 56,000 strike, which shed 38,815 contracts, followed by the 56,200 and 55,500 strikes, which shed 26,320 and 22,050 contracts, respectively.
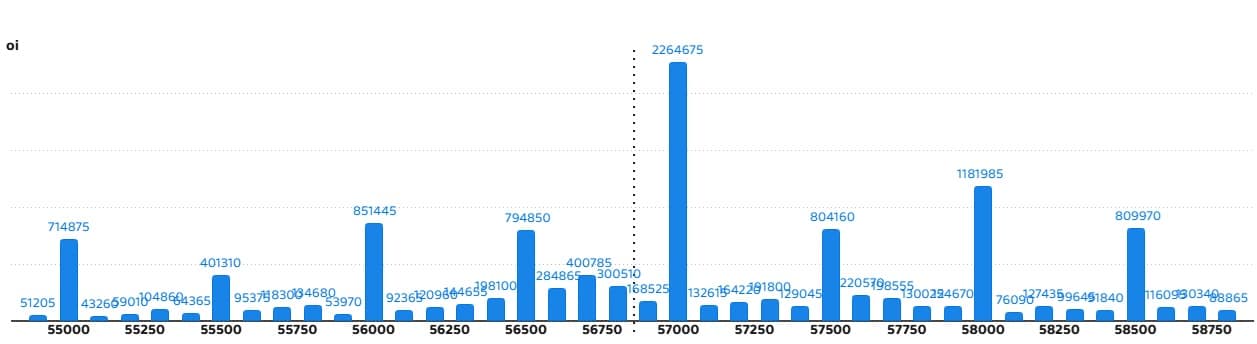
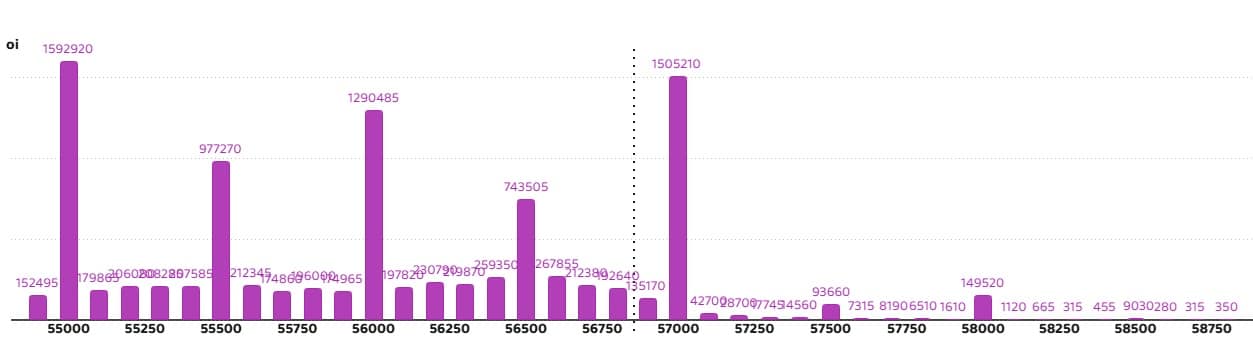
6) Bank Nifty Put Options Data
On the Put side, the maximum Put open interest was seen at the 55,000 strike (with 15.92 lakh contracts), which can act as a key support level for the index. This was followed by the 57,000 strike (15.05 lakh contracts) and the 56,000 strike (12.9 lakh contracts).
The maximum Put writing was placed at the 56,500 strike (which added 66,815 contracts), followed by the 56,700 strike (63,490 contracts) and the 56,600 strike (47,285 contracts). The maximum Put unwinding was seen at the 56,200 strike which shed 1.04 lakh contracts, followed by the 54,900 and 55,000 strikes, which shed 83,440 and 33,250 contracts, respectively.

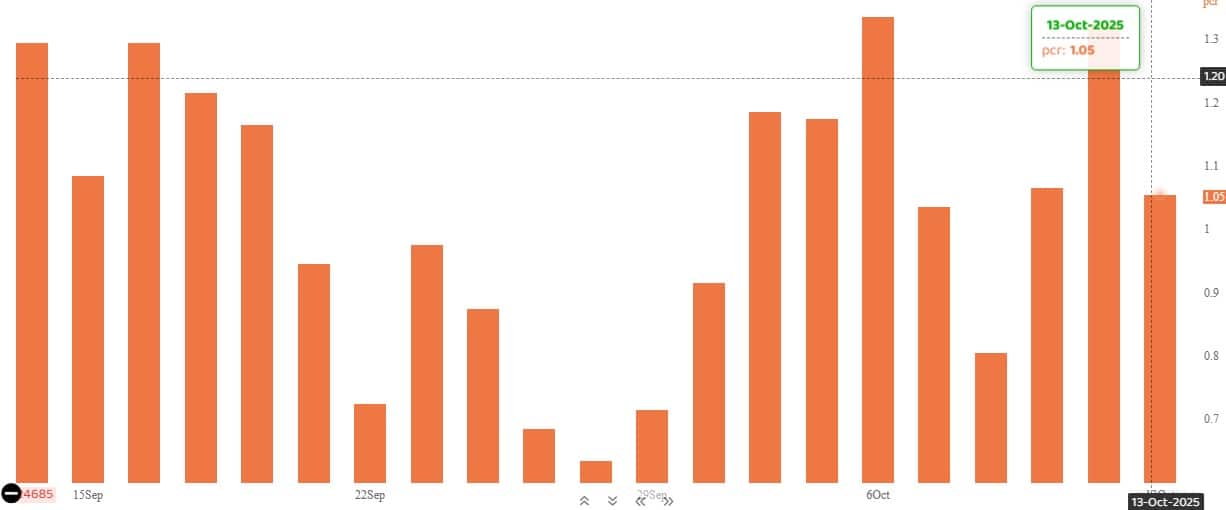
The Nifty Put-Call ratio (PCR), which indicates the mood of the market, fell to 1.05 on October 13, compared to 1.32 in the previous session.
The increasing PCR, or being higher than 0.7 or surpassing 1, means traders are selling more Put options than Call options, which generally indicates the firming up of a bullish sentiment in the market. If the ratio falls below 0.7 or moves towards 0.5, then it indicates selling in Calls is higher than selling in Puts, reflecting a bearish mood in the market.
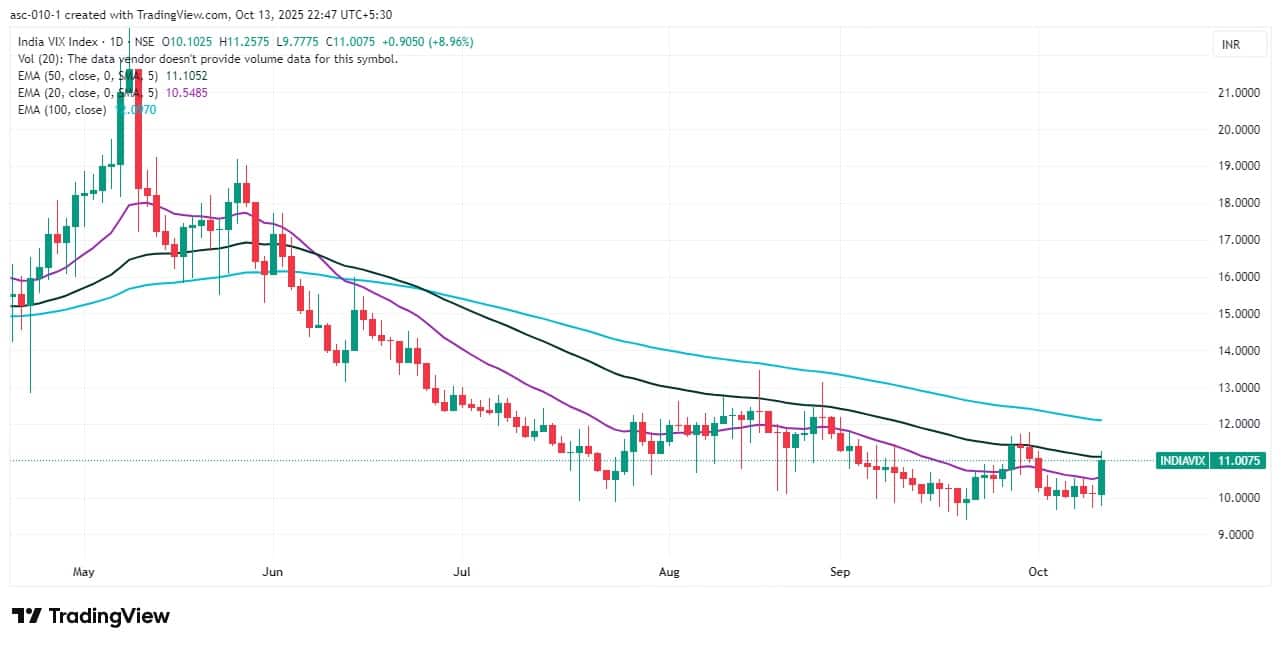
9) India VIX
The India VIX, also known as the fear gauge, jumped 8.96 percent to 11.01 and climbed above short-term moving averages, signalling a bit of discomfort for the bulls.
A long build-up was seen in 43 stocks. An increase in open interest (OI) and price indicates a build-up of long positions.
11) Long Unwinding (43 Stocks)
43 stocks saw a decline in open interest (OI) along with a fall in price, indicating long unwinding.

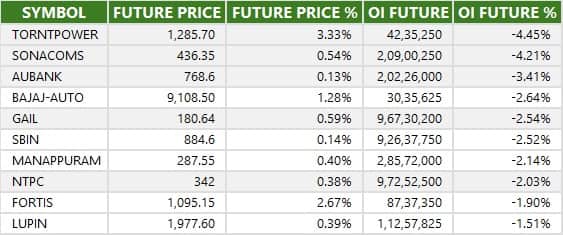
12) Short Build-up (97 Stocks)
97 stocks saw an increase in OI along with a fall in price, indicating a build-up of short positions.

13) Short-Covering (30 Stocks)
30 stocks saw short-covering, meaning a decrease in OI, along with a price increase.
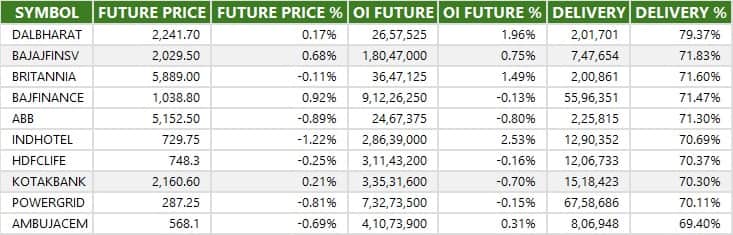
Here are the stocks that saw a high share of delivery trades. A high share of delivery reflects investing (as opposed to trading) interest in a stock.
Securities banned under the F&O segment include companies where derivative contracts cross 95 percent of the market-wide position limit.
Stocks added to F&O ban: Nil
Stocks retained in F&O ban: RBL Bank, Sammaan Capital
Stocks removed from F&O ban: Nil
Disclaimer: The views and investment tips expressed by experts on Moneycontrol are their own and not those of the website or its management. Moneycontrol advises users to check with certified experts before taking any investment decisions.Disclaimer: Moneycontrol is a part of the Network18 group. Network18 is controlled by Independent Media Trust, of which Reliance Industries is the sole beneficiary.Discover the latest Business News, Sensex, and Nifty updates. Obtain Personal Finance insights, tax queries, and expert opinions on Moneycontrol or download the Moneycontrol App to stay updated!
Find the best of Al News in one place, specially curated for you every weekend.
Stay on top of the latest tech trends and biggest startup news.


