


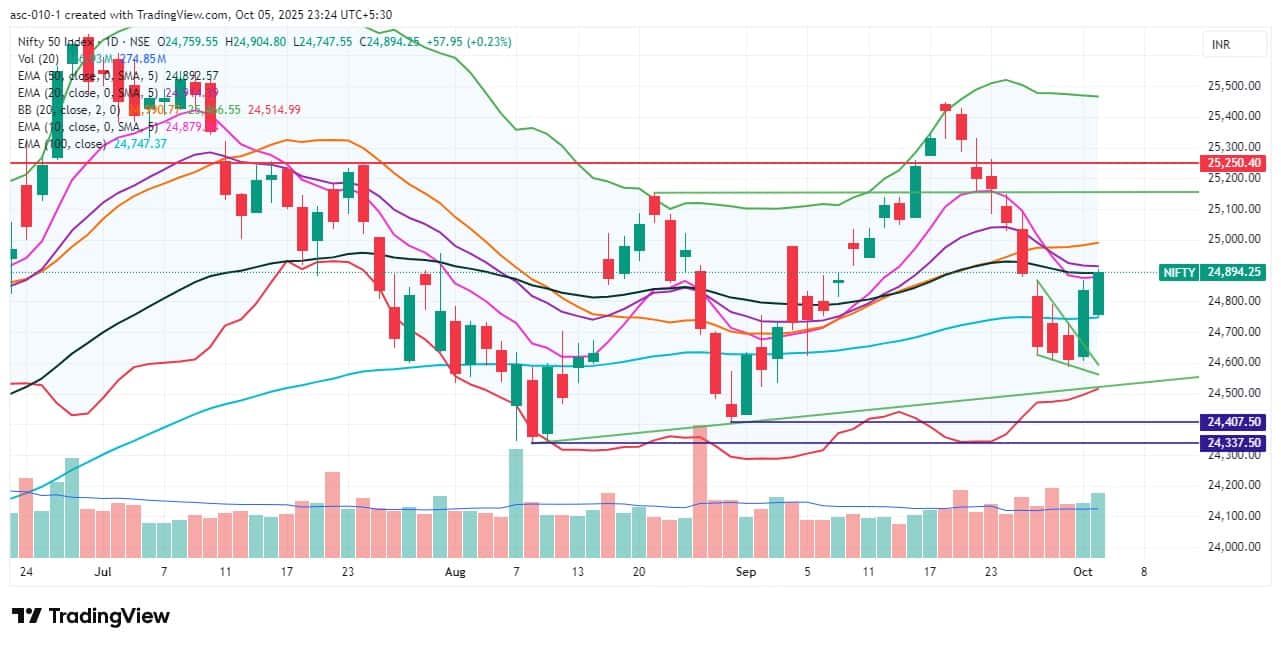
The Nifty 50 saw follow-up buying interest on October 3, rising 0.2 percent with above-average volumes and sustaining above the 100-day EMA, while forming a green candle on the daily charts. Sentiment improved; however, momentum indicators still need to show bullish crossovers, and the index must surpass and sustain above the midline of the Bollinger Bands to continue its upward journey. The 25,000 level is expected to be a crucial hurdle for any further uptrend toward 25,100–25,250. Until then, consolidation and rangebound trading may persist, with support at 24,600, experts said.
Here are 15 data points we have collated to help you spot profitable trades:
1) Key Levels For The Nifty 50 (24,894)
Resistance based on pivot points: 24,909, 24,946, and 25,006
Support based on pivot points: 24,789, 24,752, and 24,692
Special Formation: The Nifty 50 formed a bullish candle on the daily charts with a higher high–higher low structure for another session, although the broader pattern of lower high–lower low remains intact. The index sustained above the 100-day EMA but needs to reclaim and sustain above the 20-day and 50-day EMAs, as well as the midline of the Bollinger Bands, to confirm a further uptrend. The RSI showed a further uptick but still maintained a negative crossover. The MACD continued to show a bearish crossover, though histogram weakness faded, it remained below the zero line. All these indicators suggest caution, with confirmation of an uptrend still pending.
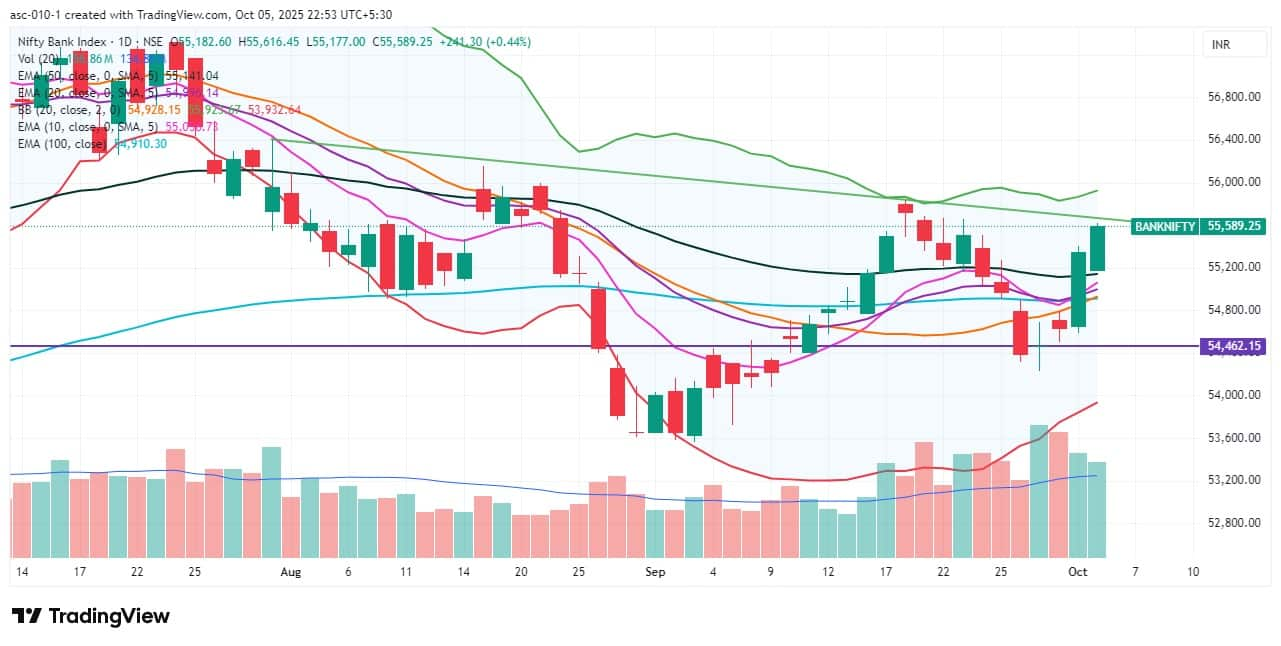
2) Key Levels For The Bank Nifty (55,589)
Resistance based on pivot points: 55,629, 55,732, and 55,900
Support based on pivot points: 55,293, 55,189, and 55,021
Resistance based on Fibonacci retracement: 56,075, 56,758
Support based on Fibonacci retracement: 54,967, 54,698
Special Formation: The Bank Nifty continued to outperform the benchmark Nifty 50, rising 0.44 percent, trading above all key moving averages, and moving closer to the downward-sloping resistance trendline, accompanied by above-average volumes. The RSI sustained a bullish crossover, while the MACD also maintained a positive crossover, with the histogram strengthening further. All these indicators suggest continued strength and potential for further gains.
According to the weekly options data, the maximum Call open interest was seen at the 25,000 strike (with 1.27 crore contracts). This level can act as a key resistance for the Nifty in the short term. It was followed by the 25,500 strike (1.25 crore contracts), and the 24,900 strike (98.46 lakh contracts).
Maximum Call writing was observed at the 25,500 strike, which saw an addition of 54.85 lakh contracts, followed by the 24,900 and 25,100 strikes, which added 51.53 lakh and 41.15 lakh contracts, respectively. The maximum Call unwinding was seen at the 24,700 strike, which shed 6.78 lakh contracts, followed by the 24,650 and 24,600 strikes, which shed 3.43 lakh and 2.84 lakh contracts, respectively.
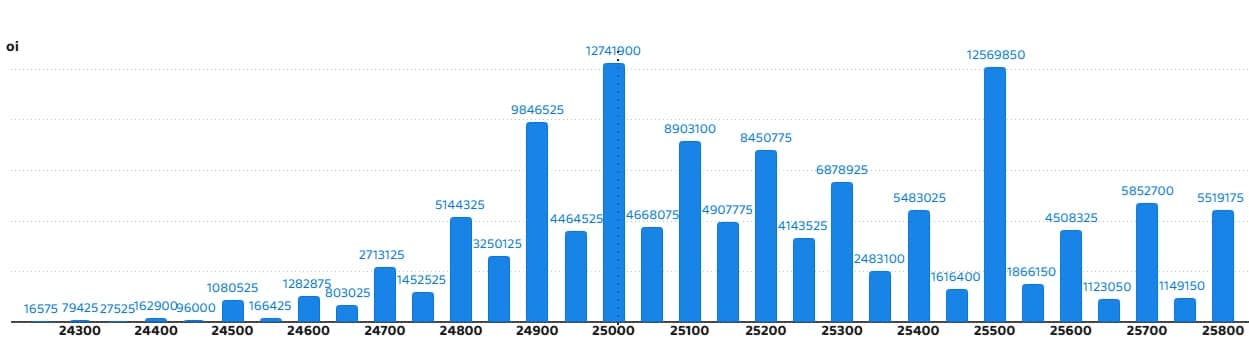
On the Put side, the 24,800 strike holds the maximum Put open interest (with 1.4 crore contracts), which can act as a key support level for the Nifty. It was followed by the 24,700 strike (1.18 crore contracts) and the 24,600 strike (1.12 crore contracts).
The maximum Put writing was placed at the 24,900 strike, which saw an addition of 69.92 lakh contracts, followed by the 24,800 and 24,850 strikes, which added 59.04 lakh and 43.27 lakh contracts, respectively. The maximum Put unwinding was seen at the 25,300 strike, which shed 38,175 contracts, followed by the 25,200 and 25,400 strikes, which shed 33,825 and 25,050 contracts, respectively.

5) Bank Nifty Call Options Data
According to the monthly options data, the 57,000 strike holds the maximum Call open interest, with 21.09 lakh contracts. This can act as a key resistance level for the index in the short term. It was followed by the 56,000 strike (10.91 lakh contracts) and the 55,000 strike (8.59 lakh contracts).
Maximum Call writing was observed at the 57,500 strike (with the addition of 91,105 contracts), followed by the 56,000 strike (87,850 contracts), and the 55,600 strike (53,095 contracts). The maximum Call unwinding was seen at the 55,000 strike, which shed 49,700 contracts, followed by the 55,200 and 55,300 strikes, which shed 33,670 and 23,135 contracts, respectively.

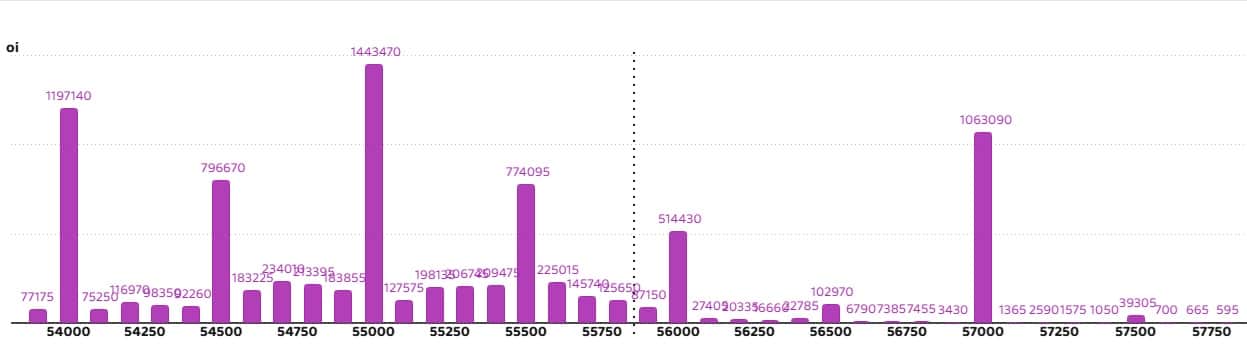
6) Bank Nifty Put Options Data
On the Put side, the maximum Put open interest was seen at the 55,000 strike (with 14.43 lakh contracts), which can act as a key support level for the index. This was followed by the 54,000 strike (11.97 lakh contracts) and the 57,000 strike (10.63 lakh contracts).
The maximum Put writing was observed at the 55,500 strike (which added 1.38 lakh contracts), followed by the 54,500 strike (1.08 lakh contracts) and the 55,600 strike (88,725 contracts). The maximum Put winding was seen at the 54,600 and 54700 strikes, which shed 11,410 contracts each, followed by the 53,900 strike which shed 11,025 contracts.

The Nifty Put-Call ratio (PCR), which indicates the mood of the market, fell to 1.17 on October 03, compared to 1.18 in the previous session.
The increasing PCR, or being higher than 0.7 or surpassing 1, means traders are selling more Put options than Call options, which generally indicates the firming up of a bullish sentiment in the market. If the ratio falls below 0.7 or moves towards 0.5, then it indicates selling in Calls is higher than selling in Puts, reflecting a bearish mood in the market.

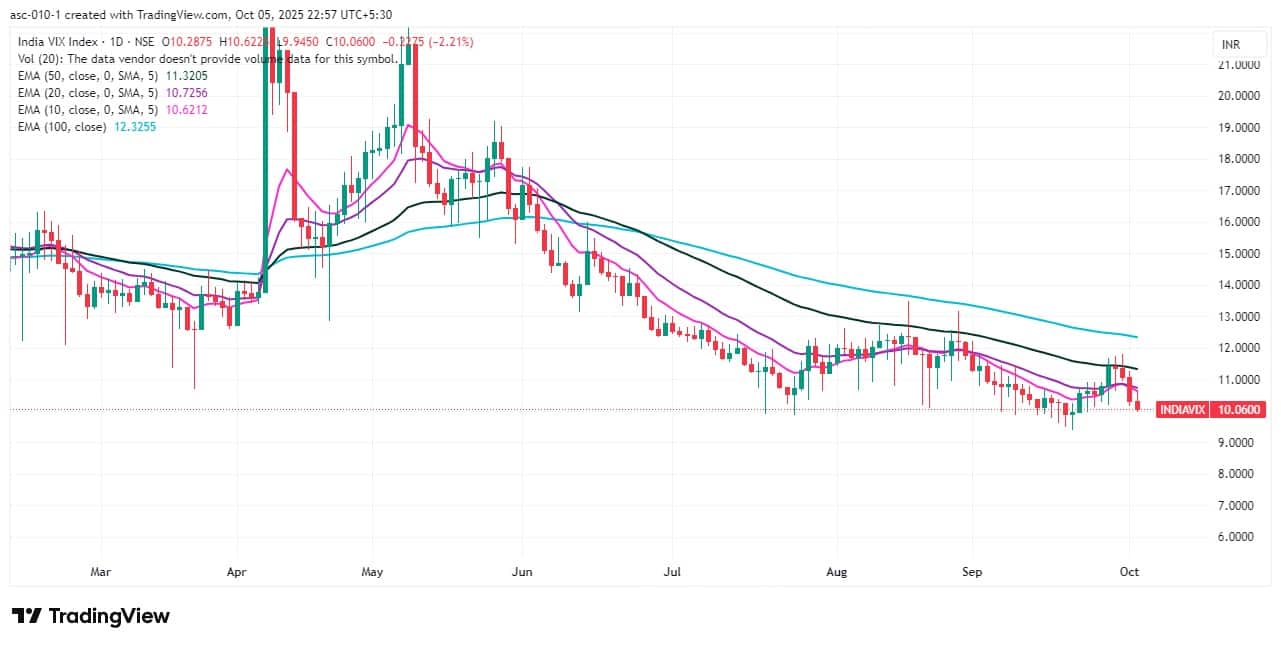
9) India VIX
The India VIX, also known as the fear index, fell for the fourth consecutive session and remained below short- and medium-term moving averages, signaling a favourable environment for the bulls. The VIX declined 2.21 percent on Friday, settling at 10.06, the lowest level since September 19.
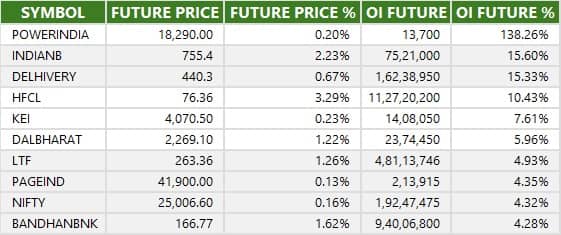
A long build-up was seen in 95 stocks. An increase in open interest (OI) and price indicates a build-up of long positions.
11) Long Unwinding (17 Stocks)
17 stocks saw a decline in open interest (OI) along with a fall in price, indicating long unwinding.
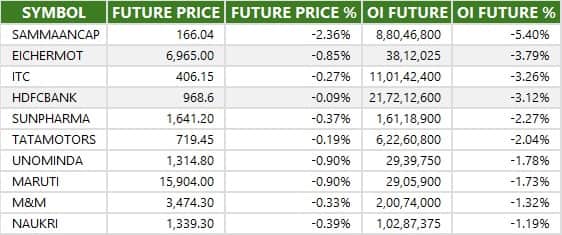
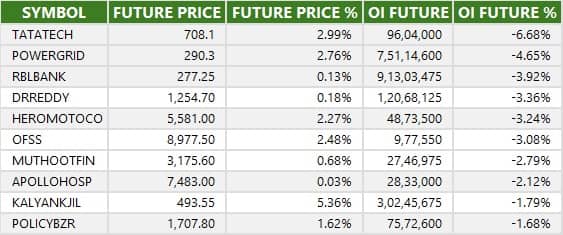
12) Short Build-up (43 Stocks)
43 stocks saw an increase in OI along with a fall in price, indicating a build-up of short positions.
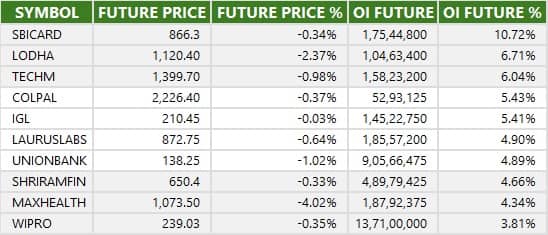
13) Short-Covering (57 Stocks)
57 stocks saw short-covering, meaning a decrease in OI, along with a price increase.
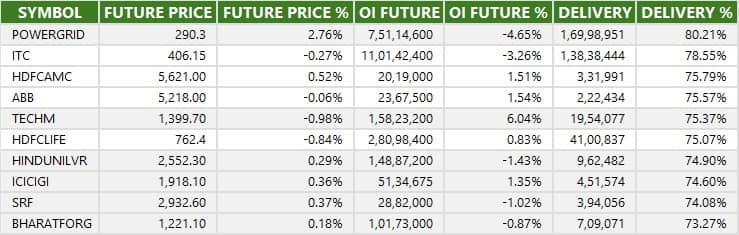
Here are the stocks that saw a high share of delivery trades. A high share of delivery reflects investing (as opposed to trading) interest in a stock.
Securities banned under the F&O segment include companies where derivative contracts cross 95 percent of the market-wide position limit.
Stocks added to F&O ban: Nil
Stocks retained in F&O ban: RBL Bank
Stocks removed from F&O ban: Nil
Disclaimer: The views and investment tips expressed by experts on Moneycontrol are their own and not those of the website or its management. Moneycontrol advises users to check with certified experts before taking any investment decisions.Disclosure: Moneycontrol is a part of the Network18 group. Network18 is controlled by Independent Media Trust, of which Reliance Industries is the sole beneficiary.Discover the latest Business News, Sensex, and Nifty updates. Obtain Personal Finance insights, tax queries, and expert opinions on Moneycontrol or download the Moneycontrol App to stay updated!
Find the best of Al News in one place, specially curated for you every weekend.
Stay on top of the latest tech trends and biggest startup news.


