


The Nifty 50 decisively surpassed 24,850 and tested a long downward-sloping resistance trendline, with volume higher than the previous day's, following a positive opening on May 26. The index closed 0.6 percent higher, extending its northward journey for the second consecutive session. The index might consolidate with support at the 24,850–24,900 zone, as a breakdown below this could trigger selling pressure. However, as long as it holds this support, the march toward the 25,200–25,300 range (which coincides with the upper line of the Bollinger Bands and the 78.6 percent Fibonacci retracement) remains possible. This could act as a resistance zone, and a break above it might trigger a sharp rally, according to experts.

Here are 15 data points we have collated to help you spot profitable trades:
1) Key Levels For The Nifty 50 (25,001)
Resistance based on pivot points: 25,062, 25,104, and 25,172
Support based on pivot points: 24,925, 24,883, and 24,815
Special Formation: The Nifty 50 formed a bullish candlestick with an upper shadow on the daily charts, indicating a positive bias but with some pressure at higher levels. The upper line of the Bollinger Bands continued to expand, while the MACD remained well above the zero line, though there was a minor negative crossover. The RSI at 61.45 is on the verge of a positive crossover.
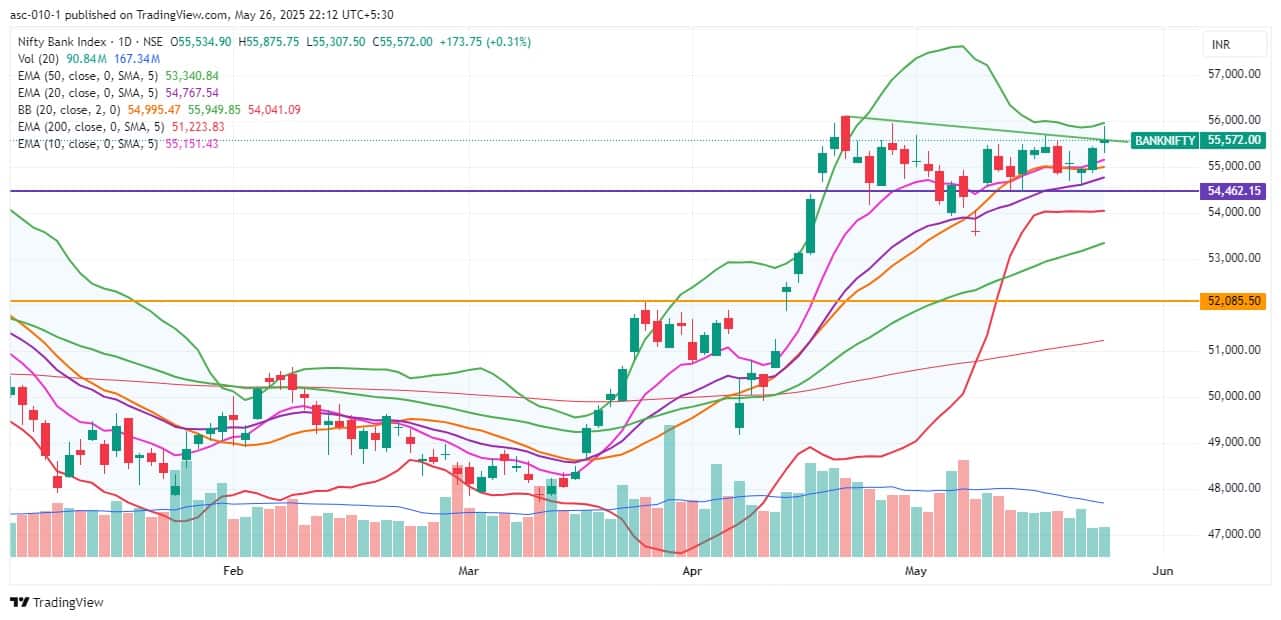
2) Key Levels For The Bank Nifty (55,572)
Resistance based on pivot points: 55,802, 55,936, and 56,153
Support based on pivot points: 55,368, 55,234, and 55,017
Resistance based on Fibonacci retracement: 56,307, 58,648
Support based on Fibonacci retracement: 54,117, 52,892
Special Formation: The Bank Nifty formed a Doji-like candlestick pattern on the daily timeframe and moved closer to the upper line of the Bollinger Bands, while attempting to test the swing high of April 29. The index continued forming higher highs and higher lows for another session, trading well above all key moving averages. It is also nearing a downward-sloping resistance trendline, while the RSI at 60.97 showed a positive crossover.
According to the monthly options data, the 26,000 strike holds the maximum Call open interest (with 1.43 crore contracts). This level can act as a key resistance for the Nifty in the short term. It was followed by the 25,000 strike (1.04 crore contracts), and the 25,500 strike (64.53 lakh contracts).
Maximum Call writing was observed at the 25,000 strike, which saw an addition of 26.75 lakh contracts, followed by the 25,100 and 25,600 strikes, which added 13.92 lakh and 13.54 lakh contracts, respectively. The maximum Call unwinding was seen at the 24,900 strike, which shed 15.47 lakh contracts, followed by the 24,800 and 25,500 strikes, which shed 13.45 lakh and 6.24 lakh contracts, respectively.

On the Put side, the maximum Put open interest was seen at the 24,500 strike (with 99.35 lakh contracts), which can act as a key support level for the Nifty. It was followed by the 25,000 strike (84.3 lakh contracts) and the 24,200 strike (59.62 lakh contracts).
The maximum Put writing was placed at the 25,000 strike, which saw an addition of 43.25 lakh contracts, followed by the 25,050 and 24,950 strikes, which added 12.88 lakh and 12.12 lakh contracts, respectively. The Put unwinding was seen at the 24,150 strike, which shed 1.64 lakh contracts, followed by the 24,350 and 25,500 strikes which shed 51,750 and 22,575 contracts, respectively.

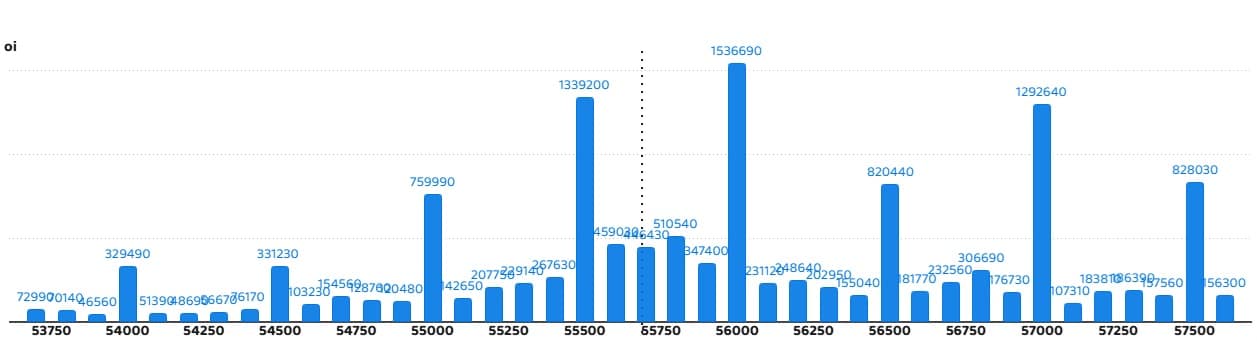
5) Bank Nifty Call Options Data
According to the monthly options data, the 56,000 strike holds the maximum Call open interest, with 15.36 lakh contracts. This can act as a key resistance level for the index in the short term. It was followed by the 55,500 strike (13.39 lakh contracts) and the 57,000 strike (12.92 lakh contracts).
Maximum Call writing was visible at the 56,000 strike (with the addition of 2.7 lakh contracts), followed by the 57,000 strike (2.11 lakh contracts), and the 55,800 strike (2.04 lakh contracts). The maximum Call unwinding was seen at the 57,500 strike, which shed 1.61 lakh contracts, followed by the 55,300 and 55,400 strikes, which shed 1.59 lakh and 1.58 lakh contracts, respectively.
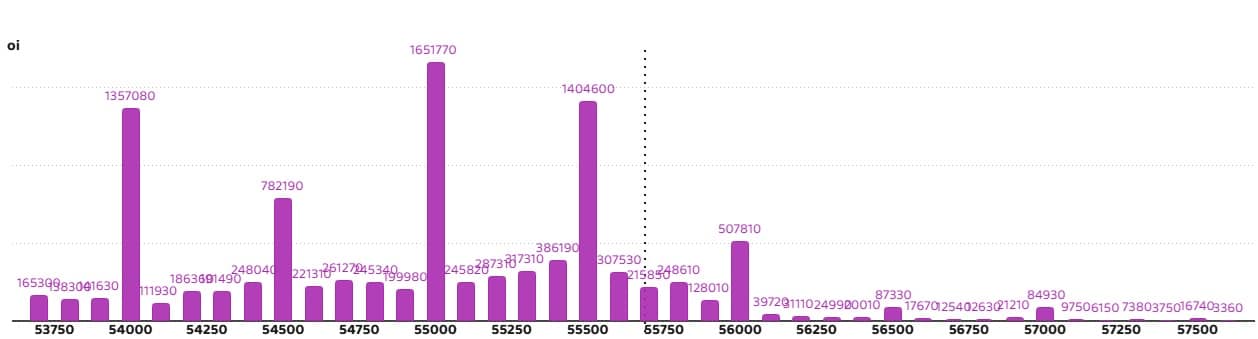
6) Bank Nifty Put Options Data
On the Put side, the maximum Put open interest was seen at the 55,000 strike (with 16.51 lakh contracts), which can act as a key support level for the index. This was followed by the 55,500 strike (14.04 lakh contracts) and the 54,000 strike (13.57 lakh contracts).
The maximum Put writing was observed at the 55,500 strike (which added 4.28 lakh contracts), followed by the 55,800 strike (1.72 lakh contracts) and the 55,600 strike (1.69 lakh contracts). The maximum Put unwinding was seen at the 54,000 strike, which shed 71,700 contracts, followed by the 55,100 and 55,000 strikes, which shed 69,870 and 50,910 contracts, respectively.

The Nifty Put-Call ratio (PCR), which indicates the mood of the market, fell to 1.06 on May 26, from 1.09 in the previous session.
The increasing PCR, or being higher than 0.7 or surpassing 1, means traders are selling more Put options than Call options, which generally indicates the firming up of a bullish sentiment in the market. If the ratio falls below 0.7 or moves towards 0.5, then it indicates selling in Calls is higher than selling in Puts, reflecting a bearish mood in the market.

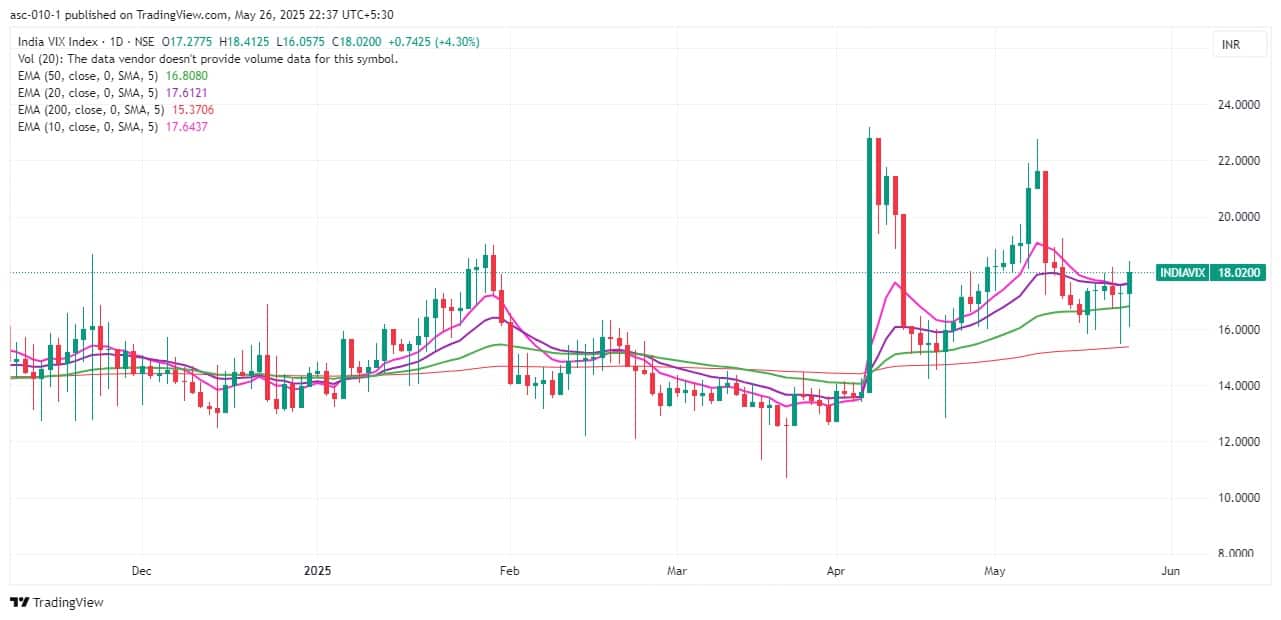
9) India VIX
The India VIX, the fear gauge, spiked to its highest level in the past two weeks, rising 4.3 percent to the 18.02 zone, signaling caution for bulls.
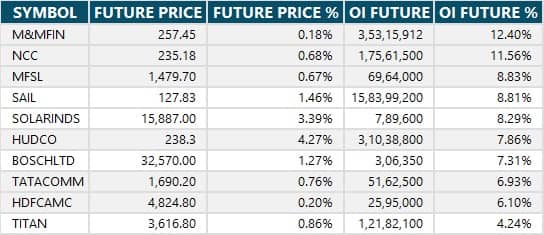
A long build-up was seen in 75 stocks. An increase in open interest (OI) and price indicates a build-up of long positions.
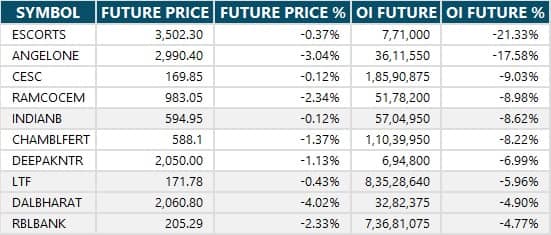
11) Long Unwinding (33 Stocks)
33 stocks saw a decline in open interest (OI) along with a fall in price, indicating long unwinding.
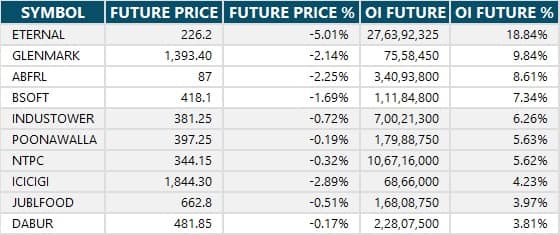
12) Short Build-up (30 Stocks)
30 stocks saw an increase in OI along with a fall in price, indicating a build-up of short positions.
13) Short-Covering (82 Stocks)
82 stocks saw short-covering, meaning a decrease in OI, along with a price increase.

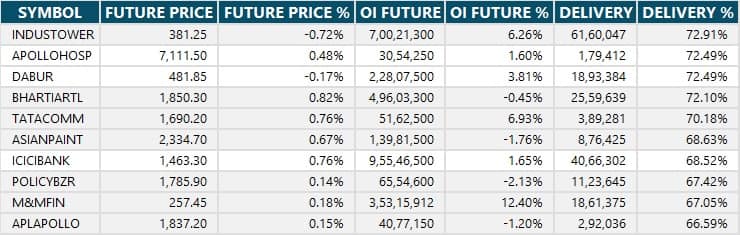
Here are the stocks that saw a high share of delivery trades. A high share of delivery reflects investing (as opposed to trading) interest in a stock.
Securities banned under the F&O segment include companies where derivative contracts cross 95 percent of the market-wide position limit.
Stocks added to F&O ban: Nil
Stocks retained in F&O ban: Chambal Fertilisers and Chemicals, Hindustan Copper, Manappuram Finance, RBL Bank, Titagarh Rail Systems
Stocks removed from F&O ban: Dixon Technologies
Disclaimer: The views and investment tips expressed by experts on Moneycontrol are their own and not those of the website or its management. Moneycontrol advises users to check with certified experts before taking any investment decisions.Disclosure: Moneycontrol is a part of the Network18 group. Network18 is controlled by Independent Media Trust, of which Reliance Industries is the sole beneficiary.Discover the latest Business News, Sensex, and Nifty updates. Obtain Personal Finance insights, tax queries, and expert opinions on Moneycontrol or download the Moneycontrol App to stay updated!
Find the best of Al News in one place, specially curated for you every weekend.
Stay on top of the latest tech trends and biggest startup news.


