


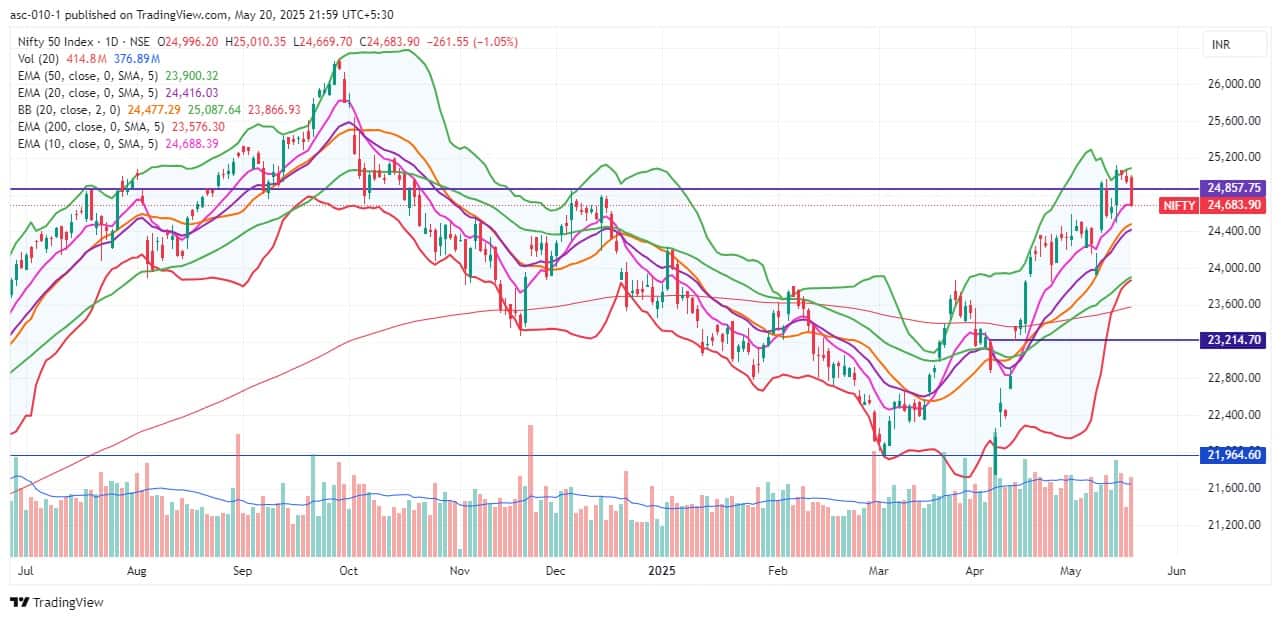
The Nifty 50 extended its southward journey for the third consecutive session, falling a little more than 1 percent on May 20 due to profit-taking, indicating some weakness. This move was still in line with expectations, especially after a more than 4 percent rally last week. However, the overall trend remains in favour of the bulls. Unless and until the index decisively breaks below last Thursday’s low of 24,500, it may continue to trade in a range. With 24,500 acting as immediate support, the index may attempt to rebound toward the 25,000 zone. However, a fall below and sustained trading under 24,500 could drive the index down toward the next key support at 24,380, which corresponds to the upper band of the gap-up from May 12, according to experts.
Here are 15 data points we have collated to help you spot profitable trades:
1) Key Levels For The Nifty 50 (24,684)
Resistance based on pivot points: 24,918, 24,998, and 25,129
Support based on pivot points: 24,658, 24,577, and 24,447
Special Formation: The Nifty 50 formed a long bearish candlestick pattern on the daily charts with above-average volumes, signaling weakness. The index closed near its 10-day EMA, while still sustaining well above the 20- and 50-day EMAs. The Relative Strength Index (RSI) stood at 57.97, showing a negative crossover, though it remained above the neutral 50 mark. The MACD (Moving Average Convergence Divergence) is on the verge of a negative crossover, but continues to stay well above the zero line.
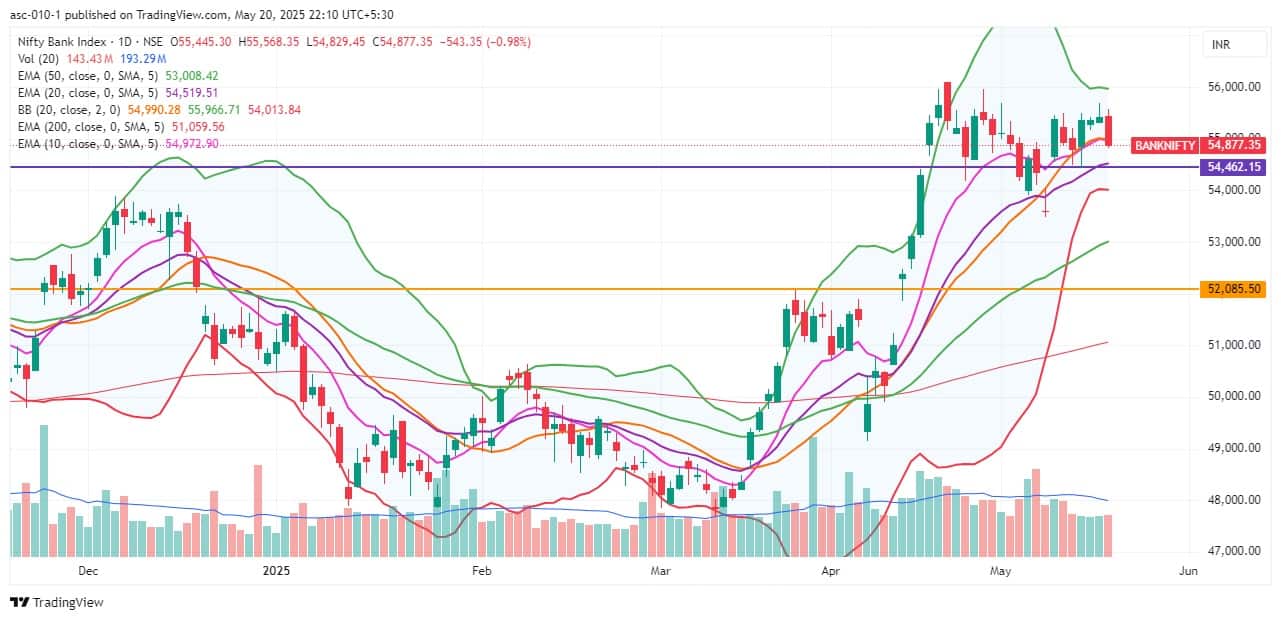
2) Key Levels For The Bank Nifty (54,877)
Resistance based on pivot points: 55,374, 55,548, and 55,831
Support based on pivot points: 54,809, 54,635, and 54,353
Resistance based on Fibonacci retracement: 56,288, 58,626
Support based on Fibonacci retracement: 54,134, 52,912
Special Formation: The Bank Nifty dropped 1 percent and also formed a bearish candle on the daily timeframe. The index fell below the midline of the Bollinger Bands and also below its 10-day EMA. However, the volume has remained well below average for more than a week now, suggesting a lack of aggressive selling pressure. The RSI remains above the neutral zone at 56.32, although it too saw a negative crossover. The MACD witnessed a negative crossover, but still holds above the zero line, implying that broader momentum has not turned fully bearish.
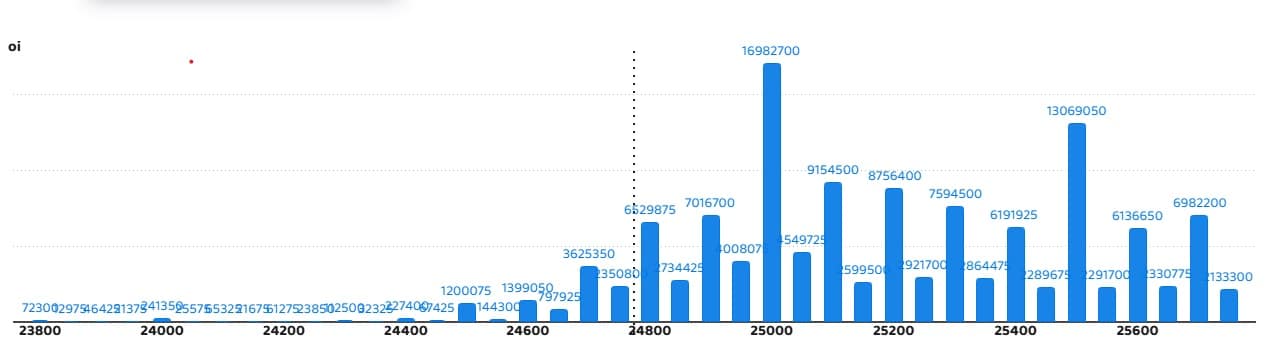
According to the weekly options data, the 25,000 strike holds the maximum Call open interest (with 1.69 crore contracts). This level can act as a key resistance for the Nifty in the short term. It was followed by the 25,500 strike (1.3 crore contracts), and the 25,100 strike (91.5 lakh contracts).
Maximum Call writing was observed at the 25,000 strike, which saw an addition of 58.91 lakh contracts, followed by the 24,800 and 24,900 strikes, which added 46.97 lakh and 45.56 lakh contracts, respectively. The maximum Call unwinding was seen at the 24,000 strike, which shed 31,350 contracts, followed by the 24,300 and 23,900 strikes, which shed 17,400 and 9,150 contracts, respectively.
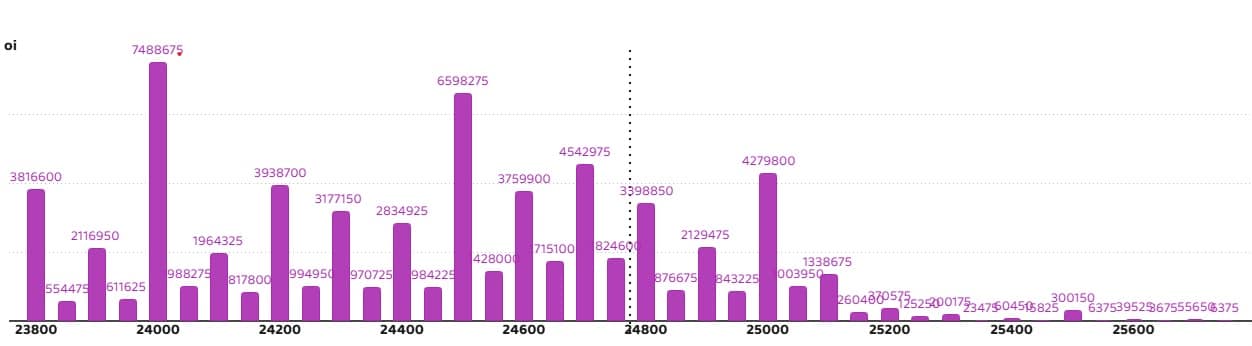
On the Put side, the maximum Put open interest was seen at the 24,000 strike (with 74.88 lakh contracts), which can act as a key support level for the Nifty. It was followed by the 24,500 strike (65.98 lakh contracts) and the 24,700 strike (45.42 lakh contracts).
The maximum Put writing was placed at the 24,300 strike, which saw an addition of 12.62 lakh contracts, followed by the 24,500 and 24,000 strikes, which added 11.27 lakh and 9.96 lakh contracts, respectively. The Put unwinding was seen at the 25,000 strike, which shed 21.5 lakh contracts, followed by the 24,900 and 24,950 strikes which shed 10.17 lakh and 6.88 lakh contracts, respectively.
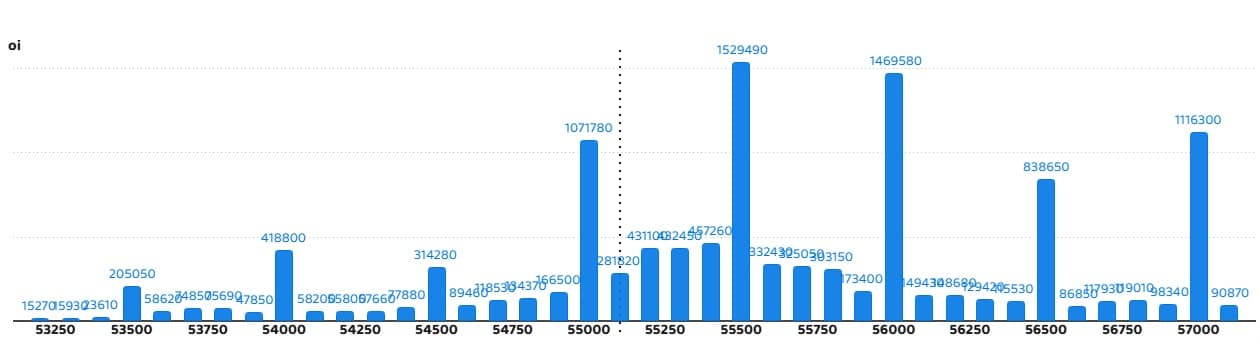
5) Bank Nifty Call Options Data
According to the monthly options data, the 55,500 strike holds the maximum Call open interest, with 15.29 lakh contracts. This can act as a key resistance level for the index in the short term. It was followed by the 56,000 strike (14.69 lakh contracts) and the 57,000 strike (11.16 lakh contracts).
Maximum Call writing was visible at the 55,500 strike (with the addition of 2.49 lakh contracts), followed by the 55,000 strike (2.34 lakh contracts), and the 56,000 strike (2.16 lakh contracts). The maximum Call unwinding was seen at the 53,500 strike, which shed 9,540 contracts, followed by the 56,100 and 55,600 strikes, which shed 5,520 and 5,040 contracts, respectively.
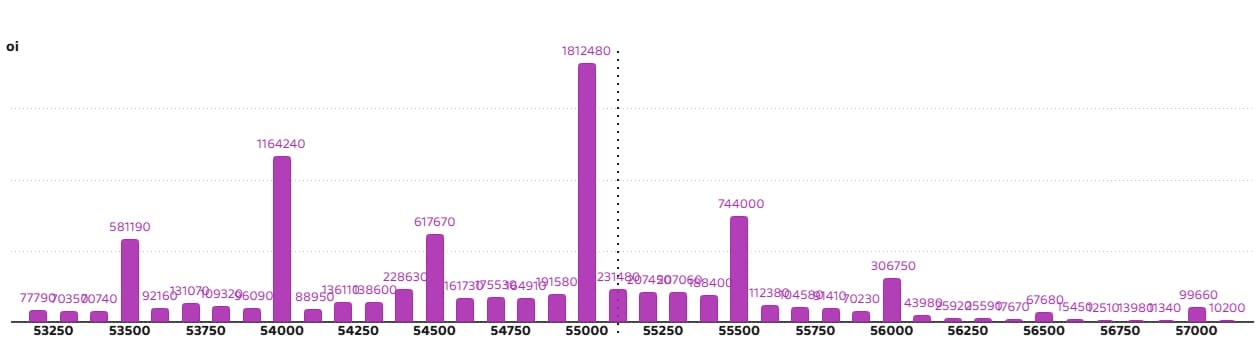
6) Bank Nifty Put Options Data
On the Put side, the maximum Put open interest was seen at the 55,000 strike (with 18.12 lakh contracts), which can act as a key level for the index. This was followed by the 54,000 strike (11.64 lakh contracts) and the 55,500 strike (7.44 lakh contracts).
The maximum Put writing was observed at the 55,100 strike (which added 62,340 contracts), followed by the 54,900 strike (51,540 contracts) and the 54,500 strike (38,670 contracts). The maximum Put unwinding was seen at the 55,000 strike, which shed 2.13 lakh contracts, followed by the 55,500 and 55,400 strikes, which shed 1.19 lakh and 1.17 lakh contracts, respectively.
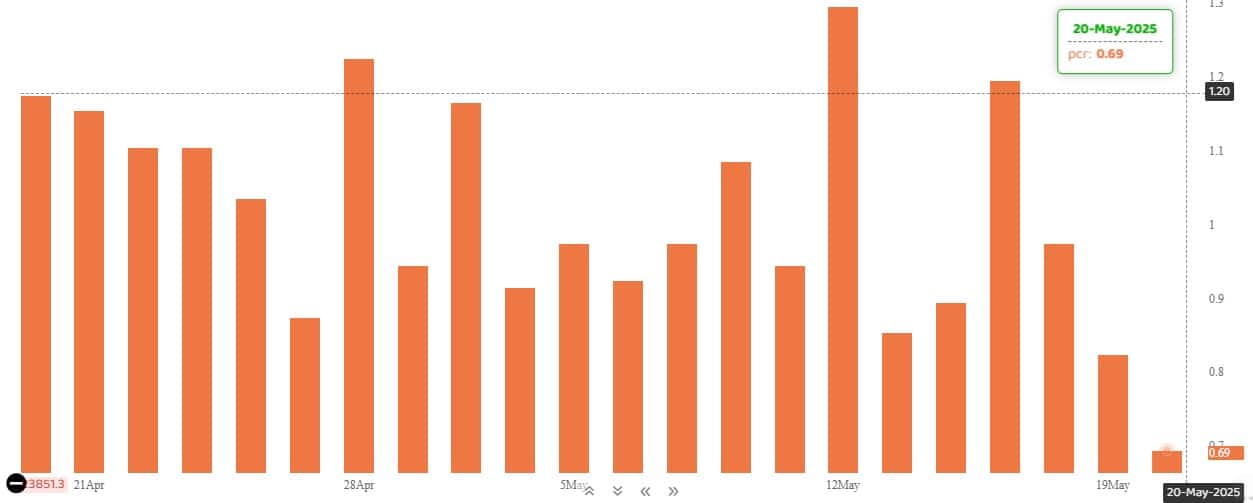
The Nifty Put-Call ratio (PCR), which indicates the mood of the market, dropped further to 0.69 on May 20 (the level last seen on February 11), from 0.82 in the previous session.
The increasing PCR, or being higher than 0.7 or surpassing 1, means traders are selling more Put options than Call options, which generally indicates the firming up of a bullish sentiment in the market. If the ratio falls below 0.7 or moves towards 0.5, then it indicates selling in Calls is higher than selling in Puts, reflecting a bearish mood in the market.
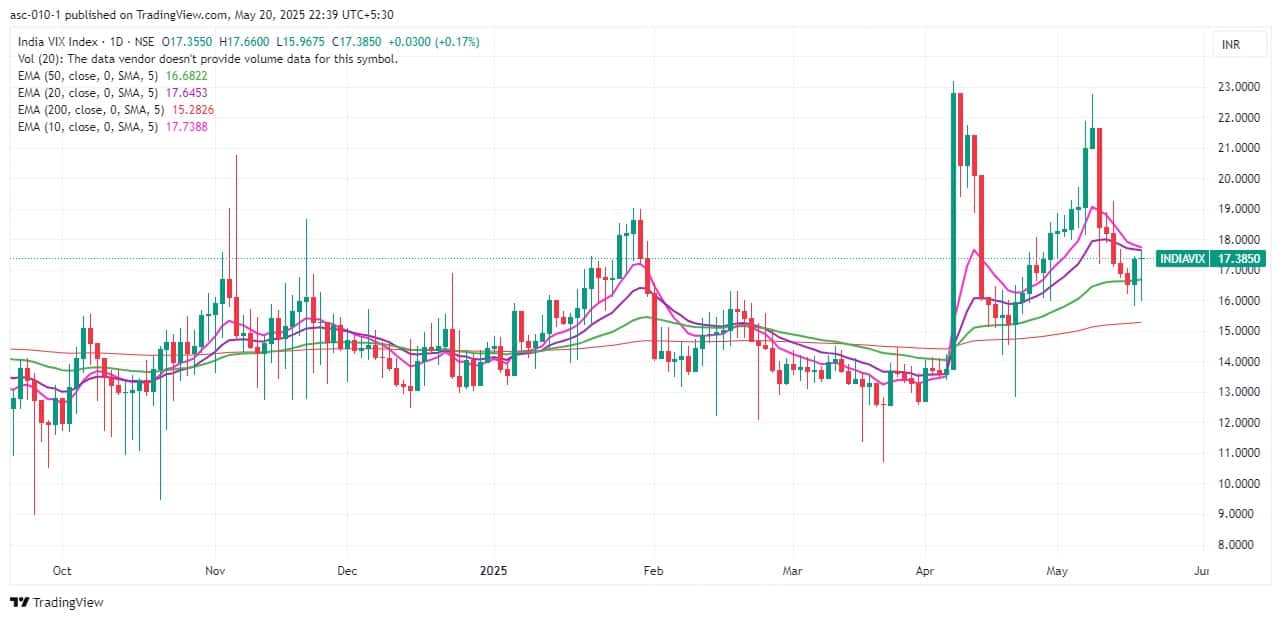
9) India VIX
The India VIX, which measures expected market volatility, remained elevated, staying above the 17 mark. It rose 0.17 percent to 17.39, continuing to signal caution for the bulls.
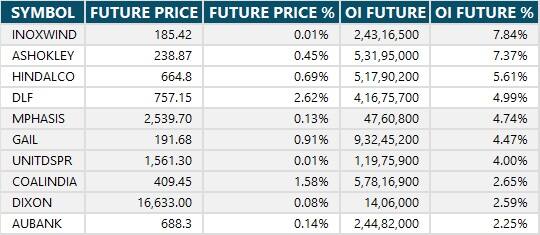
A long build-up was seen in 17 stocks. An increase in open interest (OI) and price indicates a build-up of long positions.
11) Long Unwinding (81 Stocks)
81 stocks saw a decline in open interest (OI) along with a fall in price, indicating long unwinding.

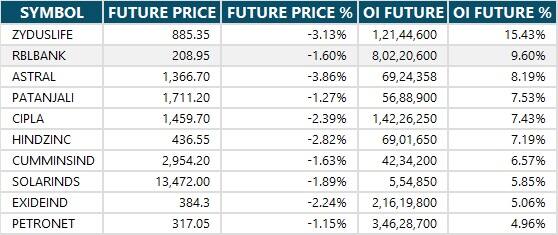
12) Short Build-up (116 Stocks)
116 stocks saw an increase in OI along with a fall in price, indicating a build-up of short positions.
7 stocks saw short-covering, meaning a decrease in OI, along with a price increase.

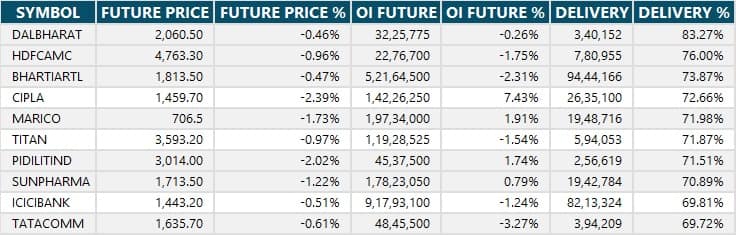
Here are the stocks that saw a high share of delivery trades. A high share of delivery reflects investing (as opposed to trading) interest in a stock.
Securities banned under the F&O segment include companies where derivative contracts cross 95 percent of the market-wide position limit.
Stocks added to F&O ban: RBL Bank
Stocks retained in F&O ban: Manappuram Finance
Stocks removed from F&O ban: Hindustan Copper, Titagarh Rail Systems
Disclaimer: The views and investment tips expressed by experts on Moneycontrol are their own and not those of the website or its management. Moneycontrol advises users to check with certified experts before taking any investment decisions.Disclosure: Moneycontrol is a part of the Network18 group. Network18 is controlled by Independent Media Trust, of which Reliance Industries is the sole beneficiary.Discover the latest Business News, Sensex, and Nifty updates. Obtain Personal Finance insights, tax queries, and expert opinions on Moneycontrol or download the Moneycontrol App to stay updated!
Find the best of Al News in one place, specially curated for you every weekend.
Stay on top of the latest tech trends and biggest startup news.


