


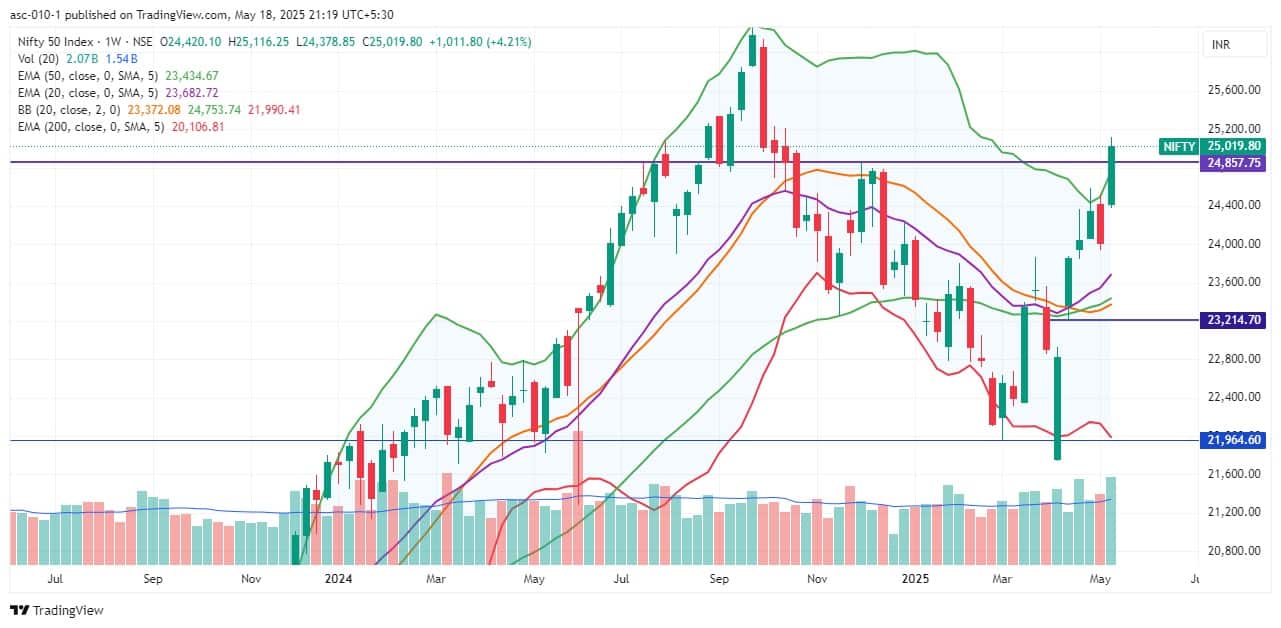
The Nifty 50 sustained near the upper line of the Bollinger Bands despite some consolidation and closed flat with moderate losses on May 16, firmly holding above the 25,000 mark. The index recorded a more than 4 percent rally for the week, forming a strong bullish candle and showing an expansion in the Bollinger Bands, indicating healthy momentum. Hence, as long as the index defends the 24,850–24,800 zone (the support area), the bullish bias may push it toward the 25,200–25,300 zone in the short term, followed by 25,500–25,700, which represents a crucial hurdle before reaching the record high, experts said.
Here are 15 data points we have collated to help you spot profitable trades:
1) Key Levels For The Nifty 50 (25,020)
Resistance based on pivot points: 25,059, 25,087, and 25,131
Support based on pivot points: 24,970, 24,942, and 24,897
Special Formation: The Nifty 50 remained rangebound and formed a small bearish candle with a lower shadow on the daily charts, closing near the upper line of the Bollinger Bands. The higher highs-higher lows formation continued, with the index trading well above all key moving averages (20-day, 50-day, and 200-day EMAs). On the weekly charts, the index formed a long bullish candle with above-average volumes, showing an expansion in the Bollinger Bands and trading above the upper line, signaling a healthy trend.
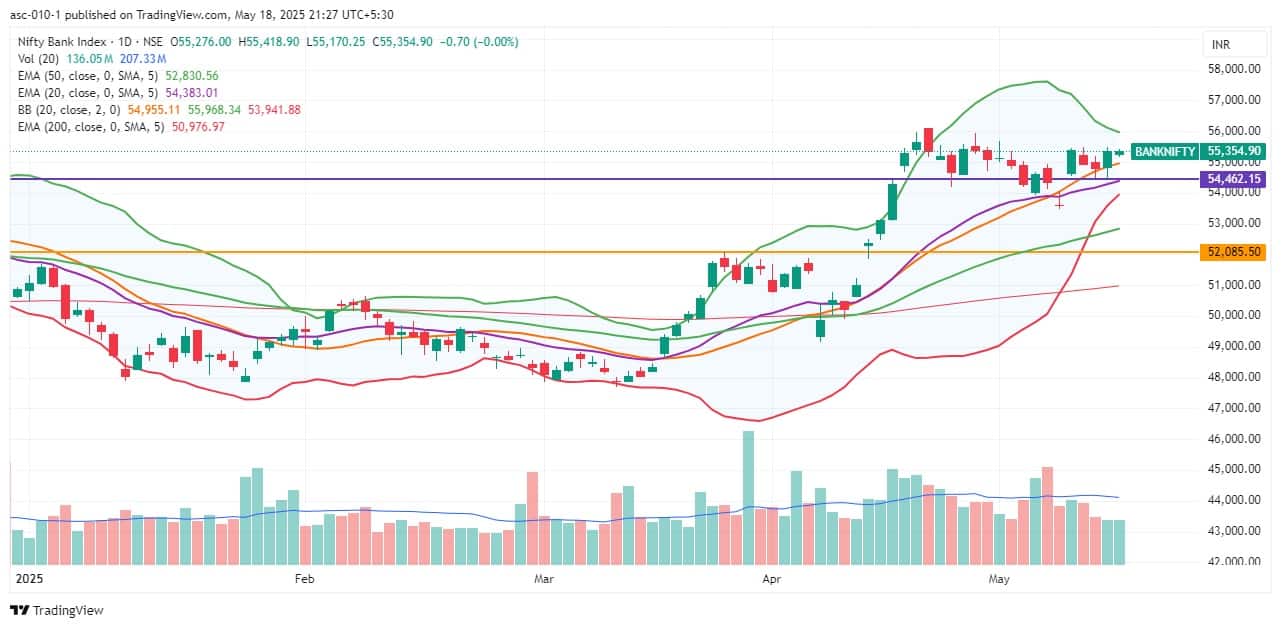
2) Key Levels For The Bank Nifty (55,355)
Resistance based on pivot points: 55,410, 55,468, and 55,563
Support based on pivot points: 55,220, 55,161, and 55,066
Resistance based on Fibonacci retracement: 56,327, 58,676
Support based on Fibonacci retracement: 54,137, 52,900
Special Formation: The Bank Nifty closed flat and formed a small bullish candle on the daily timeframe, signaling range-bound trading while facing a strong hurdle at 55,500 and holding well above the midline of the Bollinger Bands. The consolidation over the last five days is likely to lead to a breakout on the higher side, as the trend is still in favour of the bulls. Even on the weekly timeframe, the banking benchmark index traded near the upper line of the Bollinger Bands, with an expansion in the bands. Additionally, the index traded far above the key moving averages, reinforcing the positive trend.
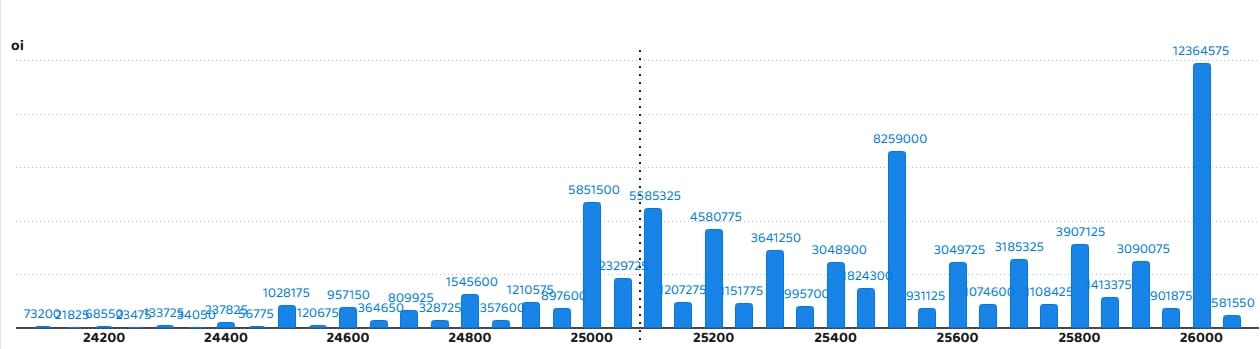
According to the weekly options data, the 26,000 strike holds the maximum Call open interest (with 1.23 crore contracts). This level can act as a key resistance for the Nifty in the short term. It was followed by the 25,500 strike (82.59 lakh contracts), and the 25,000 strike (58.51 lakh contracts).
Maximum Call writing was observed at the 25,500 strike, which saw an addition of 37.94 lakh contracts, followed by the 26,000 and 25,100 strikes, which added 35.09 lakh and 27.08 lakh contracts, respectively. The maximum Call unwinding was seen at the 24,600 strike, which shed 1.62 lakh contracts, followed by the 24,500 and 24,700 strikes, which shed 1.1 lakh and 78,750 contracts, respectively.
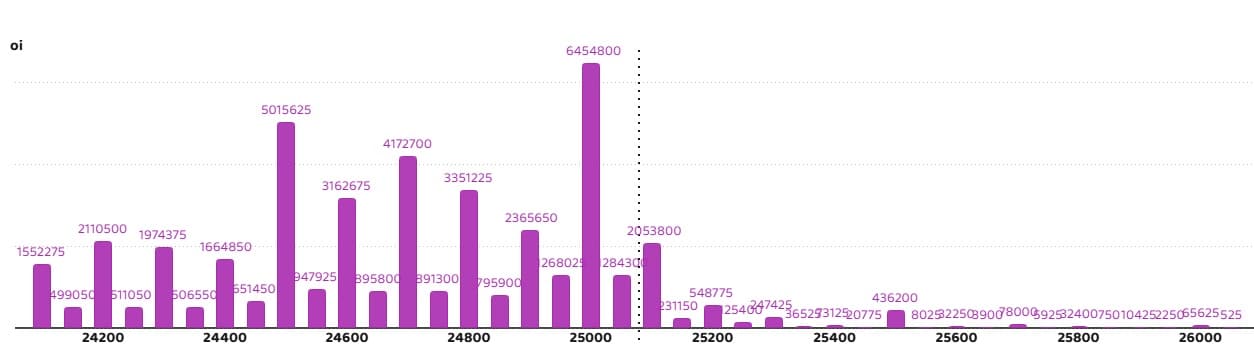
On the Put side, the maximum Put open interest was seen at the 25,000 strike (with 64.54 lakh contracts), which can act as a key support level for the Nifty. It was followed by the 24,500 strike (50.15 lakh contracts) and the 24,700 strike (41.72 lakh contracts).
The maximum Put writing was placed at the 25,000 strike, which saw an addition of 24.56 lakh contracts, followed by the 24,700 and 24,950 strikes, which added 16.86 lakh and 8.54 lakh contracts, respectively. The Put unwinding was seen at the 24,400 strike, which shed 2.85 lakh contracts, followed by the 24,350 and 26,000 strikes which shed 5,175 and 2,550 contracts, respectively.
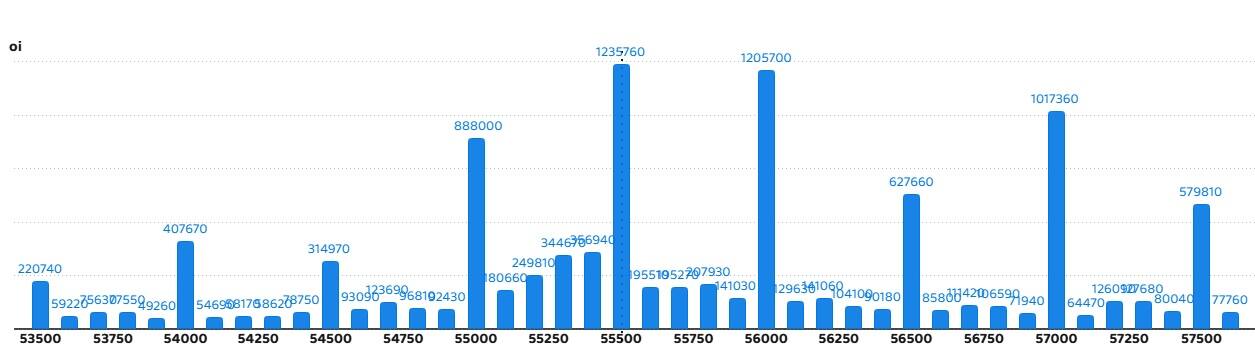
5) Bank Nifty Call Options Data
According to the monthly options data, the 55,500 strike holds the maximum Call open interest, with 12.35 lakh contracts. This can act as a key resistance level for the index in the short term. It was followed by the 56,000 strike (12.05 lakh contracts) and the 57,000 strike (10.17 lakh contracts).
Maximum Call writing was visible at the 55,500 strike (with the addition of 71,970 contracts), followed by the 56,500 strike (60,360 contracts), and the 56,000 strike (31,080 contracts). The maximum Call unwinding was seen at the 55,000 strike, which shed 43,260 contracts, followed by the 54,800 and 54,000 strikes, which shed 23,940 and 19,260 contracts, respectively.
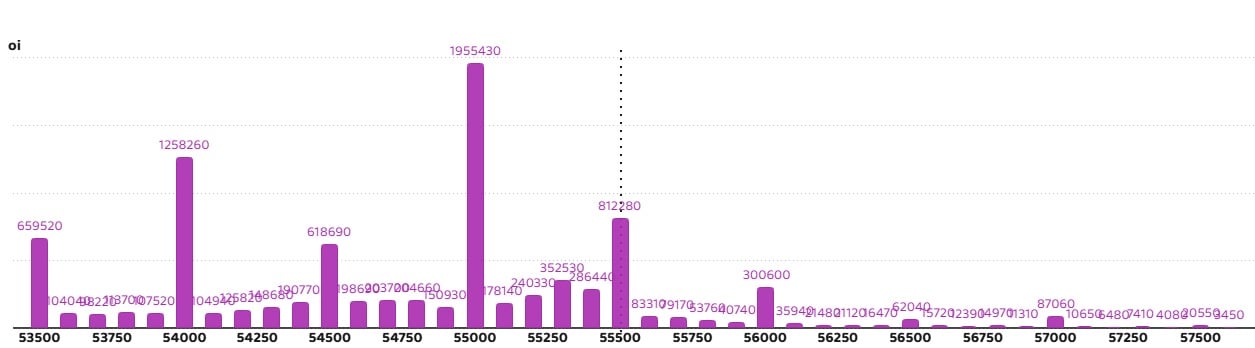
6) Bank Nifty Put Options Data
On the Put side, the maximum Put open interest was seen at the 55,000 strike (with 19.55 lakh contracts), which can act as a key support level for the index. This was followed by the 54,000 strike (12.58 lakh contracts) and the 55,500 strike (8.12 lakh contracts).
The maximum Put writing was observed at the 55,300 strike (which added 80,940 contracts), followed by the 55,500 strike (58,080 contracts) and the 55,000 strike (53,040 contracts). The maximum Put unwinding was seen at the 54,600 strike, which shed 75,300 contracts, followed by the 54,700 and 53,600 strikes, which shed 24,810 and 16,860 contracts, respectively.
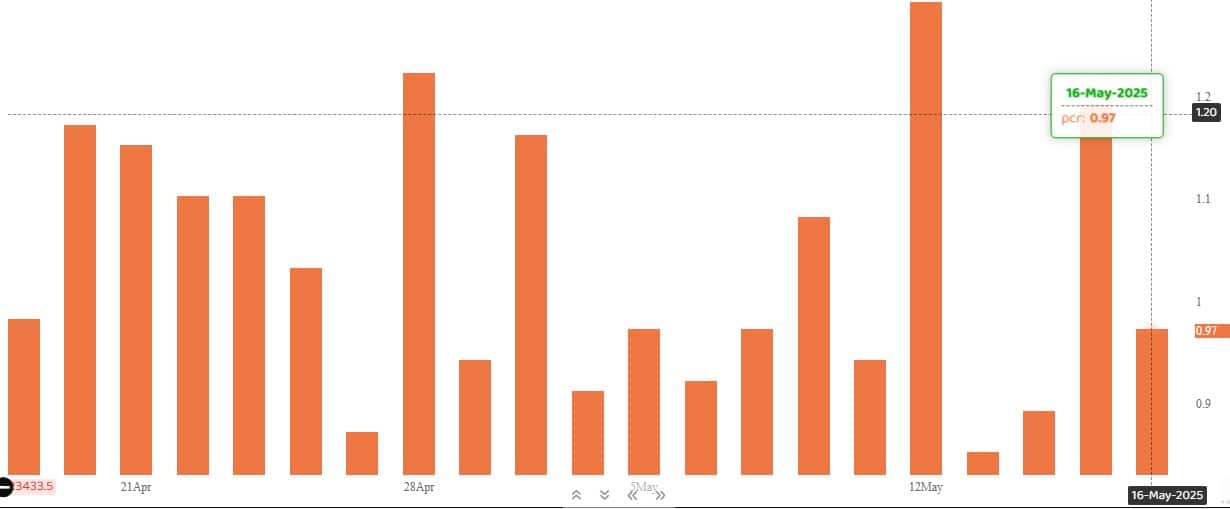
The Nifty Put-Call ratio (PCR), which indicates the mood of the market, dropped to 0.97 on May 16, from 1.19 in the previous session.
The increasing PCR, or being higher than 0.7 or surpassing 1, means traders are selling more Put options than Call options, which generally indicates the firming up of a bullish sentiment in the market. If the ratio falls below 0.7 or moves towards 0.5, then it indicates selling in Calls is higher than selling in Puts, reflecting a bearish mood in the market.
9) India VIX
The India VIX, the fear index that measures expected market volatility, continued its southward journey throughout the week, falling 2.03 percent on Friday to the 16.55 zone and losing 23.49 percent for the week, which helped keep the bulls in a comfortable zone.

A long build-up was seen in 91 stocks. An increase in open interest (OI) and price indicates a build-up of long positions.

11) Long Unwinding (24 Stocks)
24 stocks saw a decline in open interest (OI) along with a fall in price, indicating long unwinding.

12) Short Build-up (38 Stocks)
38 stocks saw an increase in OI along with a fall in price, indicating a build-up of short positions.

13) Short-Covering (64 Stocks)
64 stocks saw short-covering, meaning a decrease in OI, along with a price increase.

Here are the stocks that saw a high share of delivery trades. A high share of delivery reflects investing (as opposed to trading) interest in a stock.

Securities banned under the F&O segment include companies where derivative contracts cross 95 percent of the market-wide position limit.
Stocks added to F&O ban: Titagarh Rail Systems
Stocks retained in F&O ban: Hindustan Copper, Manappuram Finance
Stocks removed from F&O ban: Central Depository Services
Disclaimer: The views and investment tips expressed by experts on Moneycontrol are their own and not those of the website or its management. Moneycontrol advises users to check with certified experts before taking any investment decisions.Disclosure: Moneycontrol is a part of the Network18 group. Network18 is controlled by Independent Media Trust, of which Reliance Industries is the sole beneficiary.Discover the latest Business News, Sensex, and Nifty updates. Obtain Personal Finance insights, tax queries, and expert opinions on Moneycontrol or download the Moneycontrol App to stay updated!
Find the best of Al News in one place, specially curated for you every weekend.
Stay on top of the latest tech trends and biggest startup news.


