


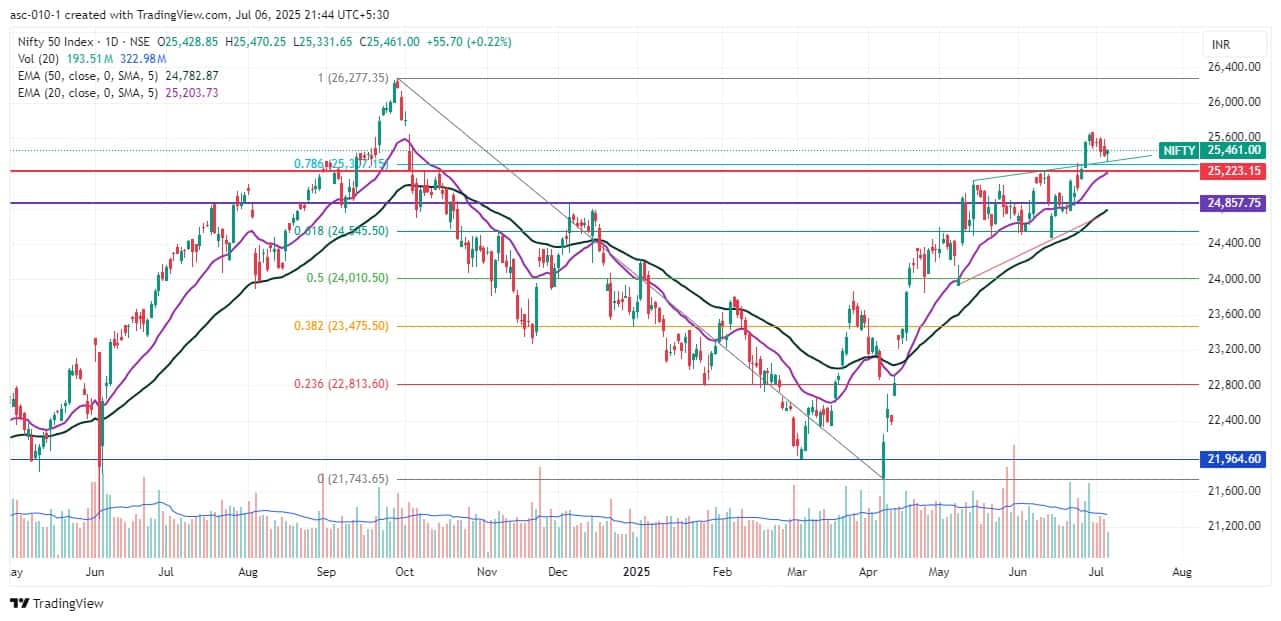
The Nifty 50 snapped a two-day losing streak and recorded gains of 0.2 percent on July 4, driven by buying interest at the support level of 25,300, which coincides with the 78.6 percent Fibonacci retracement (from 26,277 to 21,744). Despite ongoing consolidation, the formation of higher highs and higher lows continued. According to experts, as long as the index holds the 25,300–25,200 zone, an upward move toward 25,700–25,800 remains possible. A sustained move above 26,000 would be crucial for further upside. However, if the index falls below 25,200, a decline toward 25,000 cannot be ruled out.
Here are 15 data points we have collated to help you spot profitable trades:
1) Key Levels For The Nifty 50 (25,461)
Resistance based on pivot points: 25,474, 25,507, and 25,559
Support based on pivot points: 25,368, 25,335, and 25,282
Special Formation: The Nifty 50 formed a small bullish candle with a long lower shadow on the daily chart, indicating buying interest at lower levels while continuing its overall higher tops–higher bottoms formation. The index also remained above short-term moving averages, and the upper Bollinger Bands stayed in expansion mode. The Stochastic RSI stood at 61.01, maintaining a positive crossover. However, the Stochastic RSI (fast line) sustained a negative crossover. The MACD maintained a positive crossover but showed signs of weakening, as the histogram's momentum faded.
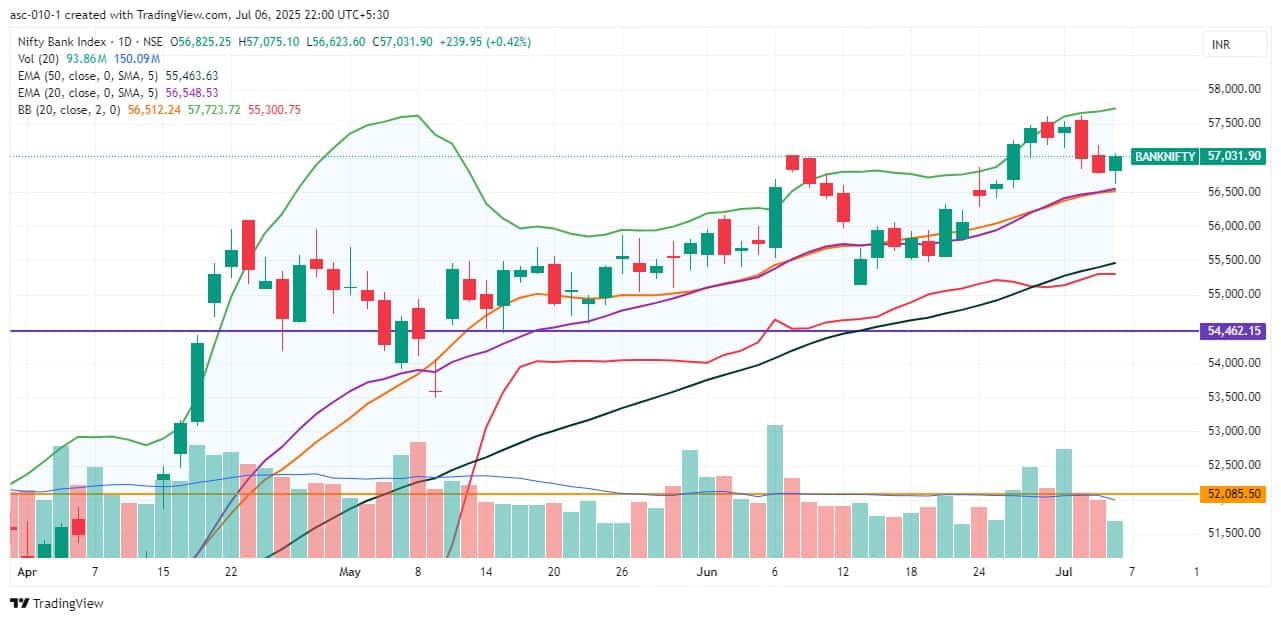
2) Key Levels For The Bank Nifty (57,032)
Resistance based on pivot points: 57,083, 57,189, and 57,362
Support based on pivot points: 56,738, 56,631, and 56,459
Resistance based on Fibonacci retracement: 57,566, 58,224
Support based on Fibonacci retracement: 56,389, 59,096
Special Formation: The Bank Nifty also rebounded after a two-day losing streak, gaining 0.4 percent. It formed a bullish candle with a lower shadow on the daily timeframe, signaling buying interest at lower levels. The index continued its higher highs–higher lows structure despite last week’s consolidation after hitting a record high. It also sustained above all key moving averages, which is seen as a positive sign. The RSI stood at 59.15, on the verge of a positive crossover. The MACD was nearing a negative crossover, with momentum fading in the histogram.
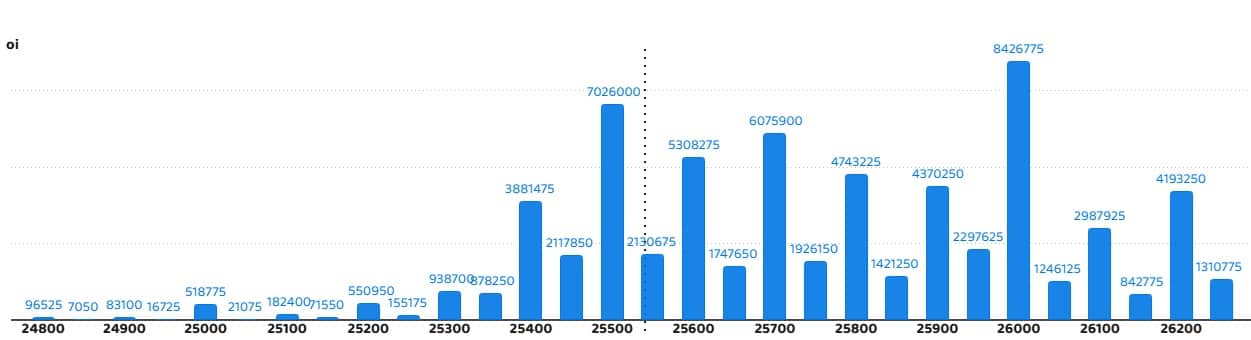
According to the weekly options data, the maximum Call open interest was seen at the 26,000 strike (with 84.26 lakh contracts). This level can act as a key resistance for the Nifty in the short term. It was followed by the 25,500 strike (70.26 lakh contracts), and the 25,700 strike (60.75 lakh contracts).
Maximum Call writing was observed at the 26,000 strike, which saw an addition of 21.99 lakh contracts, followed by the 26,200 and 25,700 strikes, which added 17.22 lakh and 17.11 lakh contracts, respectively. The maximum Call unwinding was seen at the 24,800 strike, which shed 6,825 contracts, followed by the 25,000, and 24,900 strikes, which shed 3,750 and 2,700 contracts, respectively.
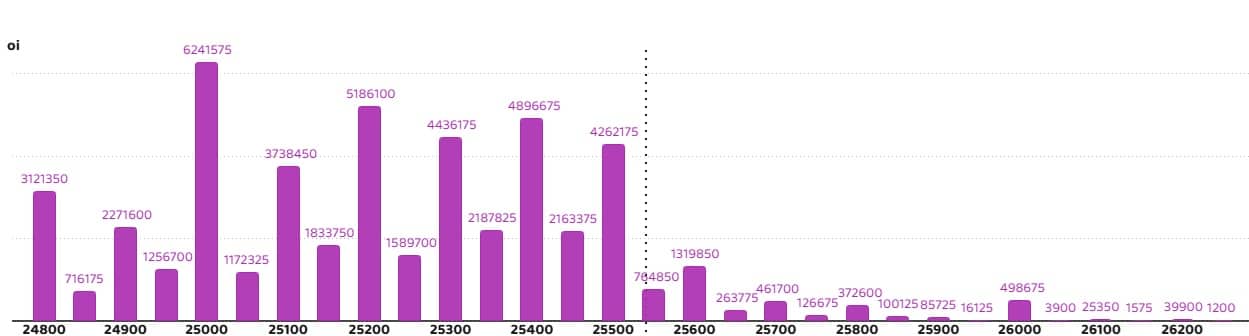
On the Put side, the 25,000 strike holds the maximum Put open interest (with 62.41 lakh contracts), which can act as a key support level for the Nifty. It was followed by the 25,200 strike (51.86 lakh contracts) and the 25,400 strike (48.96 lakh contracts).
The maximum Put writing was placed at the 25,200 strike, which saw an addition of 30.01 lakh contracts, followed by the 25,300 and 25,400 strikes, which added 21.15 lakh and 18.24 lakh contracts, respectively. The maximum Put unwinding was seen at the 25,600 strike, which shed 2.64 lakh contracts, followed by the 25,500 and 25,550 strikes, which shed 2.61 lakh and 1.02 lakh contracts, respectively.
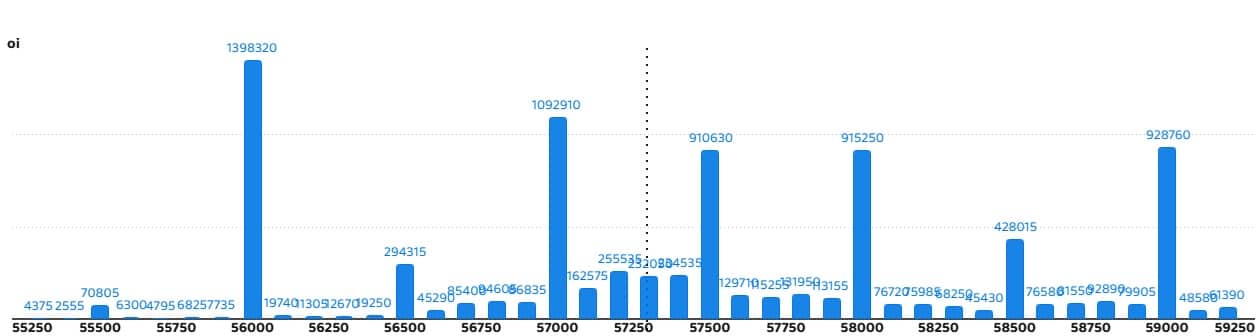
5) Bank Nifty Call Options Data
According to the monthly options data, the 56,000 strike holds the maximum Call open interest, with 13.98 lakh contracts. This can act as a key level for the index in the short term. It was followed by the 57,000 strike (10.92 lakh contracts) and the 59,000 strike (9.28 lakh contracts).
Maximum Call writing was visible at the 57,000 strike (with the addition of 88,095 contracts), followed by the 58,500 strike (59,220 contracts), and the 59,000 strike (44,520 contracts). The maximum Call unwinding was seen at the 57,900 strike, which shed 49,770 contracts, followed by the 58,000 and 57,400 strikes, which shed 37,415 and 26,460 contracts, respectively.
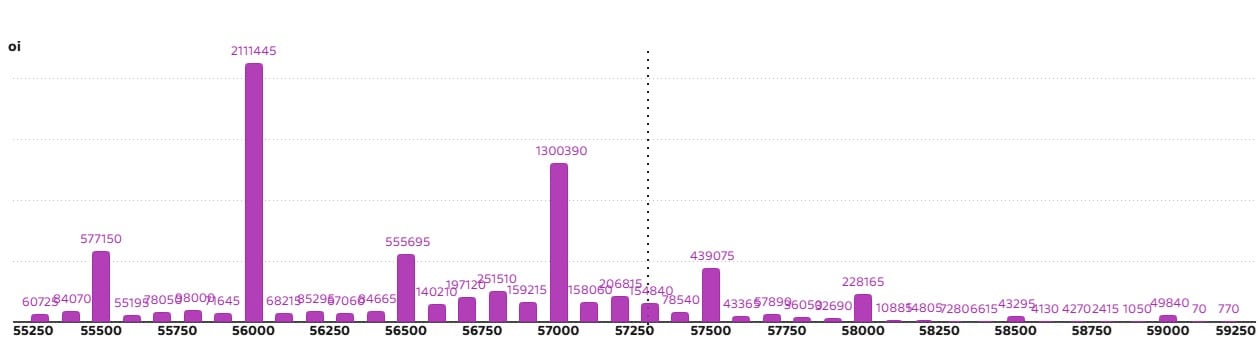
6) Bank Nifty Put Options Data
On the Put side, the maximum Put open interest was placed at the 56,000 strike (with 21.11 lakh contracts), which can act as a key support level for the index. This was followed by the 57,000 strike (13 lakh contracts) and the 55,500 strike (5.77 lakh contracts).
The maximum Put writing was observed at the 57,000 strike (which added 79,905 contracts), followed by the 56,800 strike (55,615 contracts) and the 56,700 strike (52,360 contracts). The maximum Put unwinding was seen at the 57,200 strike, which shed 31,885 contracts, followed by the 57,500 and 56,000 strikes, which shed 23,380 and 16,100 contracts, respectively.
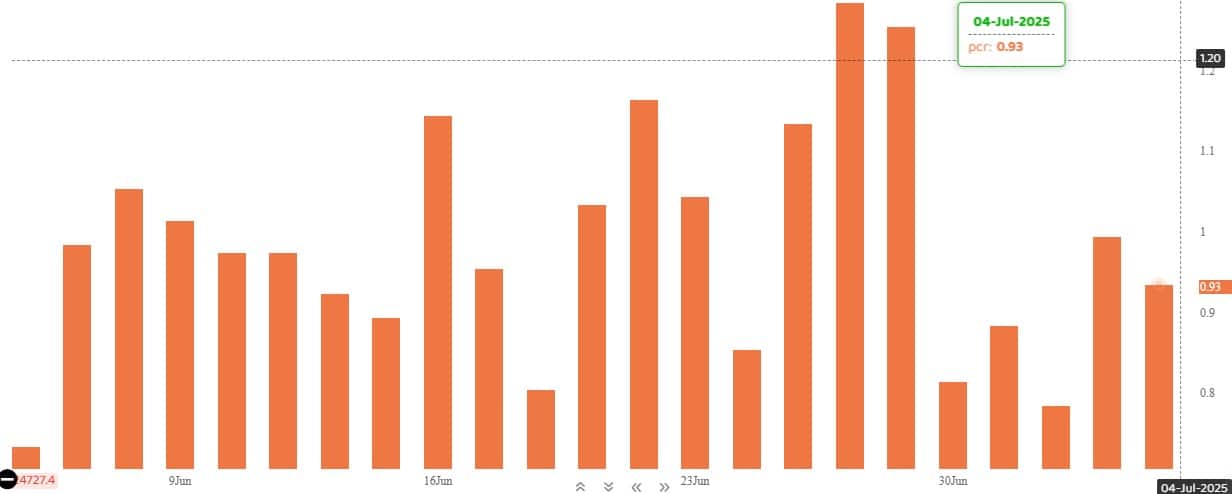
The Nifty Put-Call ratio (PCR), which indicates the mood of the market, dropped to 0.93 on July 4, compared to 0.99 in the previous session.
The increasing PCR, or being higher than 0.7 or surpassing 1, means traders are selling more Put options than Call options, which generally indicates the firming up of a bullish sentiment in the market. If the ratio falls below 0.7 or moves towards 0.5, then it indicates selling in Calls is higher than selling in Puts, reflecting a bearish mood in the market.
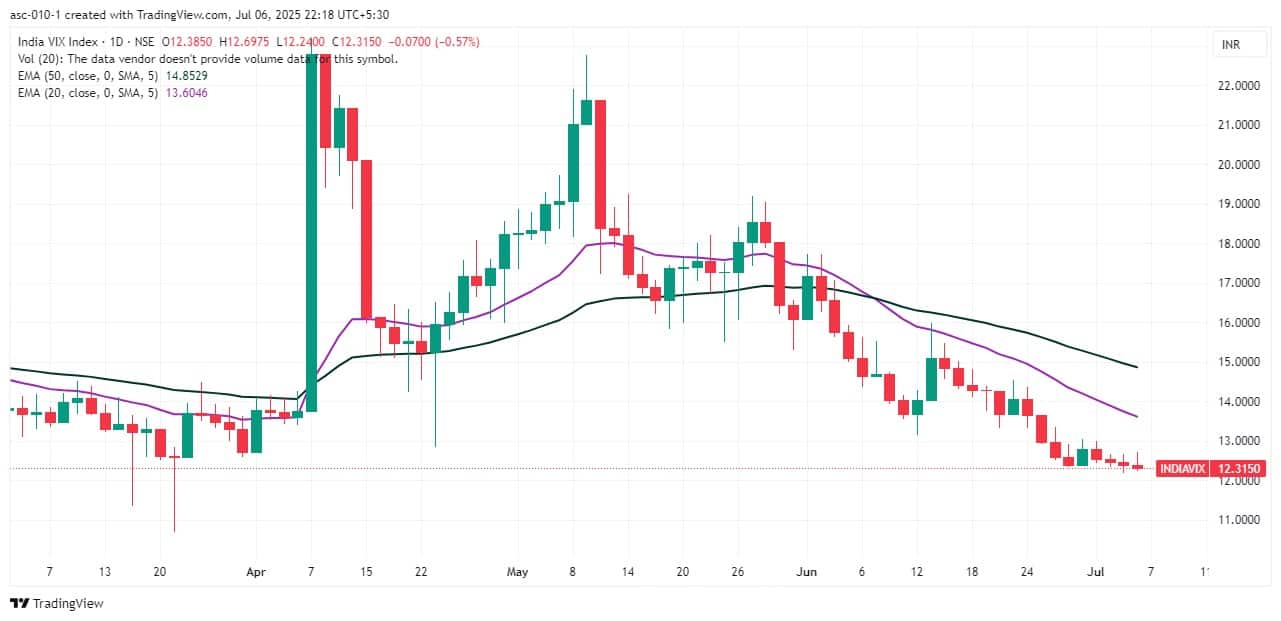
9) India VIX
The India VIX, which measures expected market volatility, declined for the fourth consecutive session and hit a fresh nine-month low, consistently favouring the bulls. It was down 0.57 percent, closing at 12.32 — the lowest level since October 1, 2024.
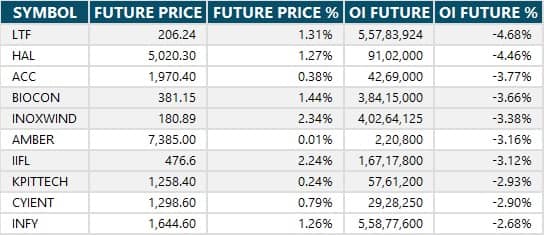
A long build-up was seen in 61 stocks. An increase in open interest (OI) and price indicates a build-up of long positions.
11) Long Unwinding (43 Stocks)
43 stocks saw a decline in open interest (OI) along with a fall in price, indicating long unwinding.
12) Short Build-up (51 Stocks)
51 stocks saw an increase in OI along with a fall in price, indicating a build-up of short positions.
13) Short-Covering (74 Stocks)
74 stocks saw short-covering, meaning a decrease in OI, along with a price increase.
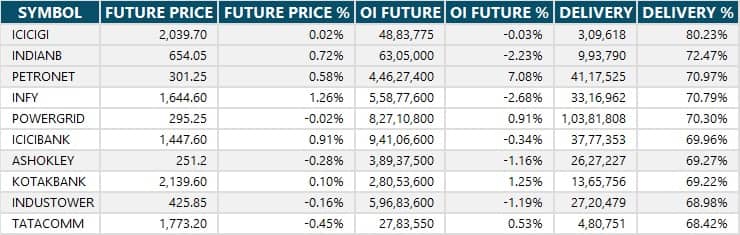
Here are the stocks that saw a high share of delivery trades. A high share of delivery reflects investing (as opposed to trading) interest in a stock.
Securities banned under the F&O segment include companies where derivative contracts cross 95 percent of the market-wide position limit.
Stocks added to F&O ban: Nil
Stocks retained in F&O ban: RBL Bank
Stocks removed from F&O ban: Nil
Disclaimer: The views and investment tips expressed by experts on Moneycontrol are their own and not those of the website or its management. Moneycontrol advises users to check with certified experts before taking any investment decisions.Disclosure: Moneycontrol is a part of the Network18 group. Network18 is controlled by Independent Media Trust, of which Reliance Industries is the sole beneficiary.Discover the latest Business News, Sensex, and Nifty updates. Obtain Personal Finance insights, tax queries, and expert opinions on Moneycontrol or download the Moneycontrol App to stay updated!
Find the best of Al News in one place, specially curated for you every weekend.
Stay on top of the latest tech trends and biggest startup news.


