


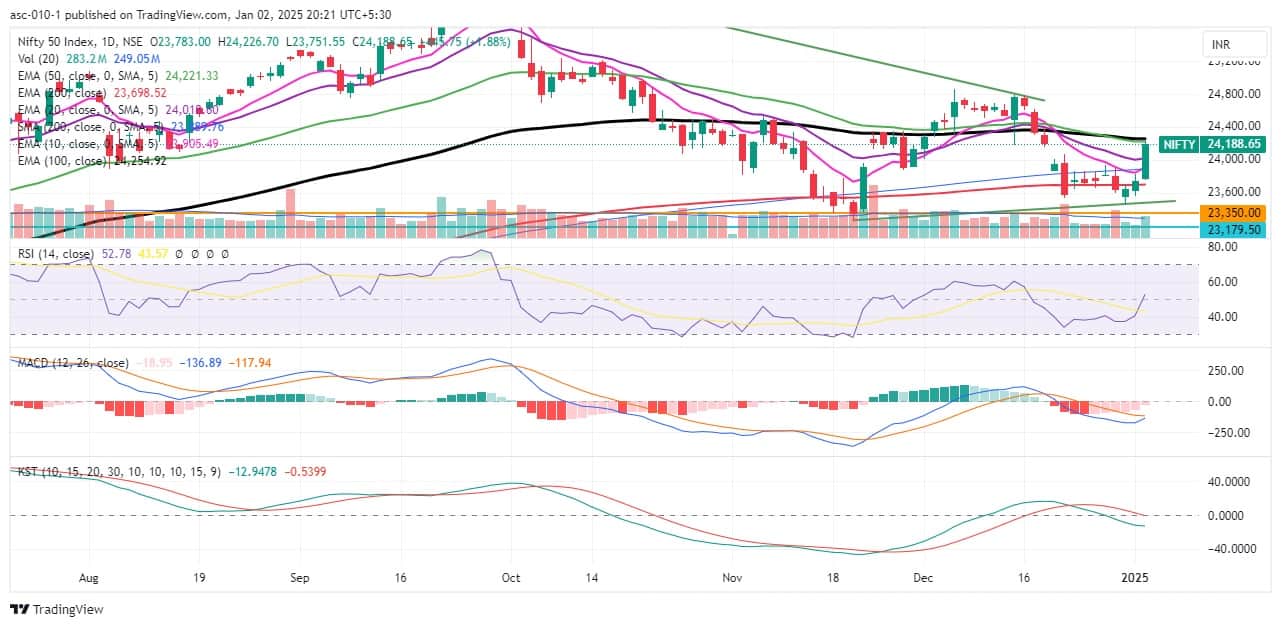
Bulls staged a strong performance on January 2, helping the Nifty 50 surpass the psychological 24,000 mark and record a 446-point gain (the biggest single-day gain in the last six weeks). With the climbing short-term moving averages (10-day and 20-day EMAs) and a rise of 766 points from this week's low, the momentum has definitely strengthened. However, some consolidation can't be ruled out before the index embarks on the next leg of the upmove. The Nifty 50 may face immediate resistance at the 24,200-24,250 zone, followed by targets of 24,400 and 24,850. Immediate support is placed at 24,900, followed by 24,700, experts said.
Here are 15 data points we have collated to help you spot profitable trades:
1) Key Levels For The Nifty 50 (24,189)
Resistance based on pivot points: 24,237, 24,349, and 24,531
Support based on pivot points: 23,874, 23,762, and 23,581
Special Formation: The Nifty 50 has formed a long bullish candlestick pattern on the daily charts, with a higher top-higher bottom formation for the second consecutive session. The index cleared the 10-day and 20-day EMAs after defending the 200-day EMA in the previous session. The momentum indicator, RSI (Relative Strength Index at 52.8), showed a positive crossover and entered the upper band. Additionally, the index closed slightly above the midline of Bollinger Bands, signaling positive sentiment.
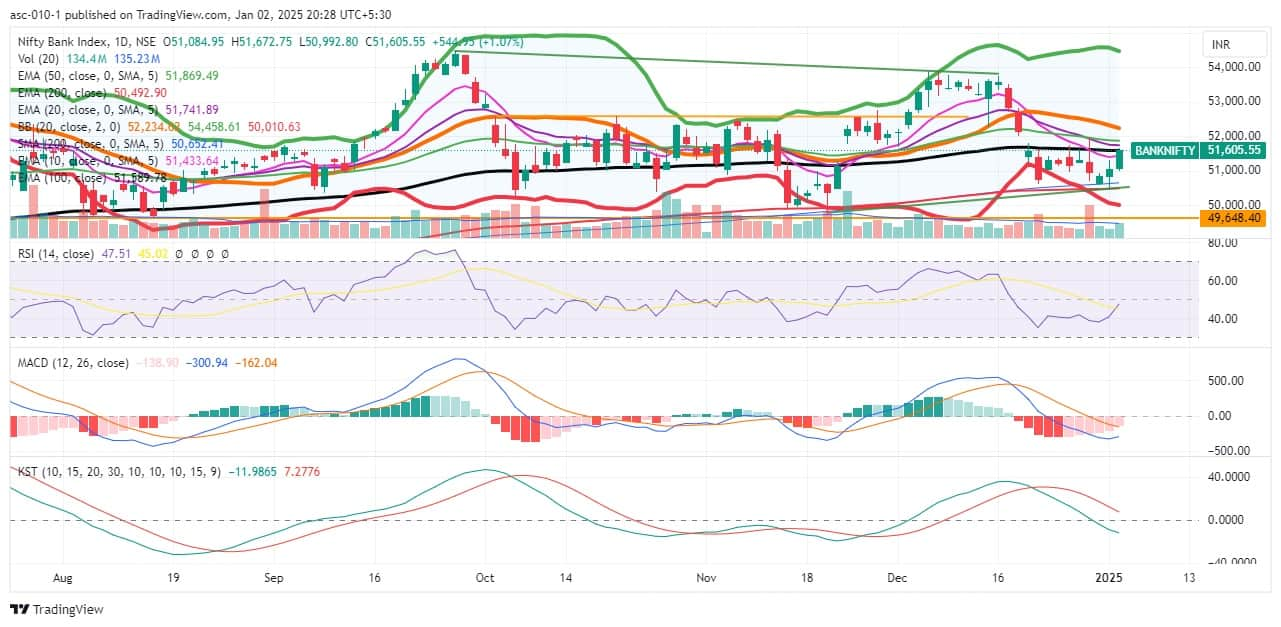
2) Key Levels For The Bank Nifty (51,606)
Resistance based on pivot points: 51,683, 51,844, and 52,104
Support based on pivot points: 51,164, 51,003, and 50,744
Resistance based on Fibonacci retracement: 52,128, 52,680
Support based on Fibonacci retracement: 50,661, 49,787
Special Formation: The Bank Nifty also formed a long green candle on the daily timeframe, with a higher high formation for another session, closing above the 10-day and 100-day EMAs after defending the 200-day EMA in the previous session, indicating strength. The banking index needs to surpass the 20-day and 50-day EMAs, as well as the midline of the Bollinger Bands, to gain strong momentum. This is possible only above 52,200. The momentum indicator RSI (47.5) recorded a positive crossover but is still in the lower band, and the MACD (Moving Average Convergence Divergence) tilted slightly upward but is still below the zero line.
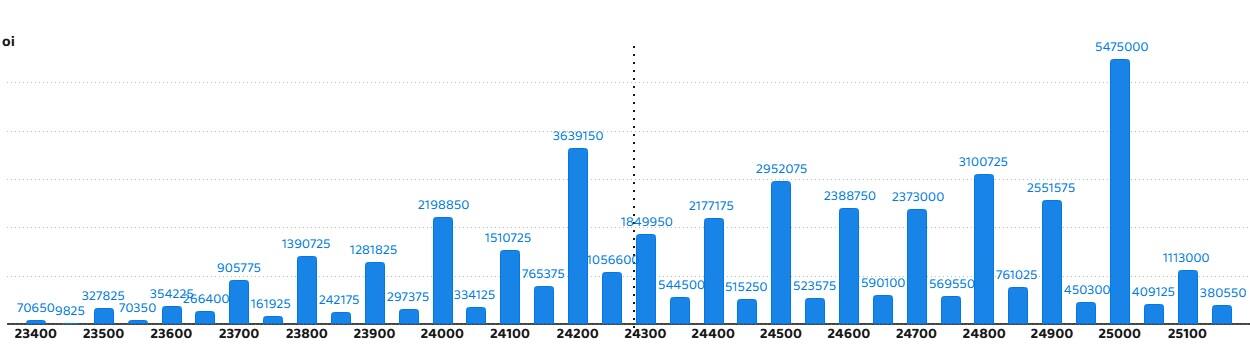
According to the weekly options data, the maximum Call open interest was seen at the 25,000 strike (with 54.75 lakh contracts). This level can act as a key resistance for the Nifty in the short term. It was followed by the 24,200 strike (36.39 lakh contracts) and the 24,800 strike (31 lakh contracts).
Maximum Call writing was observed at the 25,000 strike, which saw an addition of 36.01 lakh contracts, followed by the 24,200 and 24,800 strikes, which added 24.51 lakh and 19.33 lakh contracts, respectively. The maximum Call unwinding was seen at the 23,800 strike, which shed 5.58 lakh contracts, followed by the 23,700 and 23,600 strikes, which shed 5.36 lakh and 3.46 lakh contracts, respectively.
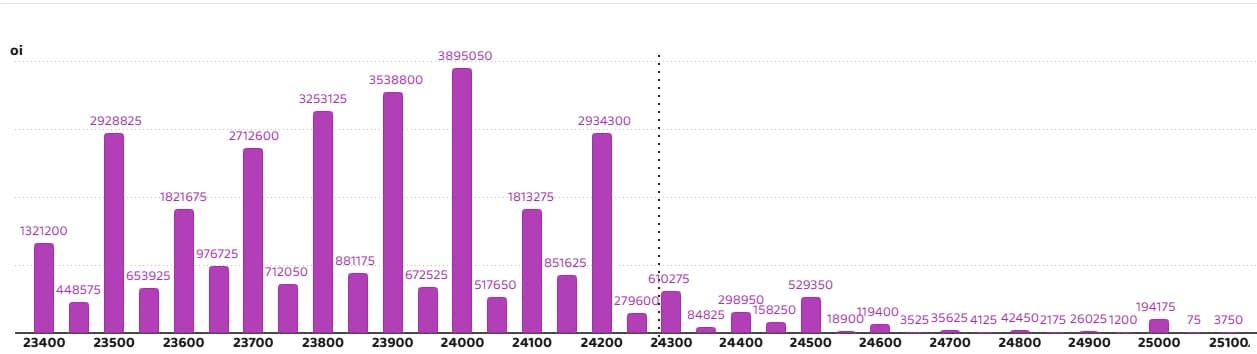
On the Put side, the maximum Put open interest was seen at the 24,000 strike (with 38.95 lakh contracts), which can act as a key support level for the Nifty. It was followed by the 23,900 strike (35.38 lakh contracts) and the 23,800 strike (32.53 lakh contracts).
The maximum Put writing was placed at the 24,000 strike, which saw an addition of 32.24 lakh contracts, followed by the 23,900 and 24,200 strikes, which added 27.48 lakh and 27.46 lakh contracts, respectively. There was hardly any Put unwinding seen in the 23,400-25,100 strike band.
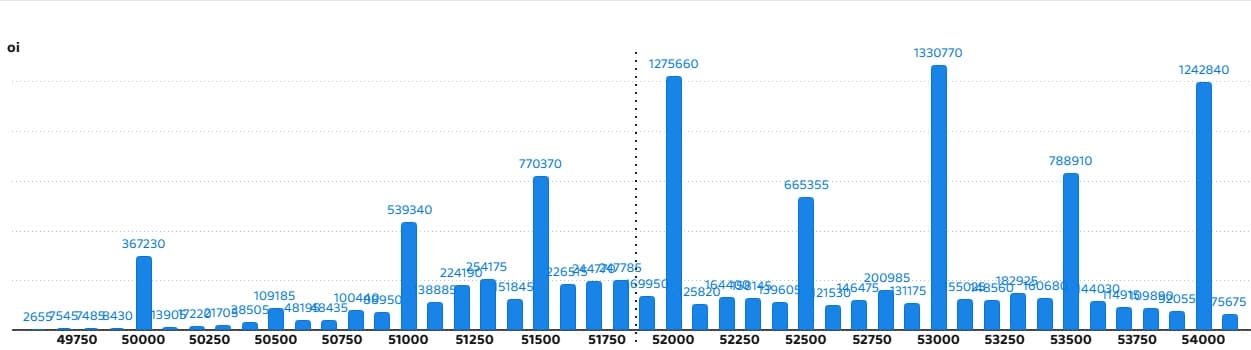
5) Bank Nifty Call Options Data
According to the monthly options data, the maximum Call open interest was seen at the 53,000 strike, with 13.3 lakh contracts. This can act as a key resistance level for the index in the short term. It was followed by the 52,000 strike (12.75 lakh contracts) and the 54,000 strike (12.42 lakh contracts).
Maximum Call writing was visible at the 53,000 strike (with the addition of 13.3 lakh contracts), followed by the 52,000 strike (12.75 lakh contracts) and the 54,000 strike (12.42 lakh contracts). There was hardly any Call unwinding seen in the 49,750-54,000 strike band.
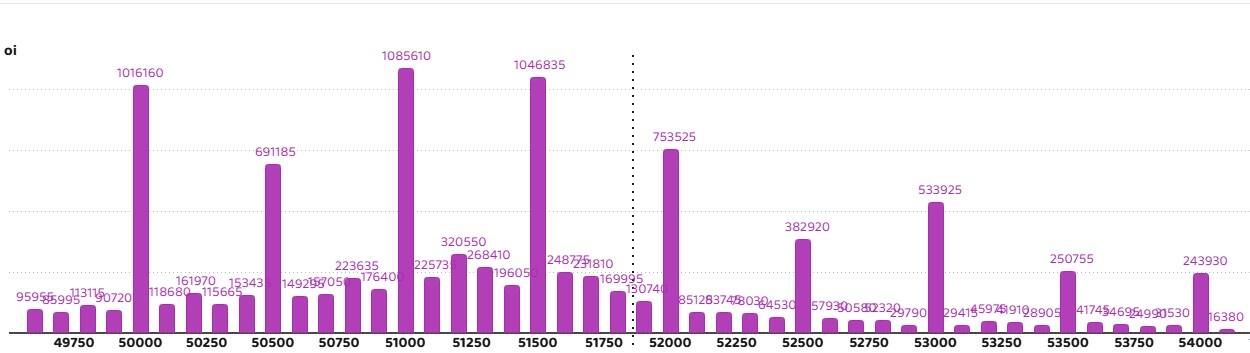
6) Bank Nifty Put Options Data
On the Put side, the 51,000 strike holds the maximum Put open interest (with 10.85 lakh contracts), which can act as a key support level for the index. This was followed by the 51,500 strike (10.46 lakh contracts) and the 50,000 strike (10.16 lakh contracts).
The maximum Put writing was observed at the 51,000 strike (which added 10.85 lakh contracts), followed by the 51,500 strike (10.46 lakh contracts) and the 50,000 strike (10.16 lakh contracts). There was hardly any Put unwinding seen in the 49,750-54,000 strike band.
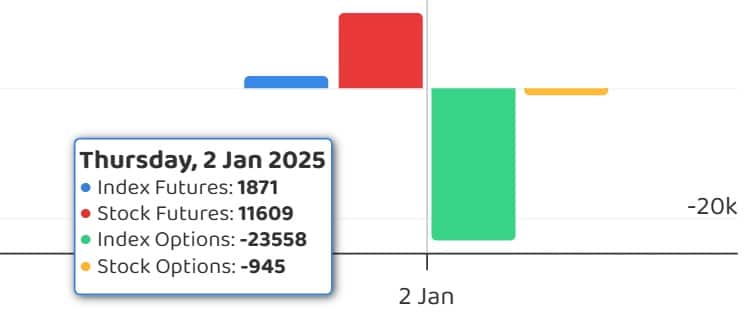
7) Funds Flow (Rs crore)
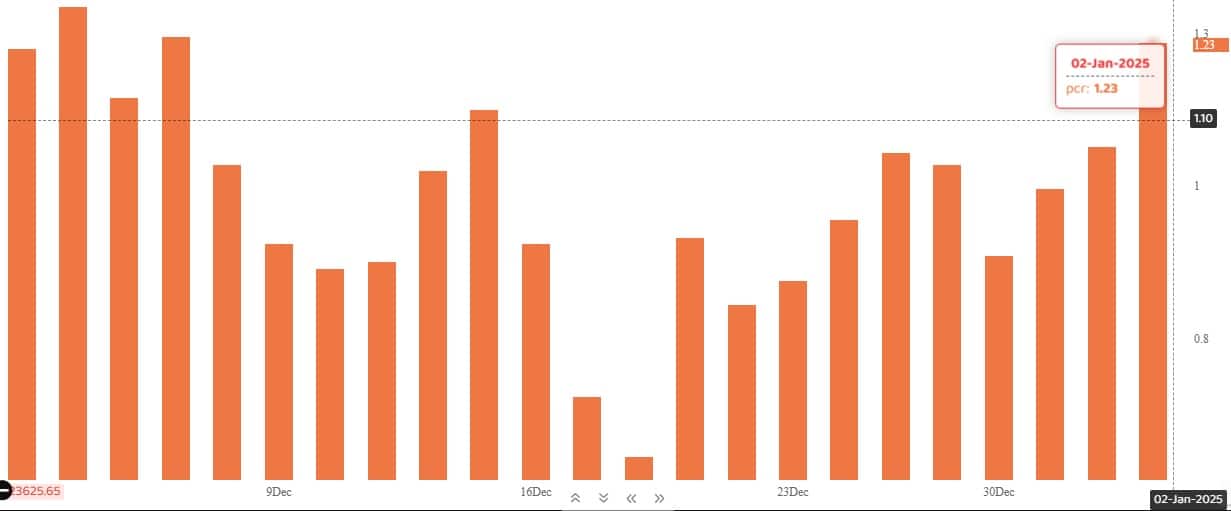
The Nifty Put-Call ratio (PCR), which indicates the mood of the market, jumped to 1.23 (the highest since December 3) on January 2, from 1.06 level in the previous session.
The increasing PCR, or being higher than 0.7 or surpassing 1, means traders are selling more Put options than Call options, which generally indicates the firming up of a bullish sentiment in the market. If the ratio falls below 0.7 or moves towards 0.5, then it indicates selling in Calls is higher than selling in Puts, reflecting a bearish mood in the market.
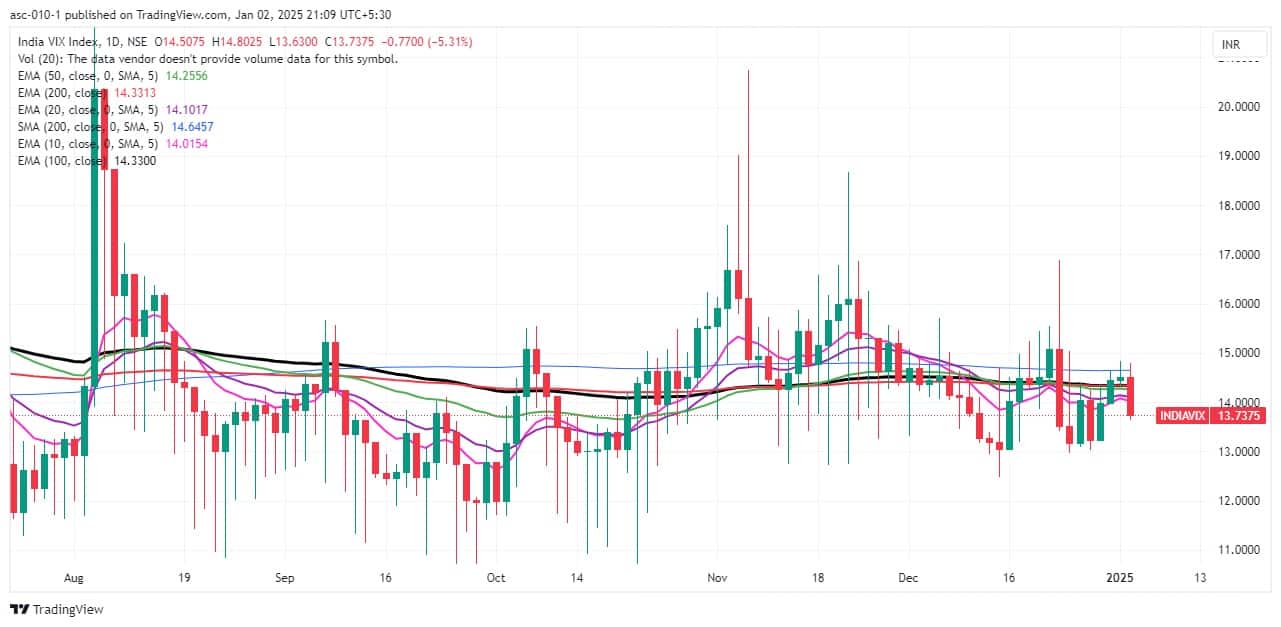
9) India VIX
The India Volatility Index (India VIX) reversed the gains of the last couple of days and declined by 5.31% to 13.74, after a three-day upward journey. This makes the bulls more comfortable.
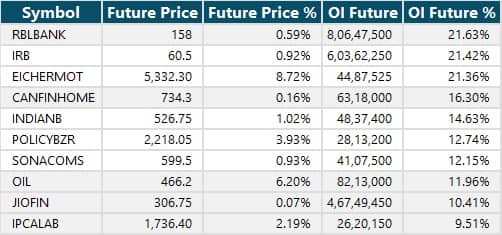
10) Long Build-up (111 Stocks)
A long build-up was seen in 111 stocks. An increase in open interest (OI) and price indicates a build-up of long positions.
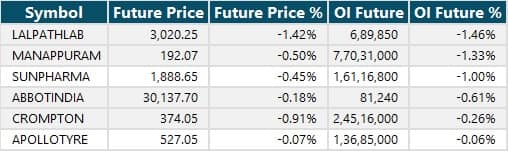
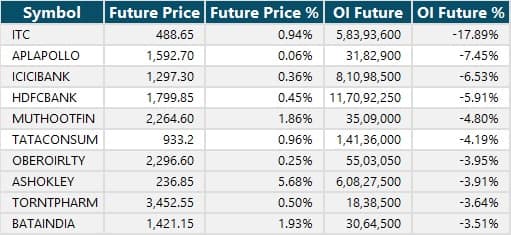
6 stocks saw a decline in open interest (OI) along with a fall in price, indicating long unwinding.
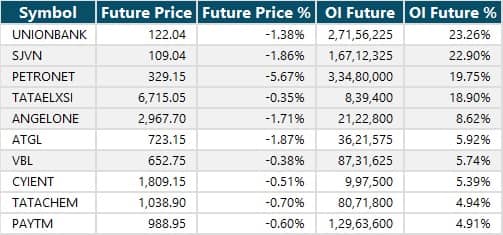
12) Short Build-up (27 Stocks)
27 stocks saw an increase in OI along with a fall in price, indicating a build-up of short positions.
13) Short-Covering (84 Stocks)
84 stocks saw short-covering, meaning a decrease in OI, along with a price increase.
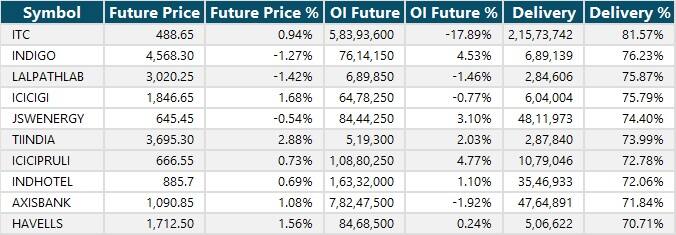
Here are the stocks that saw a high share of delivery trades. A high share of delivery reflects investing (as opposed to trading) interest in a stock.
Securities banned under the F&O segment include companies where derivative contracts cross 95 percent of the market-wide position limit.
Stocks added to F&O ban: RBL Bank
Stocks retained in F&O ban: Manappuram Finance
Stocks removed from F&O ban: Nil
Disclaimer: The views and investment tips expressed by experts on Moneycontrol are their own and not those of the website or its management. Moneycontrol advises users to check with certified experts before taking any investment decisions.Disclosure: Moneycontrol is a part of the Network18 group. Network18 is controlled by Independent Media Trust, of which Reliance Industries is the sole beneficiary.Discover the latest Business News, Sensex, and Nifty updates. Obtain Personal Finance insights, tax queries, and expert opinions on Moneycontrol or download the Moneycontrol App to stay updated!
Find the best of Al News in one place, specially curated for you every weekend.
Stay on top of the latest tech trends and biggest startup news.


