


The Nifty 50 surpassed the falling resistance trendline in the morning by climbing above 23,800 but could not sustain this level amid volatility due to profit booking, closing 43 points down on February 5. This signals a breather after a day of sharp rally; however, the overall sentiment remains favourable for bulls, with the formation of higher tops and higher bottoms on the daily chart. Hence, experts advised buying on every dip. If the index decisively moves above 23,800, a rally toward the 24,000-24,200 zone cannot be ruled out. However, if it falls below 23,800, it may consolidate, with support at 23,500.
Here are 15 data points we have collated to help you spot profitable trades:
1) Key Levels For The Nifty 50 (23,696)
Resistance based on pivot points: 23,776, 23,806, and 23,855
Support based on pivot points: 23,680, 23,650, and 23,601
Special Formation: The Nifty 50 formed a bearish candlestick pattern on the daily charts, but the higher highs and higher lows formation remains intact. Additionally, the index continues to trade above the 50-day and 200-day EMAs. The momentum indicator RSI (Relative Strength Index) at 55.85 remains in the upper band, and the MACD (Moving Average Convergence Divergence) is inching toward the zero line.
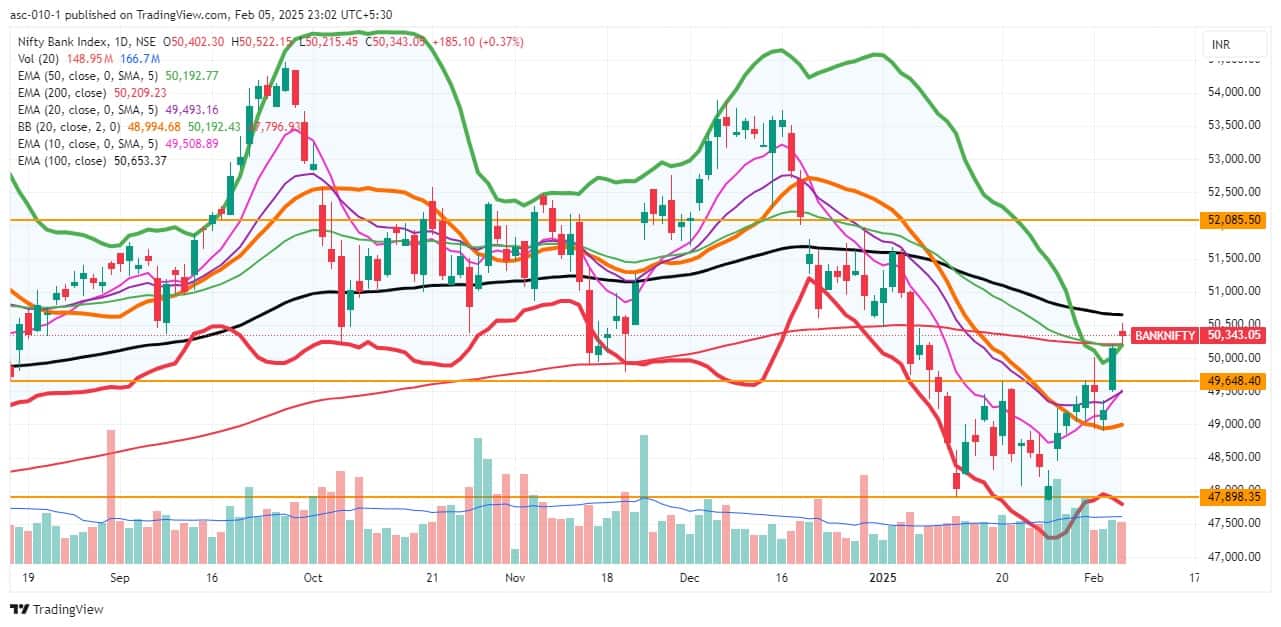
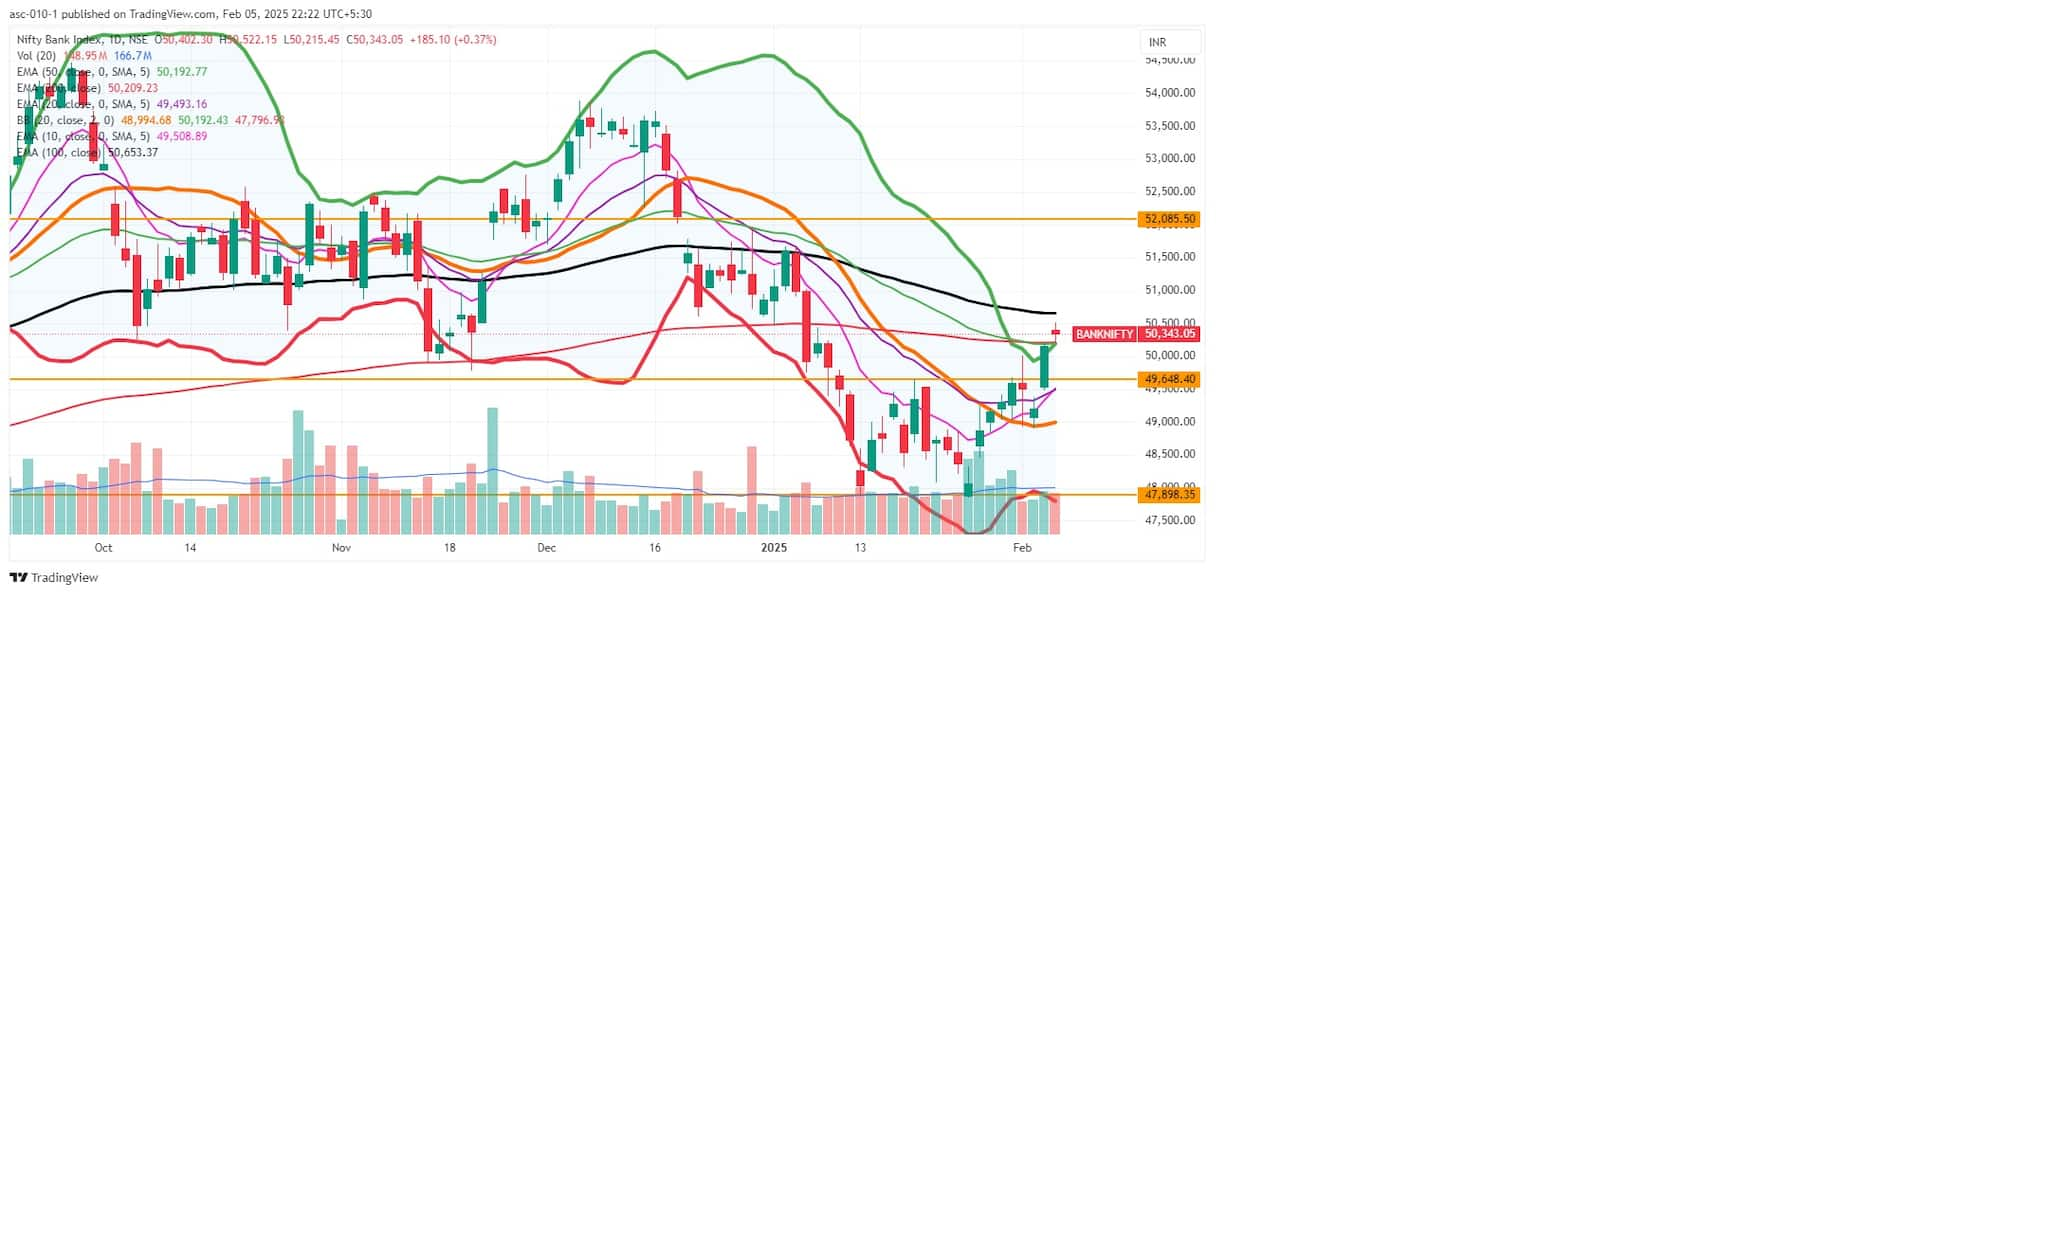
2) Key Levels For The Bank Nifty (50,343)
Resistance based on pivot points: 50,477, 50,550, and 50,667
Support based on pivot points: 50,243, 50,171, and 50,054
Resistance based on Fibonacci retracement: 51,152, 51,937
Support based on Fibonacci retracement: 47,875, 46,078
Special Formation: The Bank Nifty outperformed the benchmark Nifty 50, rising by 185 points. The index formed a small bearish candle with upper and lower shadows, resembling a high wave-like pattern on the daily timeframe, indicating volatility. However, the higher tops and higher bottoms formation continued, with the index closing above the 50-day and 200-day EMAs, which is a positive sign. The momentum indicators RSI maintained a positive bias, and the MACD is moving up toward the zero line.
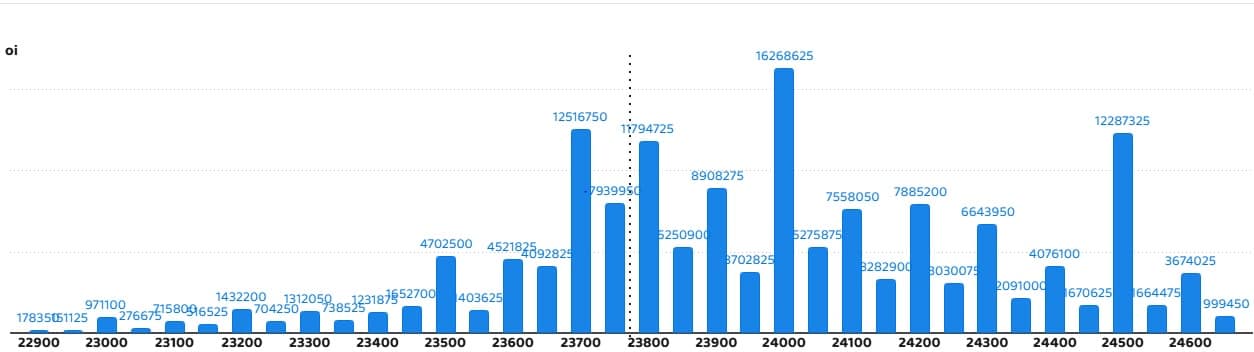
According to the weekly options data, the 24,000 strike holds the maximum Call open interest (with 1.62 crore contracts). This level can act as a key resistance for the Nifty in the short term. It was followed by the 23,700 strike (1.25 crore contracts) and the 24,500 strike (1.22 crore contracts).
Maximum Call writing was observed at the 23,700 strike, which saw an addition of 70.77 lakh contracts, followed by the 23,750 and 23,800 strikes, which added 54.38 lakh and 45.60 lakh contracts, respectively. The maximum Call unwinding was seen at the 23,500 strike which shed 6.38 lakh contracts, followed by the 23,400 and 23,300 strikes which shed 3.42 lakh and 3.1 lakh contracts, respectively.
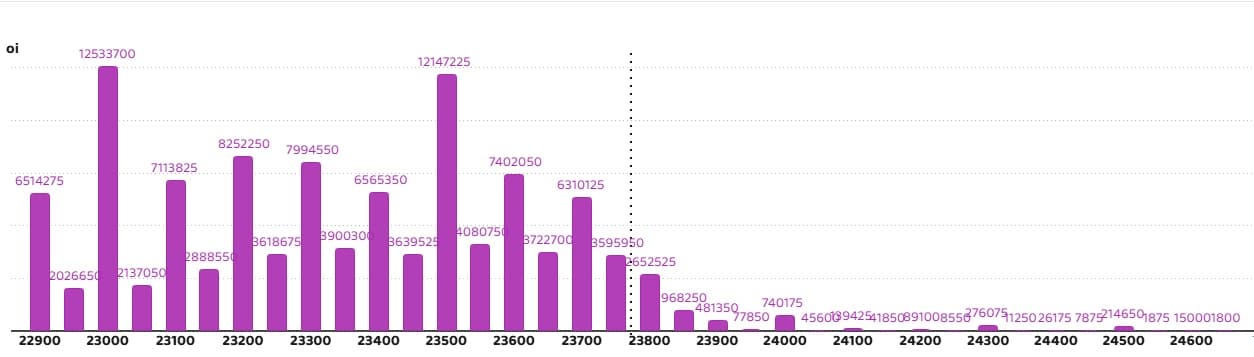
On the Put side, the maximum Put open interest was seen at the 23,000 strike (with 1.25 crore contracts), which can act as a key support level for the Nifty. It was followed by the 23,500 strike (1.21 crore contracts) and the 23,200 strike (82.52 lakh contracts).
The maximum Put writing was placed at the 23,750 strike, which saw an addition of 22.41 lakh contracts, followed by the 23,100 and 23,200 strikes, which added 21.12 lakh and 17 lakh contracts, respectively. The maximum Put unwinding was seen at the 23,400 strike, which shed 12.63 lakh contracts, followed by the 24,100 and 24,500 strikes, which shed 1.53 lakh and 62,850 contracts, respectively.
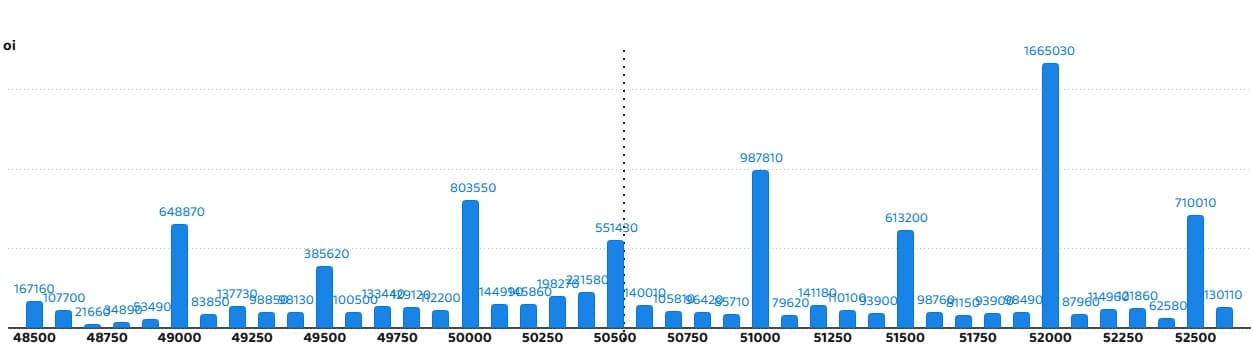
5) Bank Nifty Call Options Data
According to the monthly options data, the 52,000 strike holds the maximum Call open interest, with 16.65 lakh contracts. This can act as a key resistance level for the index in the short term. It was followed by the 51,000 strike (9.87 lakh contracts) and the 50,000 strike (8.03 lakh contracts).
Maximum Call writing was visible at the 52,000 strike (with the addition of 1.98 lakh contracts), followed by the 50,400 strike (1.11 lakh contracts) and the 50,500 strike (1.09 lakh contracts). The maximum Call unwinding was seen at the 50,000 strike, which shed 2.05 lakh contracts, followed by the 50,100 and 49,900 strikes, which shed 50,130 and 41,640 contracts, respectively.
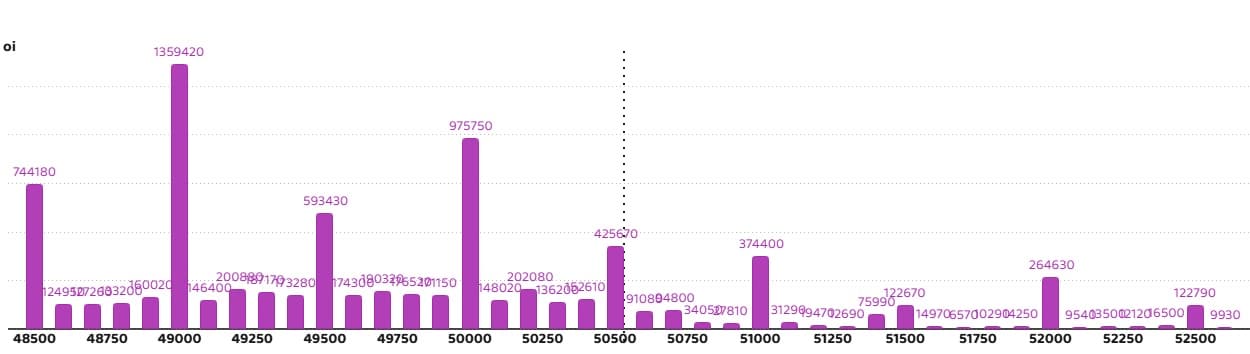
6) Bank Nifty Put Options Data
On the Put side, the maximum Put open interest was seen at the 49,000 strike (with 13.59 lakh contracts), which can act as a key support level for the index. This was followed by the 50,000 strike (9.75 lakh contracts) and the 48,500 strike (7.44 lakh contracts).
The maximum Put writing was observed at the 48,500 strike (which added 1.82 lakh contracts), followed by the 50,000 strike (1.03 lakh contracts) and the 50,400 strike (96,450 contracts). The maximum Put unwinding was seen at the 49,600 strike, which shed 12,360 contracts, followed by the 49,800 and 49,300 strikes which shed 7,800 and 3,210 contracts, respectively.
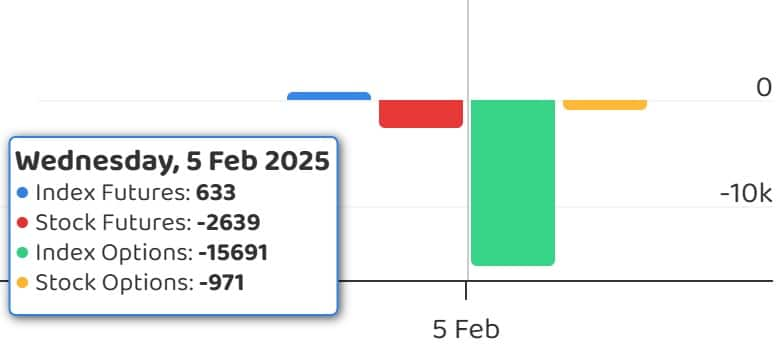
7) Funds Flow (Rs crore)
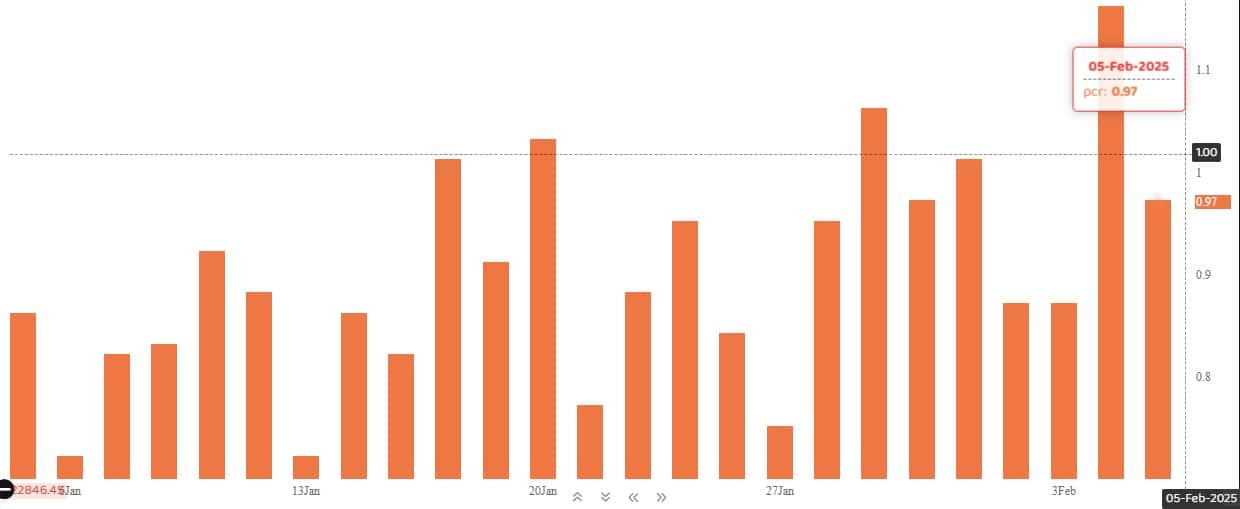
The Nifty Put-Call ratio (PCR), which indicates the mood of the market, dropped to 0.97 on February 5, against 1.16 in the previous session.
The increasing PCR, or being higher than 0.7 or surpassing 1, means traders are selling more Put options than Call options, which generally indicates the firming up of a bullish sentiment in the market. If the ratio falls below 0.7 or moves towards 0.5, then it indicates selling in Calls is higher than selling in Puts, reflecting a bearish mood in the market.
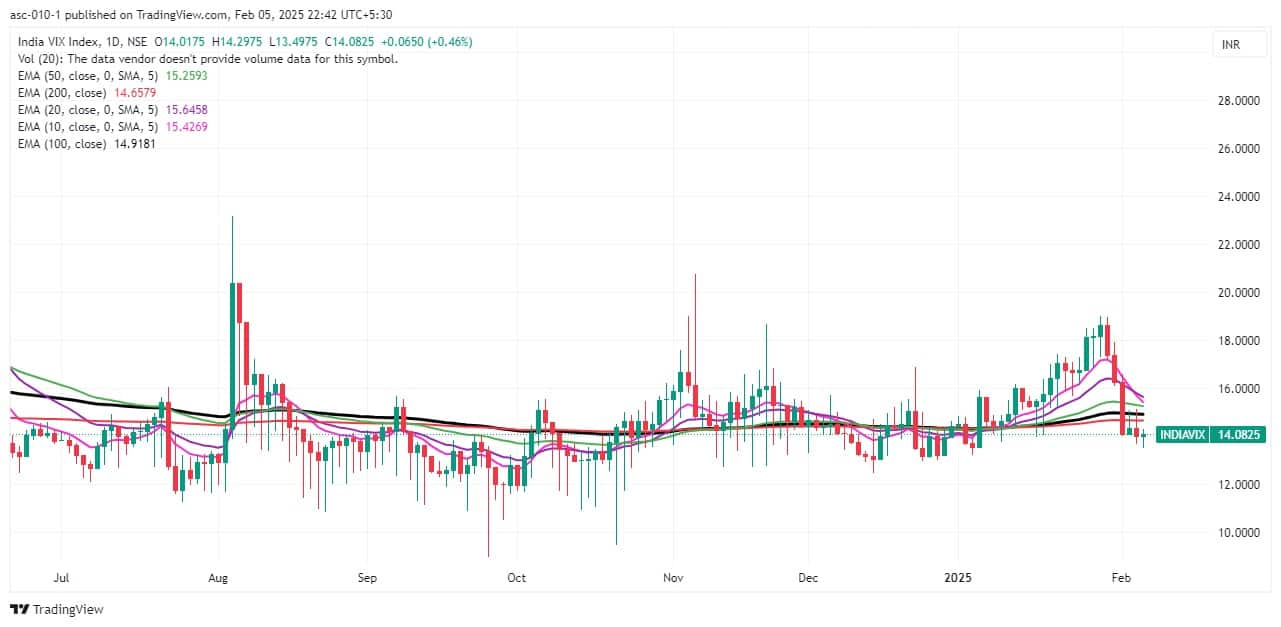
9) India VIX
The India VIX, the fear index that measures expected market volatility, increased slightly by 0.46 percent to 14.08 but remains below all key moving averages, sustaining in the lower zone. This continues to make the bulls more comfortable.
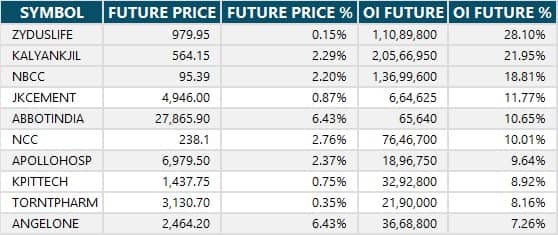
A long build-up was seen in 75 stocks. An increase in open interest (OI) and price indicates a build-up of long positions.
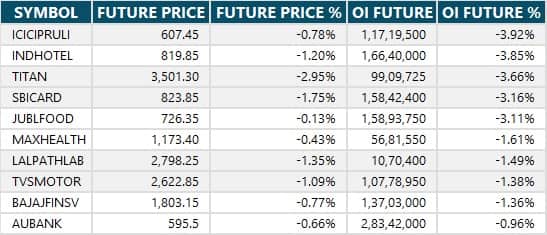
11) Long Unwinding (21 Stocks)
21 stocks saw a decline in open interest (OI) along with a fall in price, indicating long unwinding.
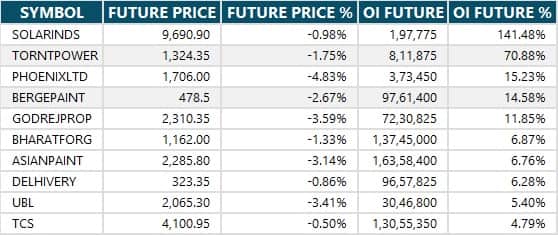
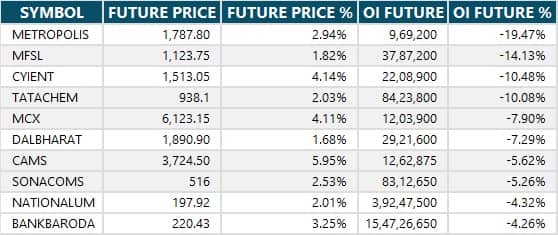
12) Short Build-up (49 Stocks)
49 stocks saw an increase in OI along with a fall in price, indicating a build-up of short positions.
13) Short-Covering (85 Stocks)
85 stocks saw short-covering, meaning a decrease in OI, along with a price increase.
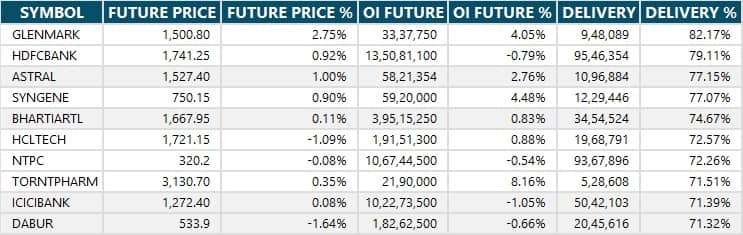
Here are the stocks that saw a high share of delivery trades. A high share of delivery reflects investing (as opposed to trading) interest in a stock.
Securities banned under the F&O segment include companies where derivative contracts cross 95 percent of the market-wide position limit.
Stocks added to F&O ban: Nil
Stocks retained in F&O ban: Nil
Stocks removed from F&O ban: Nil
Disclaimer: The views and investment tips expressed by experts on Moneycontrol are their own and not those of the website or its management. Moneycontrol advises users to check with certified experts before taking any investment decisions.Disclosure: Moneycontrol is a part of the Network18 group. Network18 is controlled by Independent Media Trust, of which Reliance Industries is the sole beneficiary.Discover the latest Business News, Sensex, and Nifty updates. Obtain Personal Finance insights, tax queries, and expert opinions on Moneycontrol or download the Moneycontrol App to stay updated!
Find the best of Al News in one place, specially curated for you every weekend.
Stay on top of the latest tech trends and biggest startup news.


