
")
Shabbir Kayyumi
The Rate-of-Change (ROC) indicator, which is also commonly referred to as ‘Momentum’, is a pure momentum oscillator. The price rate of change indicator (PROC) or simply, rate of change indicator (ROC) is a price based technical oscillator which can be displayed along with price chart. It calculates the percent change in price between different periods.
What is a ‘ROC Oscillator’?
Momentum in technical analysis is the rate of change of security prices or indices. There are several indicators based on momentum indicator; however ROC is given highest priority. It is used as a trend identification indicator as well as used to measure divergence in the momentum and price.
As with all oscillators, the ROC can be used to time the market entry into a trend. However, it really becomes most effective when confirming signals or conditions is identified by an additional technical analysis.
Construction of ROC Oscillator
Understanding underlying formula used for construction of ROC helps traders to take prudent decision, while trading complex scenarios. As the name suggests, the ROC oscillator measures the rate of change in price, based on the look-back period. Based on the configurations used, the ROC indicator measures the current price with the price for the look-back period. ROC indicator is calculated using the following formula:
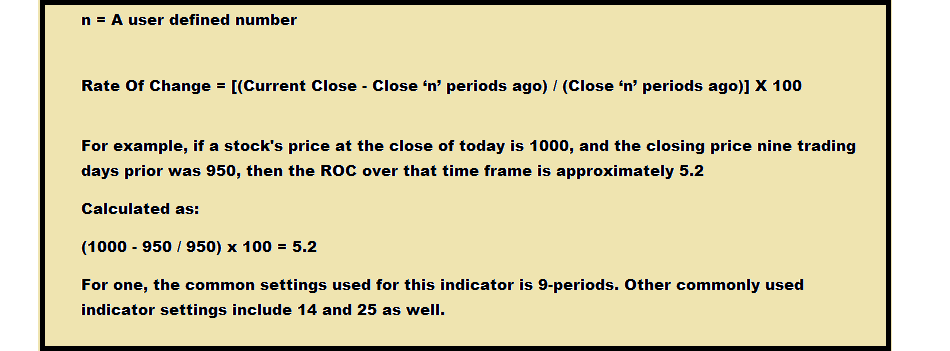
In simple language, ROC takes the current price and compares it to a price "n" periods (user defined) ago. The calculated value is then plotted and fluctuates above and below a Zero Line. Usually, closing prices are used to calculate momentum.
Working of ROC
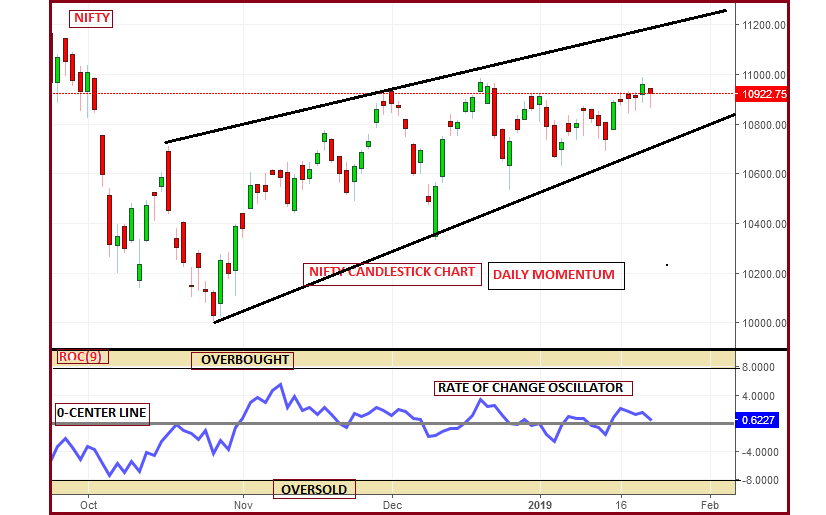
Like the most momentum oscillators, the ROC appears on a chart in a separate window below the price chart. The ROC is plotted against a zero line that differentiates positive and negative values.
Trading Technique:
Usage of Trend lines & Divergences is the most effective way while trading with ROC.
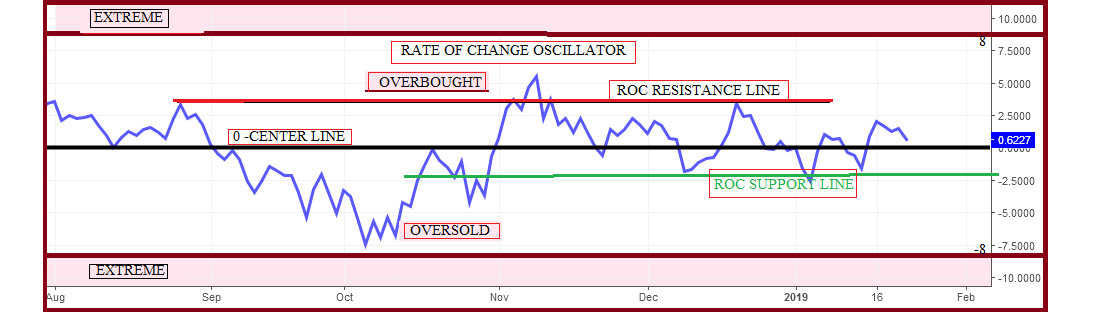
The practice of drawing trend lines on a stock chart is as almost as old as buying stock itself, but professional traders draw trend lines on the indicators too. Drawing a support and a resistance level at the same time creates a channel of action that helps measure the trend's current strength. One can use trend line breakouts to justify buy or sell signals too.
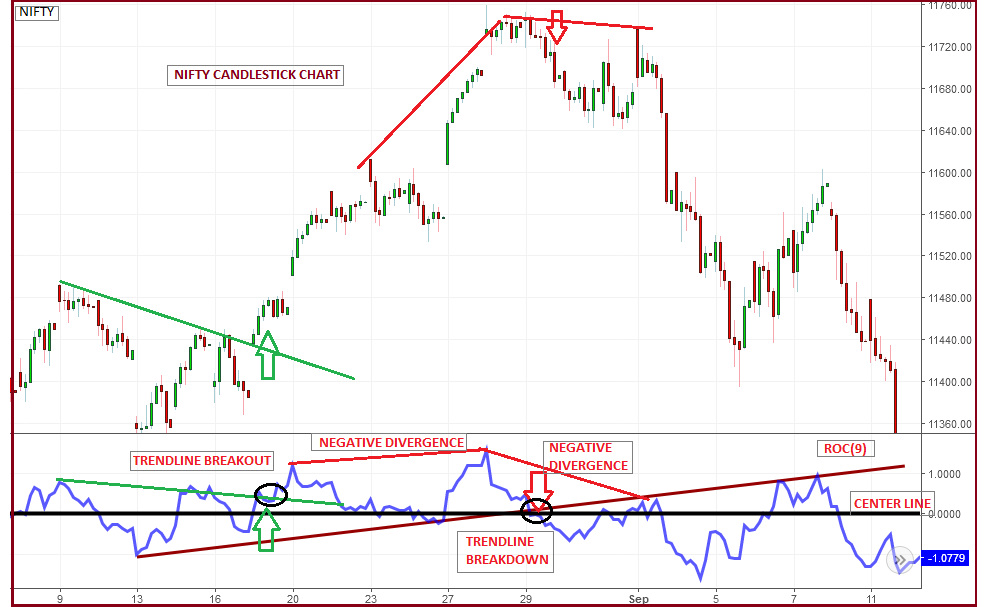
Divergence is common to all oscillators, regardless of what name they go by. A bullish divergence forms when a security records a lower low and the ROC forms a higher low. The lower low in the security affirms the current downtrend, but the higher low in the ROC suggest existing trend is exhausted & about to end.
Trend lines and Divergence together are used to develop trading strategy. Key points about it are as below-
Buy Signal:-
Entry
ROC must develop a bullish regular divergence
Buy signal is generated after a ROC trend line break out as indicated
Exit
One can use multiple ways to book profit & exit, like ROC again in over bought zone or price trend line breakdown or ROC trend line breakdown, ROC below center line.
Sell Signal:-
Entry
ROC must develop a bearish regular divergence
Sell signal is generated after a ROC trend line break down as indicated
Exit
One can use multiple ways to cover short sell trades, like ROC again in over sold or price trend line break out, ROC above center line or ROC trend line break out .
(The author is Head - Technical & Derivative Research, Narnolia Financial Advisors)Disclaimer: The views and investment tips expressed by investment expert on moneycontrol.com are his own and not that of the website or its management. Moneycontrol.com advises users to check with certified experts before taking any investment decisions.
Discover the latest Business News, Sensex, and Nifty updates. Obtain Personal Finance insights, tax queries, and expert opinions on Moneycontrol or download the Moneycontrol App to stay updated!
Find the best of Al News in one place, specially curated for you every weekend.
Stay on top of the latest tech trends and biggest startup news.


