


Supply and demand zones are observable areas on a chart where price has approached many times in the past. Unlike lines of support and resistance, these resemble zones more closely than precise lines.
Certain price levels offer value to either bullish or bearish traders. As a result, the price action tends to accelerate relatively quickly until the value has diminished or has been fully realised. Witnessing multiple instances of this at the same price level increases the probability that it is an area of value and therefore, a supply or demand zone.
The push and pull between the two also reflect the price of a security, its availability, and the desire to own such a security. In the share market, technical analysis is used to examine or foresee the movement of prices. One of the important aspects of such an analysis is determining the supply and demand (S&D) zones.
Why to buy Larsen & Toubro?Supply and demand trading can be seen as a strategy to understand the zones in which you can look to enter into trades. While support and resistance are defined by key levels of price, supply and demand are defined by a wider price area/zone. The breadth makes it easier to find entries for trades.
At present, L&T is near the demand zone and chances of reversal are very high. At the same time, it has given a close above the previous day’s high, indicating that the bullish bias will continue. The mentioned demand zone can attract the bulls and buying can push it towards the supply zone as shown as a price projection. These technical rationales suggest buying opportunity in the stock.
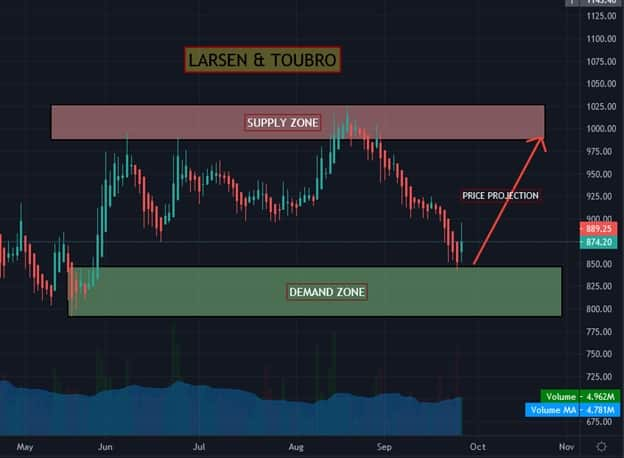
As per the chart, one should book around the upper supply zone, which is placed around Rs 980. So, one can consider profit-booking near the supply zone around Rs 980 and on the higher side towards Rs 1,020.
Stop LossThe entire bullish view negates on a breach of demand zone and in the case of L&T, we will consider Rs 810 as a stop loss level on a closing basis.
We recommend buying Larsen & Toubro at around Rs 875 with a stop loss of Rs 810 for higher targets of Rs 1,000 as indicated in the chart.
(Shabbir Kayyumi is the Head-Technical Research at Narnolia Financial Advisors Ltd.)Disclaimer: The views and investment tips expressed by experts on Moneycontrol.com are their own and not those of the website or its management. Moneycontrol.com advises users to check with certified experts before taking any investment decisions.
Discover the latest Business News, Sensex, and Nifty updates. Obtain Personal Finance insights, tax queries, and expert opinions on Moneycontrol or download the Moneycontrol App to stay updated!
Find the best of Al News in one place, specially curated for you every weekend.
Stay on top of the latest tech trends and biggest startup news.


