


Dear Reader,
The week began on a grim note following the Yen Carry Trade crisis, which unsettled US markets on Friday and spilled over to Indian markets on Monday. Fear gauges, including the volatility indices of major markets, surged to levels not seen since the 2008 financial meltdown and the 2020 pandemic.
Indian markets opened significantly lower on Monday but consolidated throughout the week, pushing higher on Friday to close at the upper end of the range. Despite this recovery, the sharp gap-down on Monday led to a weekly loss of around 1.5 percent for the benchmark indices.
Global market sentiment, shaken by the largest sell-off in two years, was somewhat calmed by reports that nearly three-fourths of the leveraged Yen Carry positions were squared.
Global markets performed better than Indian markets, buoyed by a drop in weekly jobless claims on Thursday, which triggered a sharp rebound in the US market, marking its best daily gain since November 2022.
As a result, the S&P 500 and Nasdaq closed the week flat, while the Dow Jones posted a 0.60 percent loss. European markets ended the week either flat or slightly higher, with the pan-European Stoxx 600 gaining 1.16 percent.
A positive signal for global markets came from Japan, the epicentre of the crisis. Despite experiencing one of the worst one-day sell-offs in decades, the Nikkei 225 recovered most of its losses, closing near the week’s high, although still down by 2.50 percent.
Oversold Indicators
The wild week that began with global turmoil ended on a quiet note. Friday’s low trading volumes indicate a complete loss of momentum and direction. However, several short-term sentiment indicators show signs of being oversold, and positioning suggests a reduction in market pressure, which could lead to a continued rebound towards higher highs. Whether this rebound will be fast or slow is difficult to predict until trading volumes return.
Both the swing and average swing indicators entered oversold territory by Tuesday, which typically signals significant turning points (see chart Daily Swing) for the next one to two weeks. This is the fifth such reading since April 2024, and each of the previous instances has led to market advances to new highs.
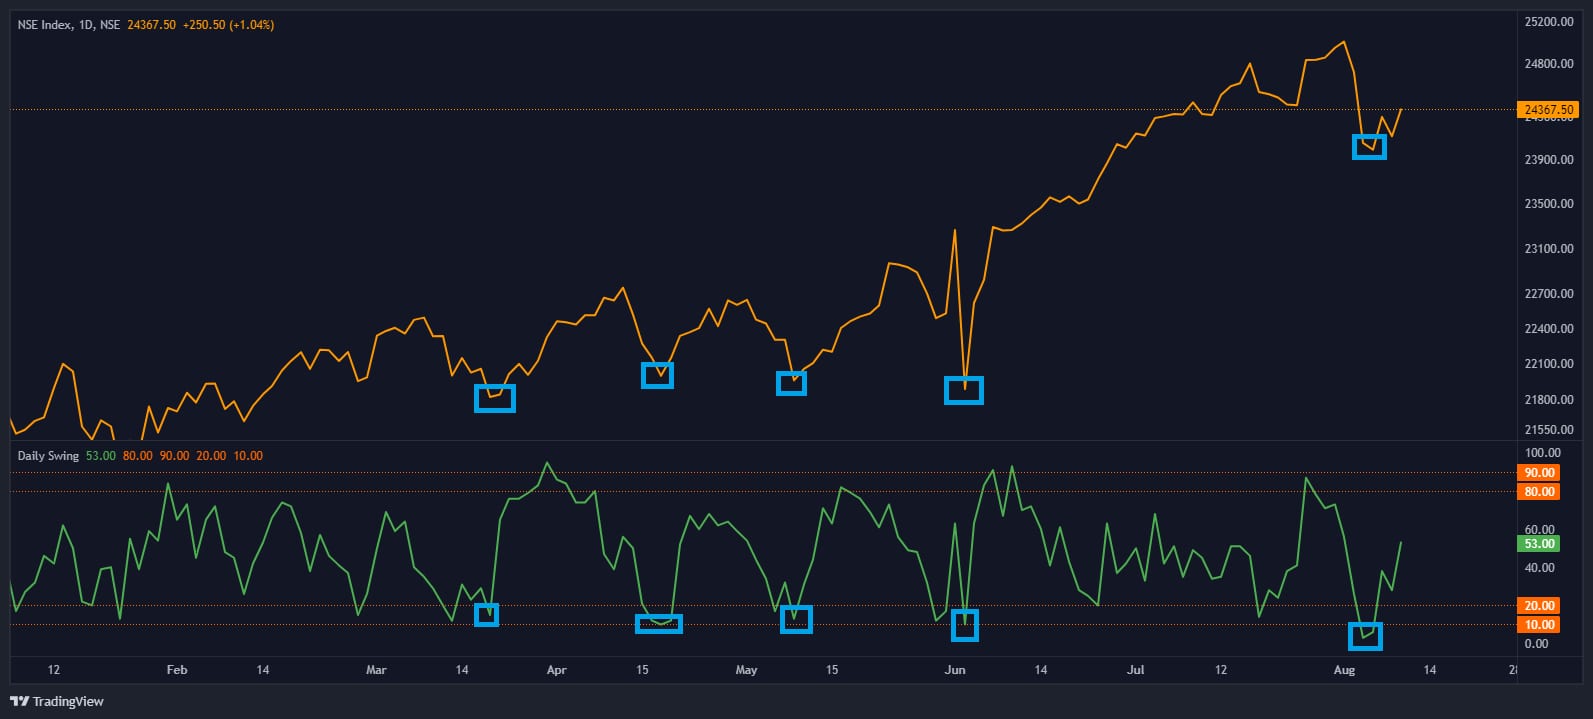
Daily Swing
Source: web.strike.money
This second chart displays a histogram plotting open interest based on the net position of Calls minus Puts, measured in crores of rupees (See chart Call Put Histogram). On "Manic Monday," this figure reached an all-time high of Rs 588,928 crores. Such extreme readings indicate capitulation, where widespread, frantic selling occurs. Selling call options is equivalent to shorting the market. Historically, such readings have often signalled panic bottoms, marking significant turning points in the market.
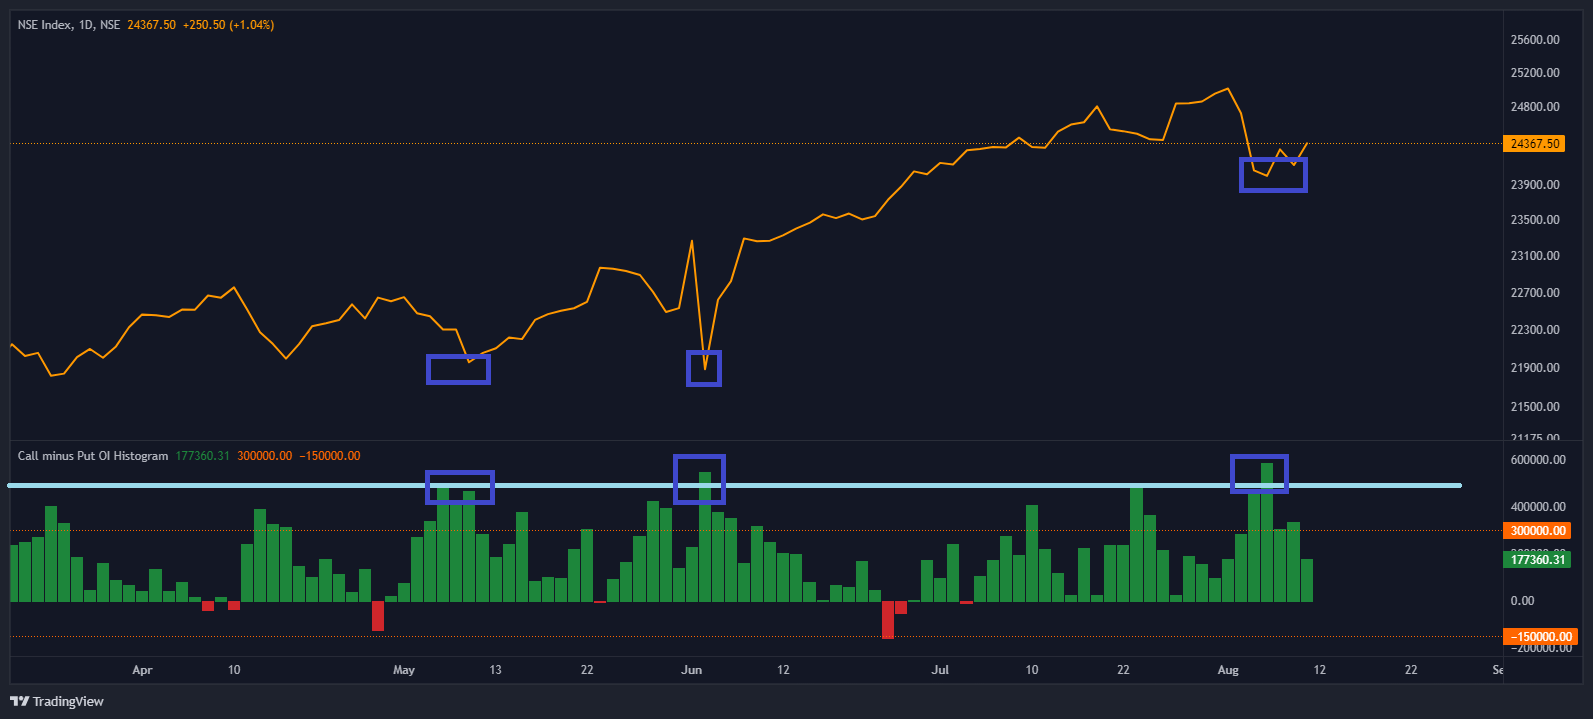
Call Put Histogram
Source: web.strike.money
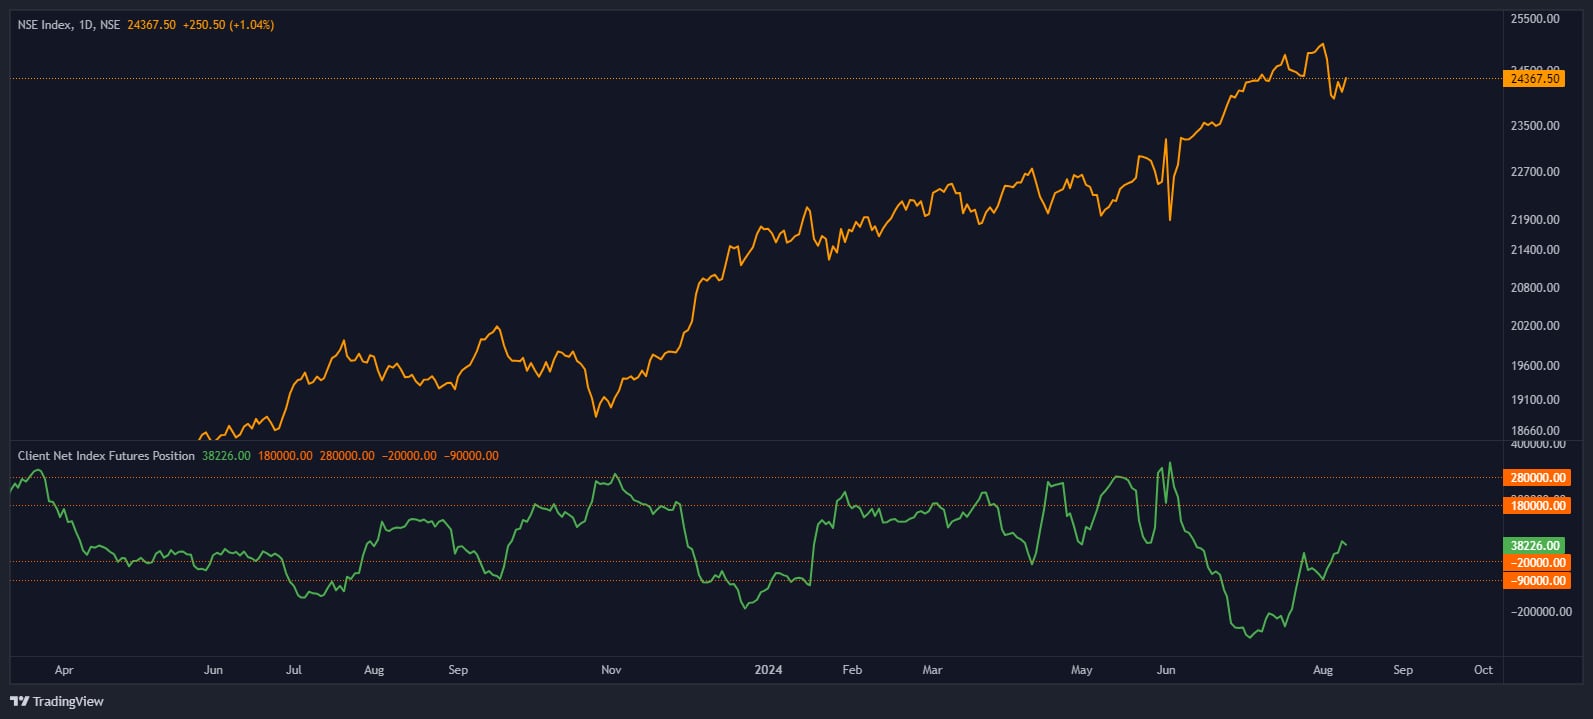
One indicator signalling caution for several weeks was the client positioning, which showed a significant short position in the market—the highest since 2017. This raised concerns, as clients often take large contrarian bets that historically tend to be correct.
However, timing is crucial. While the Nifty hasn’t seen a substantial decline, the positioning has shifted. All the shorts have now covered their positions, and there is a small net long position. In other words, clients are currently neutral on the market. Keep an eye on the direction this data takes next for further insights.
Relative Rotation Graph (RRG)
Source: web.strike.money
Sector Rotation
According to the daily Relative Rotation Graph (RRG) from India Charts, defensive sectors like Pharma and FMCG posted gains while others closed in red territory (see chart Daily RRG) during the week. Nifty Auto lost momentum but is still in the leading quadrant.
Despite being in the weakening quadrant, the Nifty IT and FMCG sectors are interestingly positioned on the weekly RRG. Any pickup in momentum should be paid attention to.
Nifty Pharma and Healthcare showed bullish momentum and maintained their position in the leading quadrant. Nifty Energy, PSE, and CPSE also continue to be in the leading quadrant. Nifty Realty is still in lagging territory.
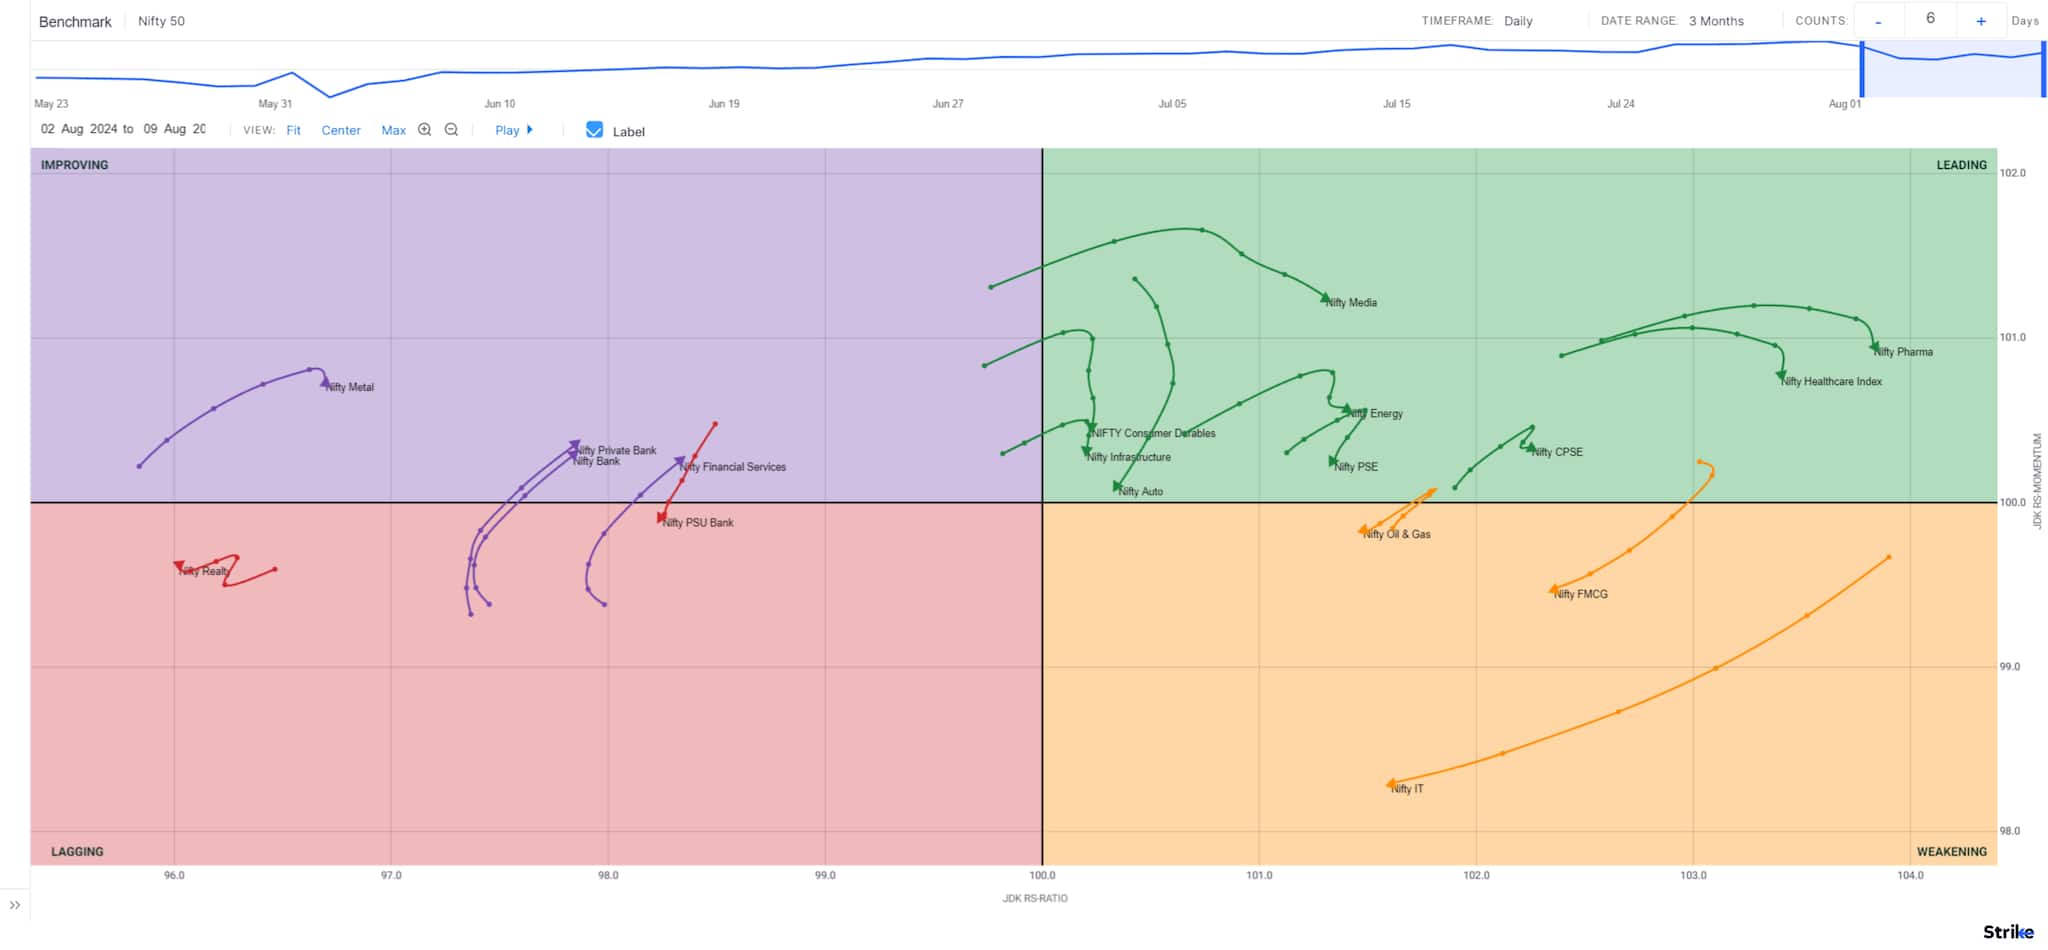
Daily RRG
Source: web.strike.money
The weekly RRG, which provides slightly longer-term signals, indicates that most sectors show declining relative strength and momentum. Defensive sectors like FMCG and Healthcare are in the leading quadrant. Meanwhile, Nifty IT is in the improving quadrant, exhibiting relative strength and relative momentum growth.
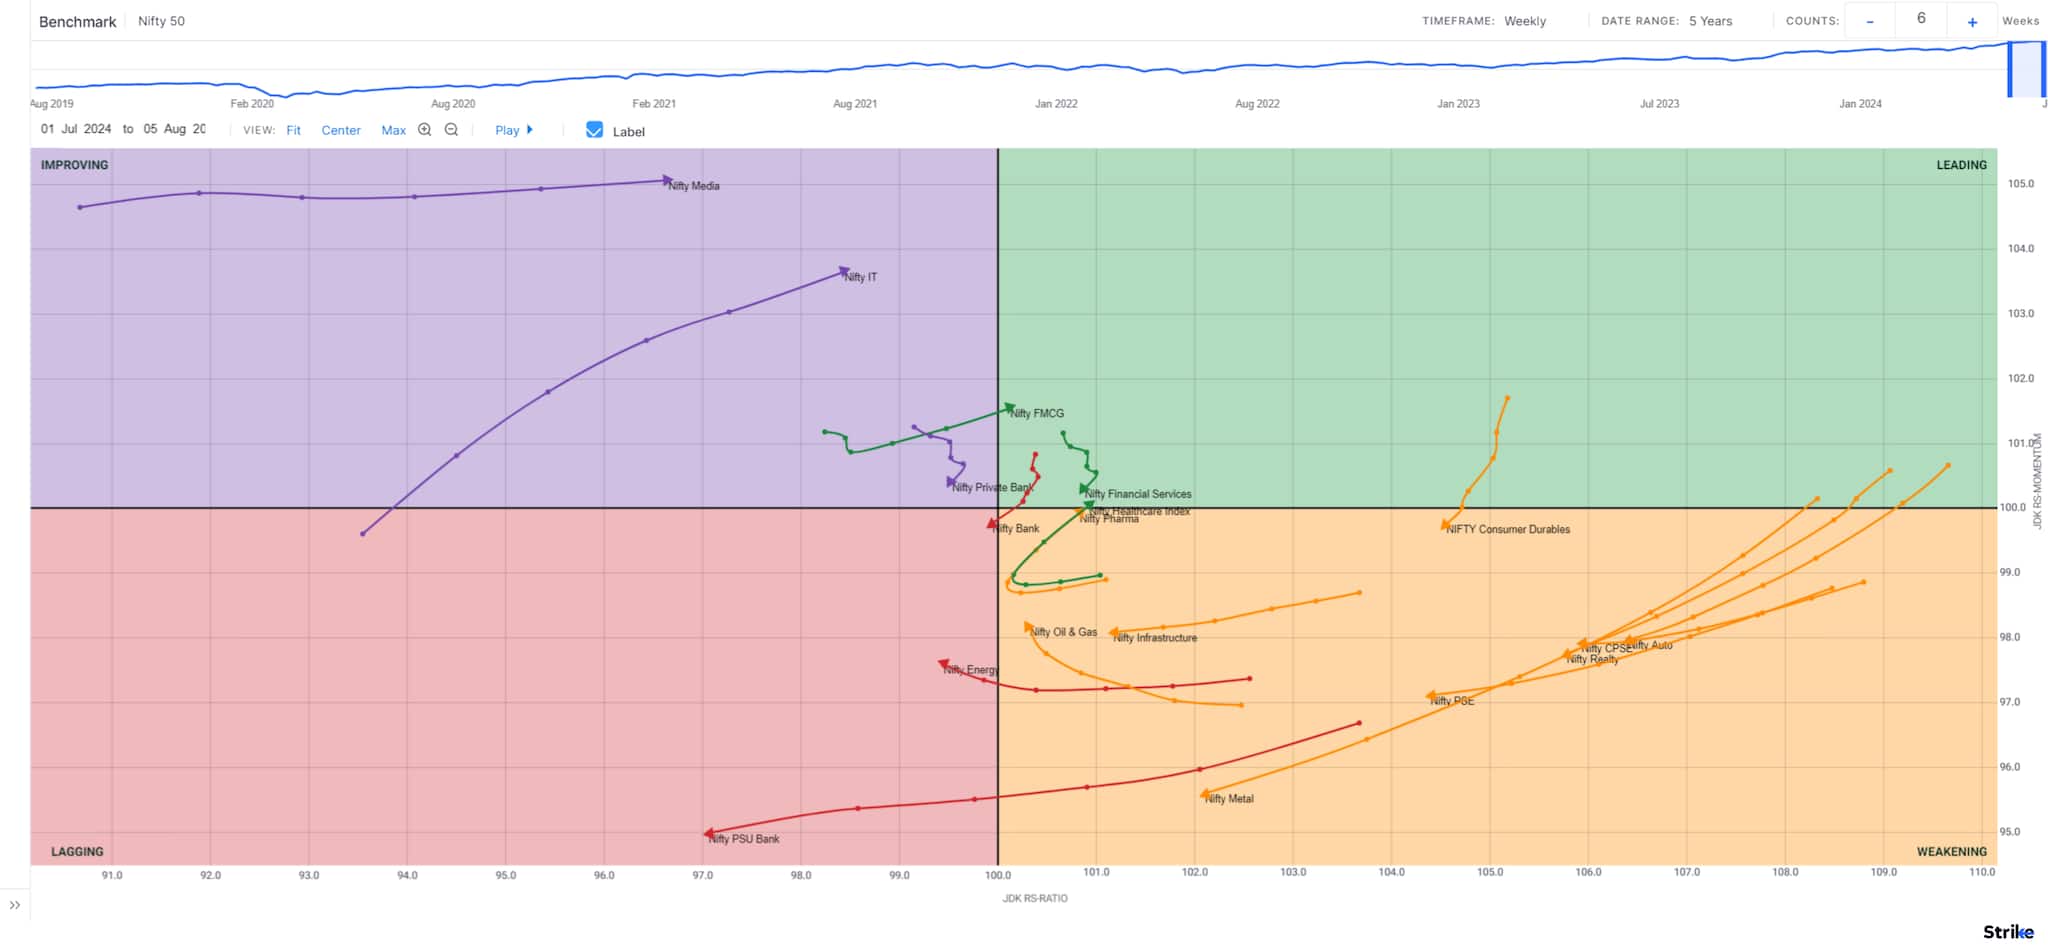
Weekly RRG
Source: web.strike.money
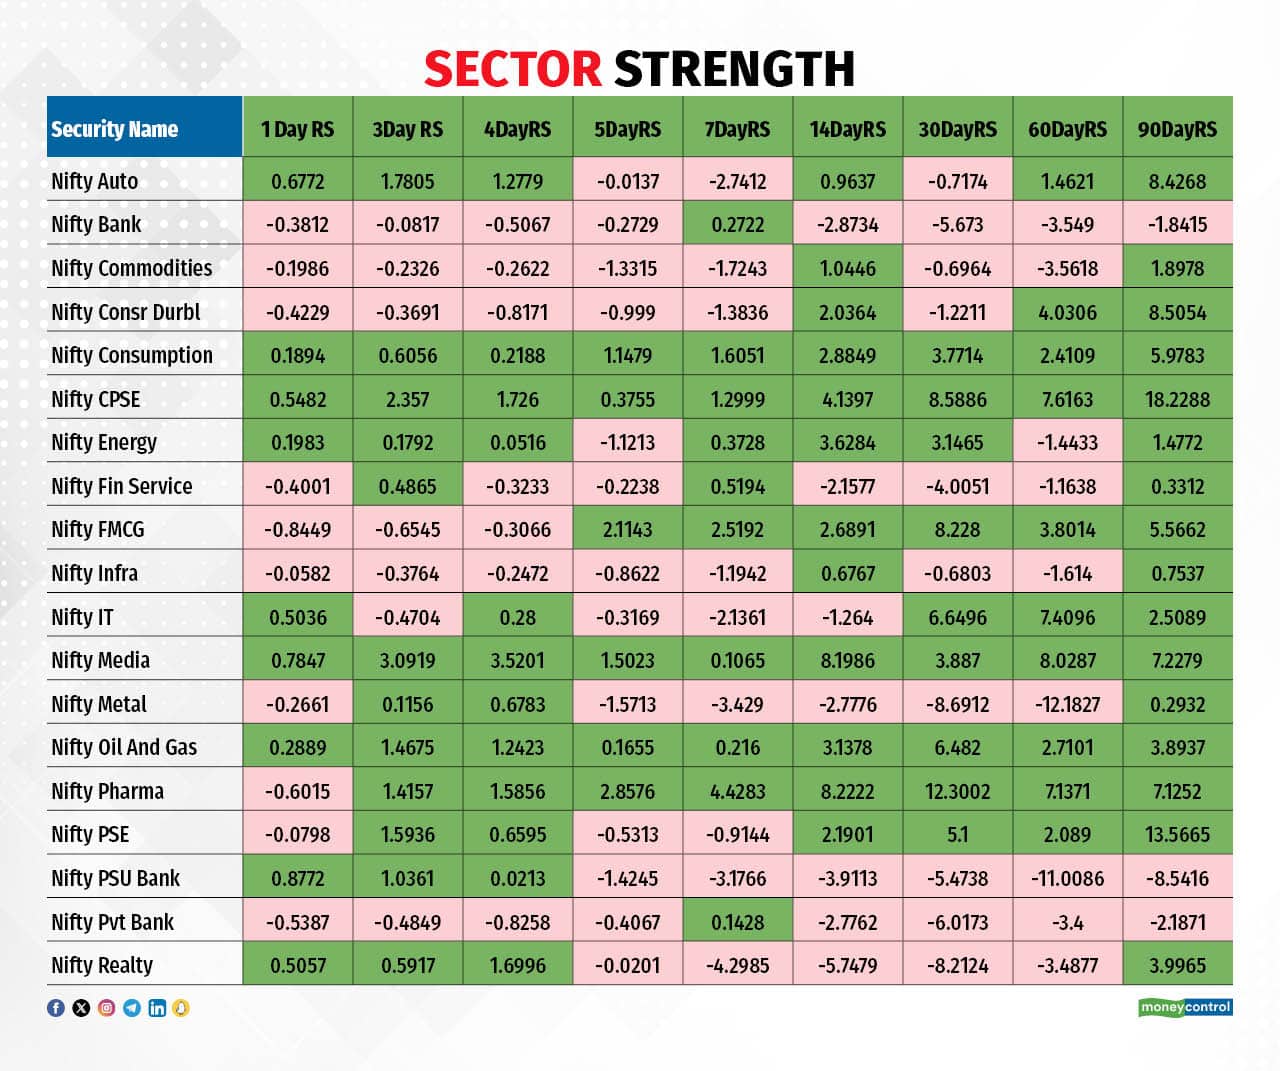
In the short term, the Nifty Consumption and Nifty CPSE indices have continued their strong performance, maintaining their dominance across the market.
Data collected by Quant Lab shows the FMCG sector's performance has moderated and shows signs of slowing down. The Nifty Media index has emerged as an outperformer, providing a cushion to the overall market sentiment. On the other hand, Bank Nifty remains a laggard, continuing to underperform compared to its peers.
In the long term, the Nifty Oil & Gas and Nifty CPSE indices may maintain their position as dominant sectors. Their strong performance in recent weeks suggests they are likely to continue driving market gains while remaining cautious about sectors showing signs of slowing down.
Sector Strength
Source: Quant Lab
Indices and Market Breadth
Markets saw a sharp correction during the week. The BSE Sensex declined by 1.57 percent, while the Nifty50 lost 1.41 percent.
The broader market moved largely in line with the frontline index. The smallcap index fell by two percent, while the midcap index dropped by 1.5 percent.
FIIs continue to sell during the week, selling Rs 19,139.76 crore in the cash market.
In the futures market, FIIs continue to reduce their position (FII Net Index Futures position). FIIs reduce their long position from 145109 contracts to 22277 contracts.
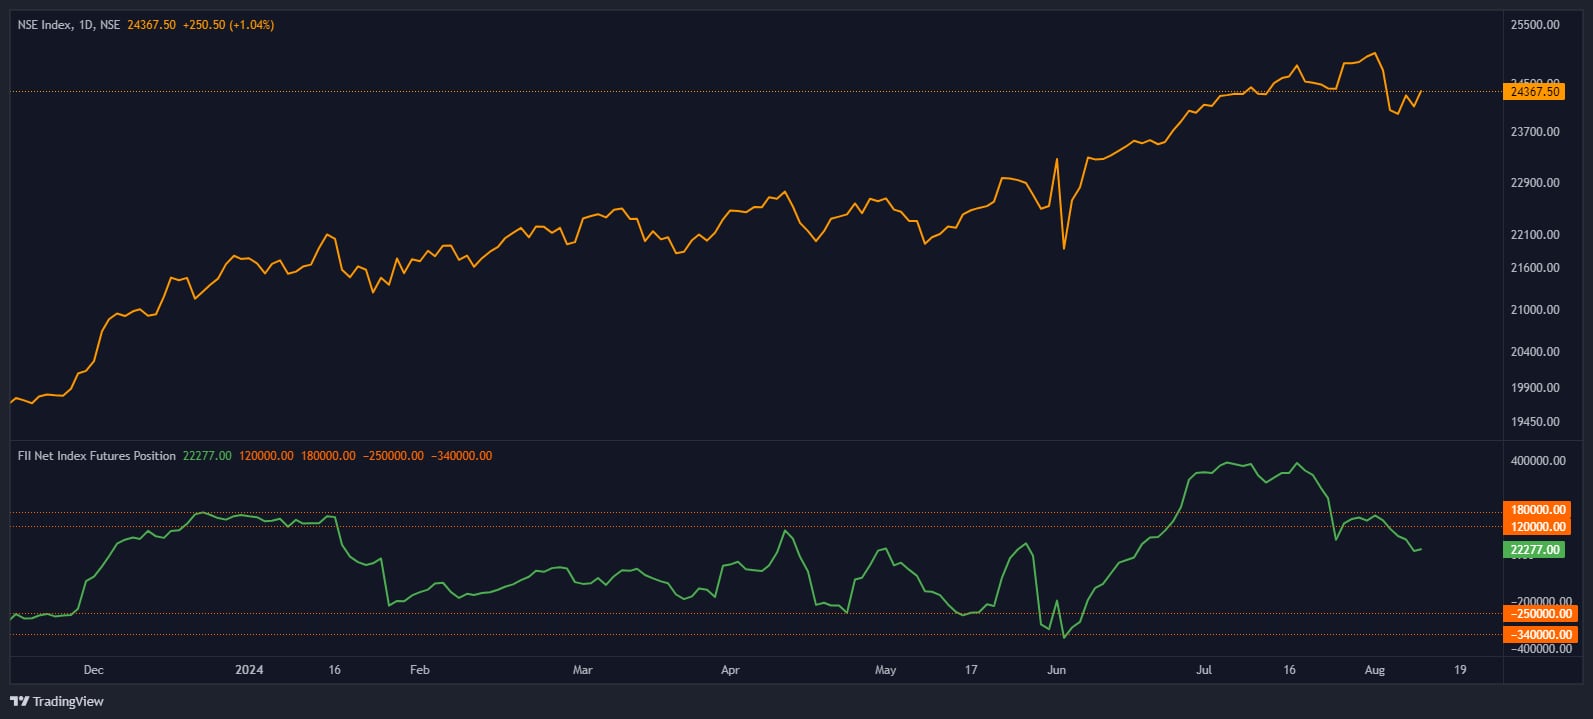
FII Net Index Futures position
Source: web.strike.money
Among the top performers in derivative stocks are Trent, which traded 11.18 percent higher; Eicher Motors closed up 5.54 percent, while OFSS was up 5.00 percent.
Among the weak stocks during the week, SAIL closed 5.89 percent lower, Apollo Tyres was down 3.84 percent and HPCL was down 3.21 percent.
Stocks to watch
Among the stocks expected to perform better during the week are Dr Reddy’s Lab, Muthoot Finance, Torrent Pharma, Sun Pharma, KPI Green, TVS Motor, Naukri, Cipla, Balrampur Chinni, Ashok Leyland and Atul.
Among the stocks that can witness further weakness are IndusInd Bank, IDFC First Bank, RBL Bank, Shree Cements and IDFC.
Cheers,
Shishir Asthana

Discover the latest Business News, Sensex, and Nifty updates. Obtain Personal Finance insights, tax queries, and expert opinions on Moneycontrol or download the Moneycontrol App to stay updated!
Find the best of Al News in one place, specially curated for you every weekend.
Stay on top of the latest tech trends and biggest startup news.


