


Dear Reader,
Despite many market indicators entering oversold territory, the market's decline continued, underscoring its underlying weakness. While global markets remained stable, Indian equities faced steady pressure due to persistent FII selling. Rumours circulate about a Canadian government fund aggressively offloading shares post the recent diplomatic row, though this remains unconfirmed.
The downturn marked the fourth consecutive weekly loss for the BSE Sensex and Nifty50, down 2.24% and 2.7%, respectively. The fall marked the longest losing streak since August 2023. Broader indices fared worse, with the Large-cap, Mid-cap, and Small-cap indices falling 3.2%, 5.2%, and 7.3% respectively. For October, both benchmarks lost 6 percent each.
Selling was widespread, with every sector ending in the red. The media, Metal, and Real Estate sectors each declined around 7%, while Oil and gas fell over 6%. The PSU Bank index shed around 6%, and the Auto index dropped by more than 5%, reflecting significant bearish sentiment across the board.
With the US election approaching, markets are showing signs of unease, amplified by rising interest rates. The Dow Jones dropped 2.88% over the week, while the S&P 500 fell 0.96%, and the Nasdaq edged up by 0.16%. The 10-year Treasury yield increased by roughly 10 basis points, hovering near 4.20%. This rise signals that markets may expect the Federal Reserve's rate cuts to be slower, with the yield possibly reaching 5% within six months.
In Europe, the STOXX 600 dropped 1.18% amid expectations of a slower easing from the Federal Reserve. Italy's FTSE was down 1.22%, France's CAC 40 fell 1.52%, Germany's DAX declined 0.99%, and the UK's FTSE closed 1.31% lower. Business activity contracted in the euro area, with the composite PMI slipping to 49.7 in October. ECB policymakers are discussing further policy easing, though views differ on the rate cut pace. Central bankers from France, Portugal, and Finland voiced concerns over lagging economic growth and inflation risks.
In the UK, the PMI dropped to an 11-month low of 51.7 in October, down from 52.6 in September. In Asia, Japan's Nikkei 225 fell 2.74%, influenced by uncertainties around the upcoming general election on October 27, while the yen weakened to 151 per USD. Meanwhile, Chinese markets were among the few in positive territory, with the Shanghai Composite Index rising 1.17% as the People's Bank of China injected RMB 700 billion into the banking system, held the lending rate steady, and indicated possible further easing through reserve requirement adjustments.
While the Chinese market rose, the Hang Seng Index declined by 1.03 percent.
With Israel attacking Iran, the war in East Asia has taken a turn for the worse. Also, with the US election looking ahead, we can expect volatility to pick up in the near future.
Market weakness may continue
The Nifty index's decisive close below the 20-week moving average of 24,702 signals underlying weakness, suggesting a likely continuation of the downtrend in the upcoming trading sessions.
On the downside, key support levels to monitor are the August low of 23,894 and the 40-week exponential moving average (WEMA) at 23,567. On the upside, the 24,550–24,700 range will act as a significant resistance zone. Pullbacks are likely to encounter selling pressure until the Nifty index breaks and sustains above this resistance range.
Examining the broader Nifty 500 index, we see that the percentage of stocks above the 100-day Simple Moving Average (SMA) has broken a trendline to the downside, currently at 29%. In 2022, while the Nifty 500 index hit a higher high, the percentage of stocks above their 100-day SMA failed to reach a new peak, highlighting weaker market internals.
We're seeing a similar setup this time. Previously, in March 2023, the indicator bottomed out at 18. Historically, when this indicator drops to 20 or below, it often signals that a market correction may be nearing its end. Medium-term support levels for the Nifty 500 index are 22,065 and 21,400. A reversal around this support range, paired with an indicator rebound from sub-20 levels, could suggest a turnaround. Until then, the near-term outlook may remain weak.

Source: web.strike.money
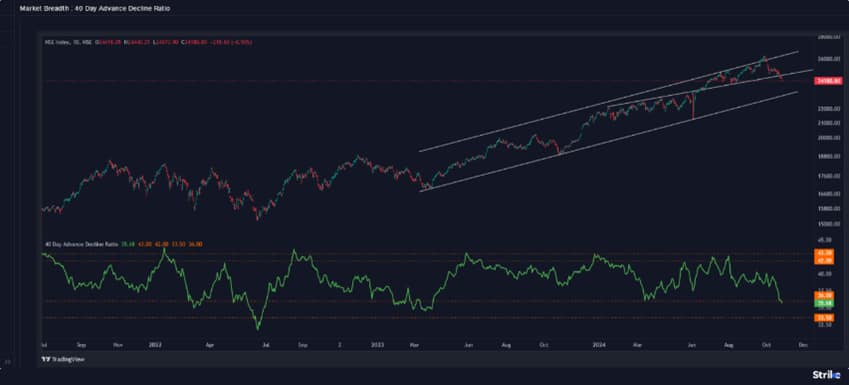
This week, the Nifty 50 index broke through several key support levels. As it declines, the August low of 23,894 emerges as a significant support level, while the lower boundary of the rising channel is set at 23,100.
The 40-day A/D ratio, which measures medium-term sentiment, has broken through the first oversold line, indicating the potential for movement toward the second line, which represents an extreme oversold zone.
Short-term corrections usually conclude in a typical bull market when the 40-day A/D ratio hits the first line. However, if the correction develops into a longer time or a deeper price correction, significant bottoms are often established when the ratio approaches the second line.
Source: web.strike.money
FIIs' net short positions in index futures have decreased despite the market decline. The absolute short positions (first indicator) haven't reached the initial oversold line, but the long percentage ratio (second indicator) has touched the first line and is now reversing. Typically, when short-term corrections are nearing their end, the long percentage ratio tends to rebound at this point, which we are currently observing. However, it's important to note that we have a monthly expiry coming up next week.
The positioning of FIIs in index futures after expiry will provide clearer insights. If post-expiry, short positions increase and the long percentage breaks the first line, it would indicate that FIIs have maintained their short positions while unwinding their longs.
In terms of price action, the Nifty index faces significant resistance in the near term between 24,550 and 24,750. A break and sustain above this resistance zone would prompt us to consider whether a durable bottom has formed. Until then, some weakness is expected, and FIIs' short positions may fall to the first or second line if selling intensifies.

Source: web.strike.money
Sector Rotation
The Weekly Relative Rotation Graph (RRG) from India Charts showed no big changes. Most sectors are falling in terms of Relative Strength or Relative Momentum.

Weekly RRG
Source: web.strike.money
On the daily time frame, it was a devastating week for all sectors, reducing relative strength and momentum. The only exceptions are Nifty Bank, Financial Services, and IT, which are in the leading quadrant. Pharma, Healthcare, and PSU Banks have slipped into the Weakening quadrant to join the Nifty Metal Index.
The rest of the indices are in the lagging quadrant now.

Daily RRG
Source: web.strike.money
Stocks to watch
Among the stocks expected to perform better during the week are HCL Tech, Persistent, Tech Mahindra, HDFC Bank, CUB, Indian Hotel, and Torrent Pharma.
Among the stocks that can witness further weakness are Astral, Nestle and GNFC.
Cheers,
Shishir Asthana

Discover the latest Business News, Sensex, and Nifty updates. Obtain Personal Finance insights, tax queries, and expert opinions on Moneycontrol or download the Moneycontrol App to stay updated!
Find the best of Al News in one place, specially curated for you every weekend.
Stay on top of the latest tech trends and biggest startup news.


