


Dear Reader,
The People's Bank of China (PBOC) sparked a rally in global equity markets by unveiling an extensive set of measures as part of its stimulus package. The PBOC lowered its reserve requirement ratio by 50 basis points, marking this year's second cut. Additionally, the central bank reduced the seven-day reverse repo rate by 20 basis points to 1.5 percent and slashed the medium-term lending facility rate by 30 basis points to two percent, marking the most significant cut since 2016.
To rejuvenate the real estate sector and boost the economy, the PBOC also announced a rate cut for existing home mortgages and reduced the down payment ratio for second-home purchases from 25 percent to 15 percent.
As a result of the stimulus measures, Chinese stocks surged by 12.8 percent, while the Hang Seng Index posted a 13 percent gain, marking its biggest weekly rise since 2008.
India's benchmark indices rose by 1.22 percent, driven mainly by the metal index, which jumped 7 percent, and the oil and gas index, which climbed 5 percent. However, the broader market did not show the same level of enthusiasm.
In the US, market indices gained an average of 0.6 percent, led by chemicals and materials stocks. Tech stocks also saw gains following news of a potential takeover involving Intel. Also, NVIDIA's CEO announced he would stop selling shares of his company in the market.
European markets also saw strong gains, with the Stoxx 600 closing 2.69 percent higher, buoyed by a robust performance from Germany's market, which rose by 4.03 percent, and France's market, which ended 3.89 percent higher.
Following the lead of the US and China, the Swiss National Bank also lowered its interest rate by a quarter-point to one percent.
The surge in the Chinese market positively influenced Japan, which closed 5.6 percent higher. The Bank of Japan's recent dovish commentary weighed on the yen, boosting the country's equity market.
Chinese stimulus measures also drove metal prices sharply higher during the week.
Overbought market
The Nifty closed higher for the third consecutive week but has reached the upper end of its range on the weekly charts based on the average standard deviation. This level often acts as a significant resistance, and we should be vigilant for any signs of a trend reversal that could signal a potential correction.
With the monthly charts closing on Monday, the RSI (Relative Strength Index) readings for some indices are approaching, or even exceeding, levels seen during the peak of the 2008 bull market. This is crucial for assessing the market's current position and potential future direction.
The charts below highlight that market internals have shown signs of weakness, as the broader market, represented by mid-cap and small-cap stocks, has not participated in the recent rally. Despite Nifty reaching new highs, the broader market indicators have lagged, with the Mid-cap and Small-cap indices continuing to decline even as Nifty advanced.
The persistent negative divergence over the weeks is evident in the chart (see chart Stocks above 50 DMA) tracking the number of stocks within the Nifty 500 trading above their 50-day Moving Average (DMA). This divergence is a potential red flag, as similar patterns in the past (indicated by the arrows) have preceded market corrections. This suggests that if the trend continues, a negative market reaction could occur in the near future.

Stocks above 50 DMA
Source: web.strike.money
Foreign Institutional Investors (FIIs) appear to be maintaining their long positions into the new series, as indicated by the rollover of their positions (refer to the FII Index positioning chart). Currently, we are hovering near the upper grey line, which may now represent the new extreme. Historically, market bottoms have occurred around the lower boundary at -30,000. Given these excessive long positions, there is a need for caution, even as the market continues to rise. However, a confirmed trend reversal through price action is essential before this concern can be validated.

FII Index positioning
Source: web.strike.money
The Put/Call Ratio (PCR) for the market, encompassing both index and stock options, has reached 0.96, a level that has historically coincided with market highs over the past year (refer to the Put/Call Ratio chart). The Open Interest (OI)-based PCR compares the open interest in put options against call options, providing a more comprehensive view of market sentiment. A nine-day moving average of this data is plotted to smooth out fluctuations, offering a clearer picture of overall trends.
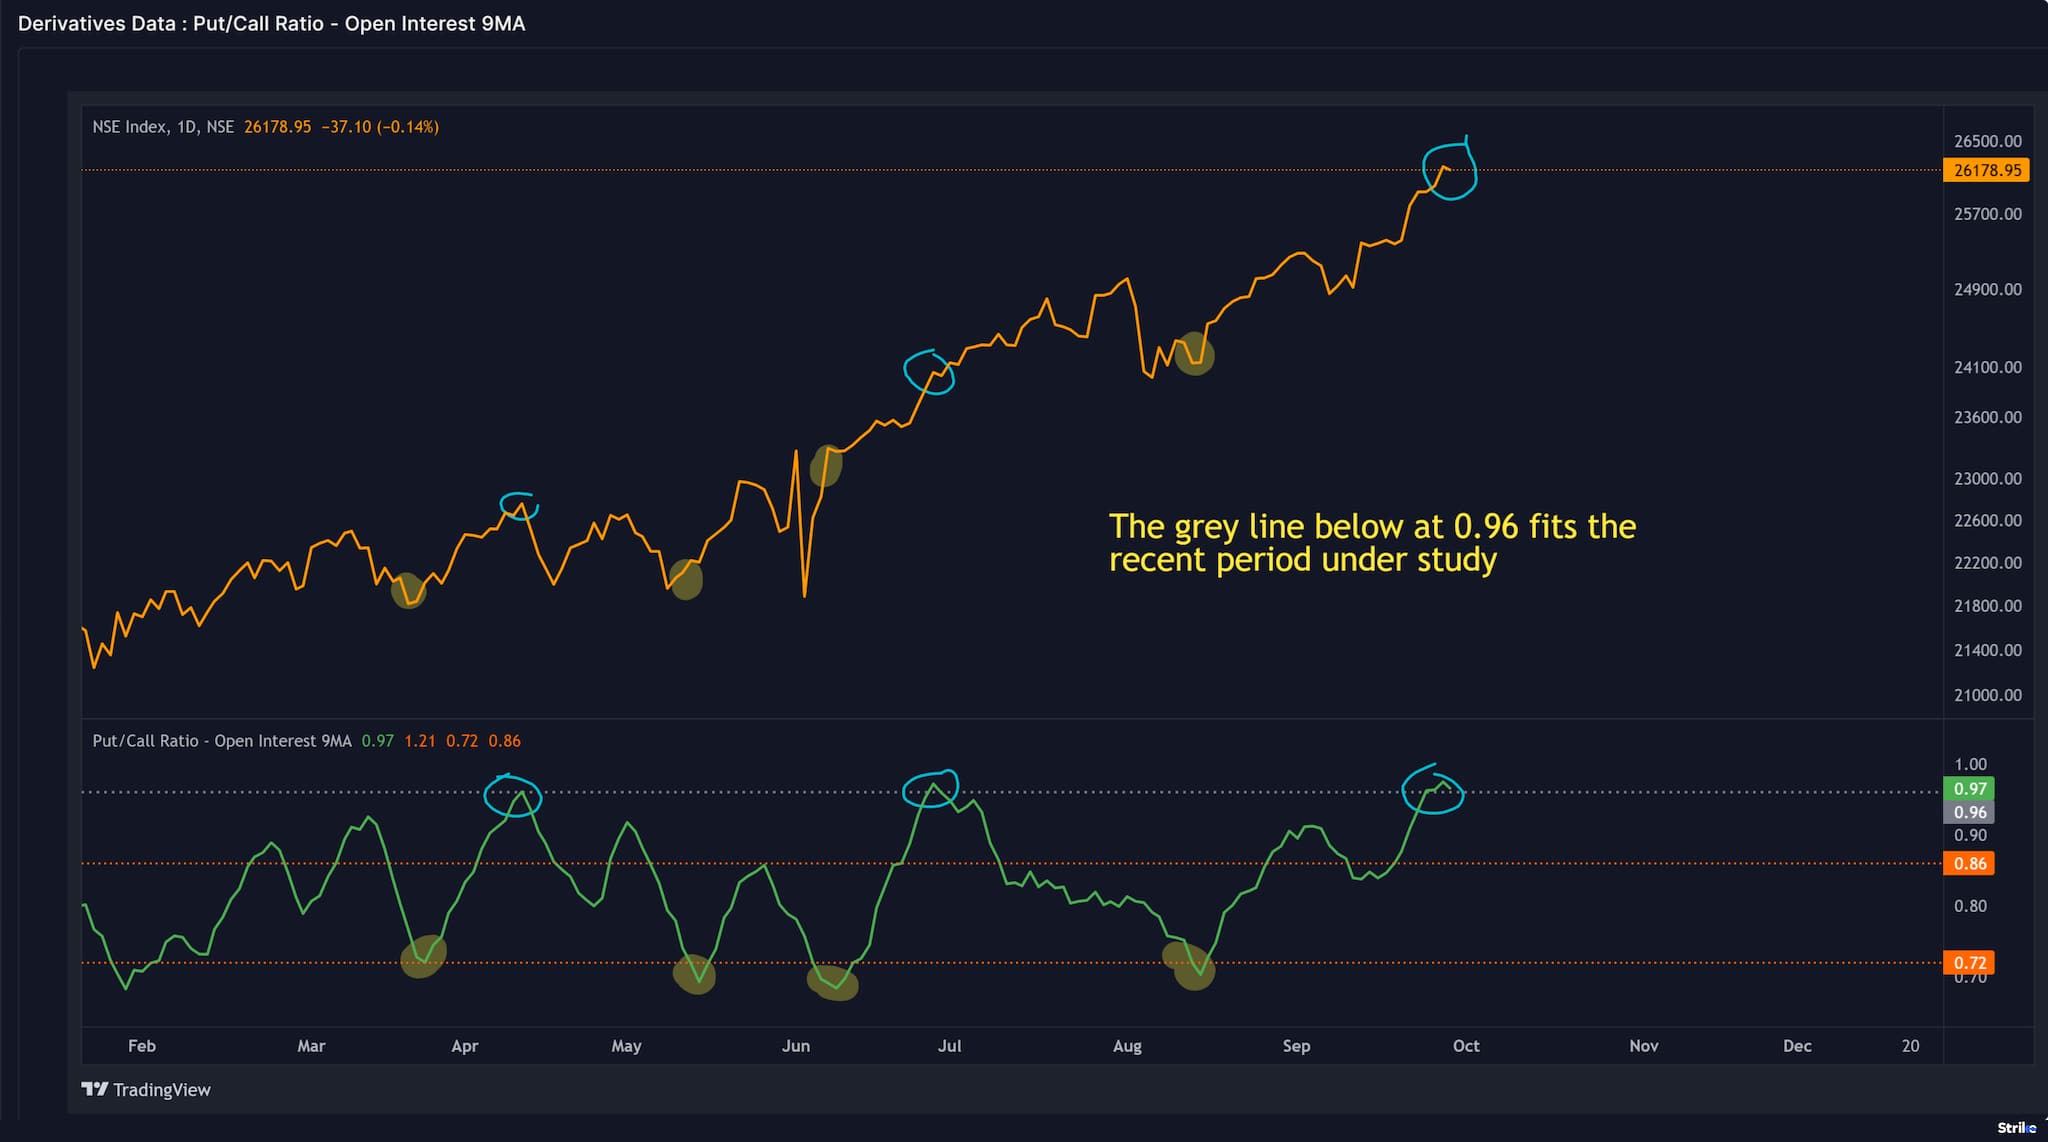
Put Call ratio
Source: web.strike.money
Sector Rotation
The Weekly Relative Rotation Graph (RRG) from India Charts shows that relative momentum has declined in IT and FMCG, while the Metal index shows a pickup.
Weekly RRG
Source: web.strike.money
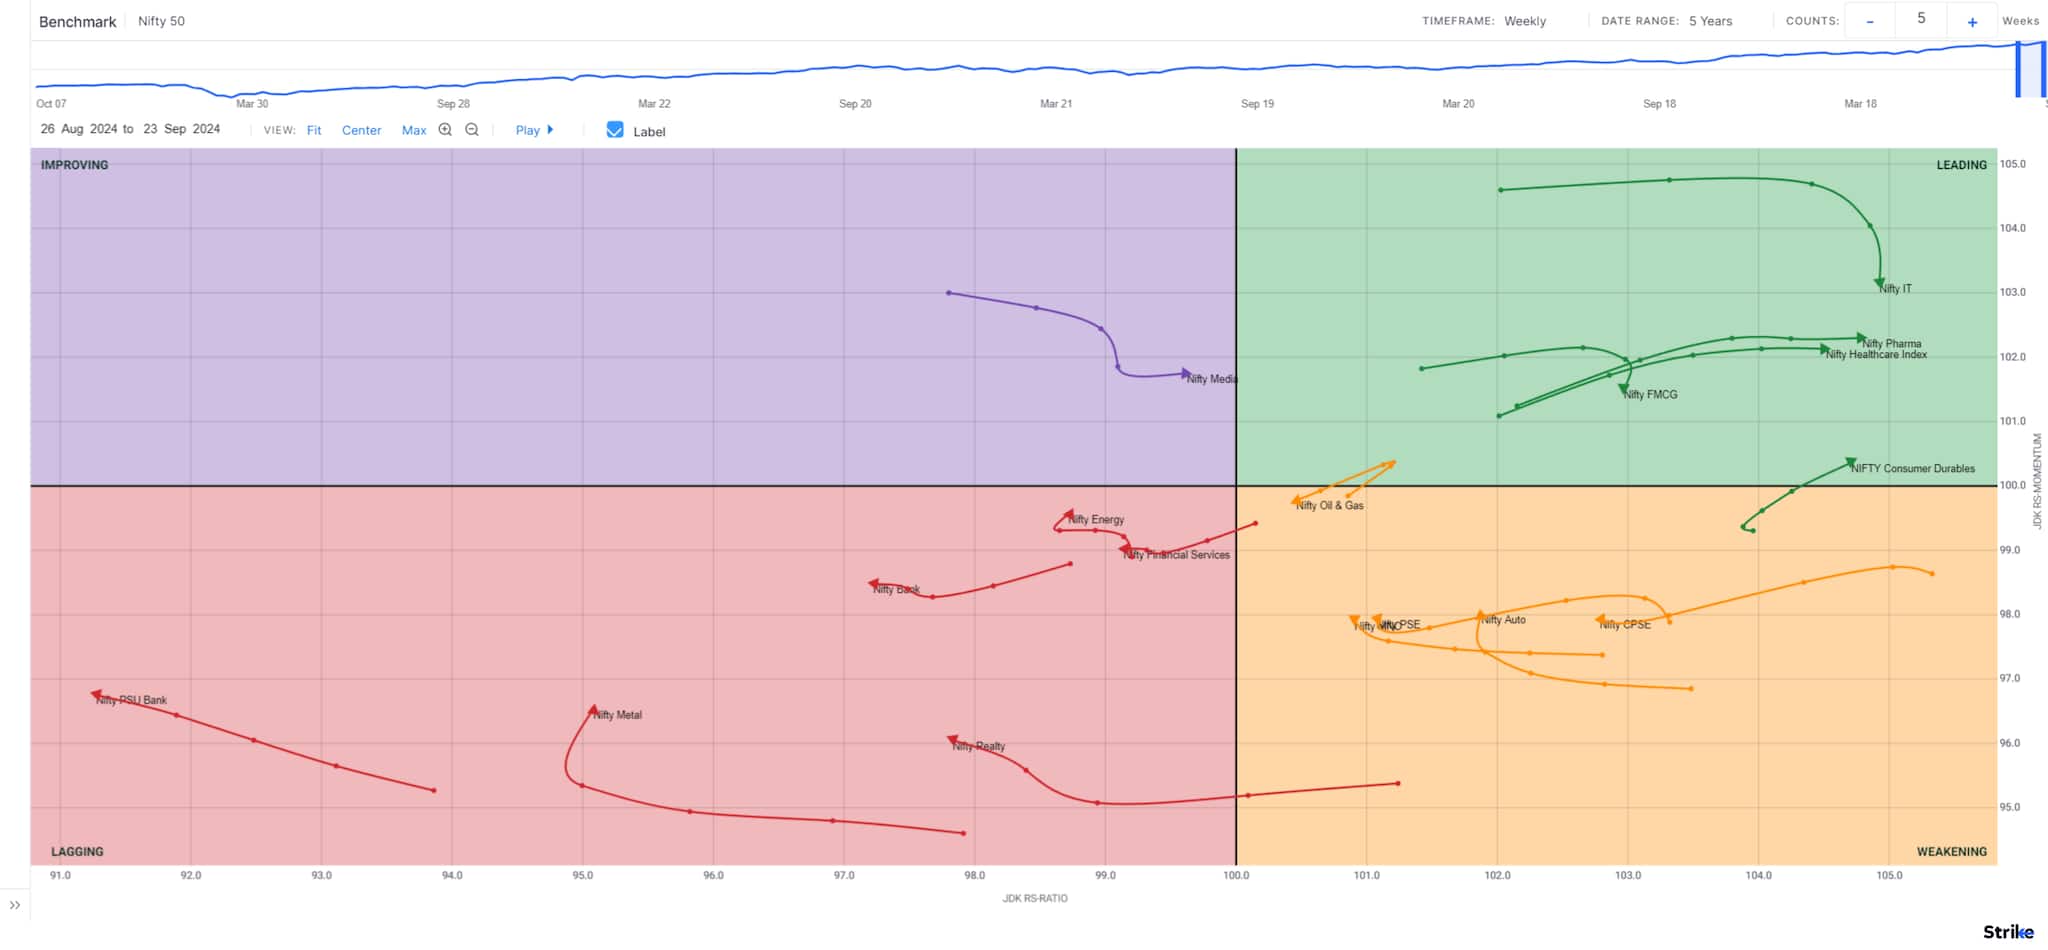
Daily RRG
A positive week for the markets saw all sectors closing in positive territory. Nifty IT, Pharma, and FMCG are now in the lagging quadrant due to loss of momentum and relative strength. Nifty Consumer Durables also lost relative momentum and is now in the weakening quadrant.
Nifty Realty, Auto, and Metal have joined Financials and Realty in the leading quadrant. Nifty CPSE, PSE, PSU Banks, and Energy show increases in relative momentum and are now in the improving quadrant.

Daily RRG
Source: web.strike.money
Stocks to watch
Among the stocks expected to perform better during the week are Cipla, ICICI Prudential Life, Muthoot Finance, Naukri, Trent, Maruti, Indian Hotels and KEC.
Among the stocks that can witness further weakness is RBL Bank.
Cheers,
Shishir Asthana

Discover the latest Business News, Sensex, and Nifty updates. Obtain Personal Finance insights, tax queries, and expert opinions on Moneycontrol or download the Moneycontrol App to stay updated!
Find the best of Al News in one place, specially curated for you every weekend.
Stay on top of the latest tech trends and biggest startup news.


