


Shabbir Kayyumi
What is Inverse Head & Shoulders Pattern?
The Head & Shoulder (H&S) chart pattern is a popular and easy to spot pattern. These patterns are formed due to supply and demand dynamics in the market place. The head and shoulders pattern is believed to be one of the most reliable and popular patterns among the traders' community.
In technical analysis, an Inverse H&S pattern describes a specific chart formation that projects a bullish trend reversal.
Why buy BEL?
An Inverse H&S reversal pattern forms after a down trend, and its completion marks a trend reversal. Recently Bharat Electronics' (BEL) stock price has formed Inverse H&S patterns.
In the standard Inverse H&S pattern, we connect the high after the left shoulder with the high created after the head. A trend line is drawn by connecting these highest points of the two peaks, which is called as “Neckline". This trend line is the most important component of Inverse H& S pattern.
BEL is trading in an up move while forming Inverse H&S pattern and this emerging pattern will be completed on a close above Rs 113 levels. This stock is trading near strong resistance zone standing around Rs 113-115 levels which is tested multiple times earlier and it also suggests a strong bullish bias to continue further after a breakout.
The recent formation of Inverse H&S classical pattern will give a breakout by trading only above Rs 113, suggests buying in the stock for higher targets of Rs 148.
The volume will also add further insight while trading these patterns. Decent volume participation while giving breakout will also give support to Inverse H& S pattern.
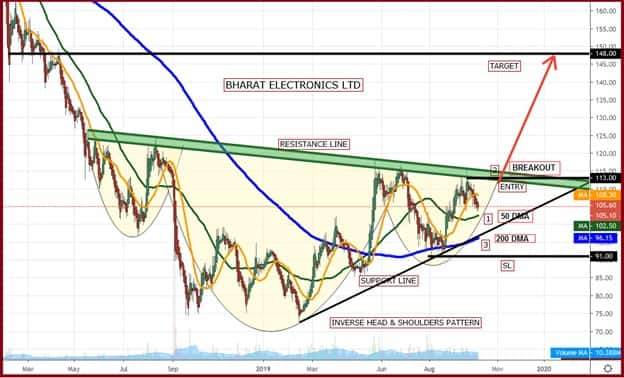 Figure.1. Inverse H&S pattern and buy signal on BEL
Buy Signal:
Profit Booking:
Target as per Inverse H&S pattern is calculated by adding the height of the head (H) to the neckline which comes to 153, however one can book profits near previous swing high which is around 148 levels.
Stop Loss:
Entire bullish view negates on breaching of right shoulder on a closing basis and one should exit from a long position. In the case of Bharat Electronics, it is placed around 91 levels.
Conclusion We recommend buying BEL above Rs 113 levels with a stop loss of Rs 91 for higher targets of Rs 148 as indicated in the above chart.
The author is Head - Technical & Derivative Research at Narnolia Financial Advisors
Disclosure: Narnolia Financial Advisors/Analyst (s) does/do not have any holding in the stocks discussed but these stocks may have been recommended to clients in the past. Clients of Narnolia Financial Advisors Ltd. may be holding aforesaid stocks. The stocks recommended are based on our analysis which is based on information obtained from public sources and sources believed to be reliable, but no independent verification has been made nor is its accuracy or completeness guaranteed. The views expressed in this research report accurately reflect the personal views of the analyst(s) about the subject securities or issues, and no part of the compensation of the research analyst(s) was, is, or will be directly or indirectly related to the specific recommendations and views expressed by research analyst(s) in this report.
Disclaimer: The views and investment tips expressed by investment expert on moneycontrol.com are his own and not that of the website or its management. Moneycontrol.com advises users to check with certified experts before taking any investment decisions.

Discover the latest Business News, Sensex, and Nifty updates. Obtain Personal Finance insights, tax queries, and expert opinions on Moneycontrol or download the Moneycontrol App to stay updated!
Find the best of Al News in one place, specially curated for you every weekend.
Stay on top of the latest tech trends and biggest startup news.


