

Shabbir Kayyumi
Flag Pattern is one of the most popular chart patterns, formed by price action, which is contained within a small rectangle or a channel in the shape of a flag. Flags are short-term continuation patterns that mark a small consolidation before the previous move resumes.
What is 'Flag' Pattern?
A flag chart pattern is formed when the market consolidates in a narrow range after a sharp move. Usually a breakout from the flag is in the form of continuation of the prior trend. Flags give very high risk reward ratio which means relatively small risk and high and quick profits.
The flag pattern could be bullish or bearish pattern. Flags can be seen in any time frame but normally consist of about five to 15 price bars.
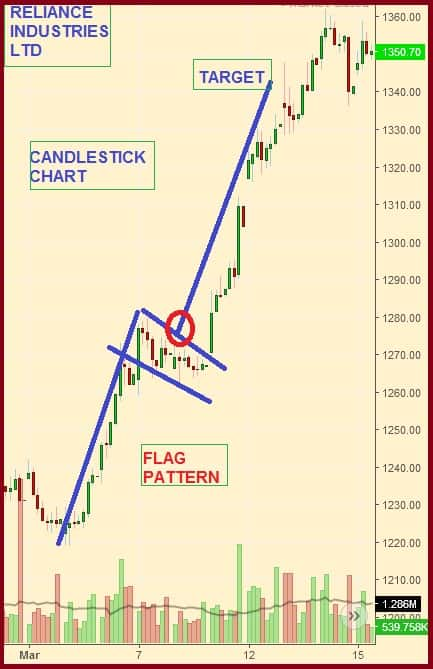 Figure .1. Illustration of Flag Chart Pattern
Flag patterns are an integral part of technical analysis, but successful traders combine it with other forms of technical analysis to maximize their odds of success.
A flag can be used as an entry pattern for the continuation of the established trend.
Formation of the Flag Pattern
> There are pressure areas in a stock chart, which may be a minor support or resistance, or it may even be a minor target point. In this zone some traders book profit; however the trend remains unchanged. This may result in a small swing or the price may remain flat. Both the support and resistance lines are either horizontal or sloping downwards in an uptrend or sloping upwards in a down trend, forming flag.
> These patterns are usually preceded by a sharp advance or decline with heavy volume, and mark a midpoint of the move.
> The pattern has a “flag” appearance because the small rectangle is connected to the pole (the large and swift move).
> The move which precedes the flag portion of the pattern (the pole) must be a sharp move, nearly vertical.
> Flags are often considered continuation patterns, meaning that the breakout tends to theoretically occur in the direction of the preceding move.
> The formation usually occurs after a strong trending move that can contain gaps.
> The pattern usually forms at the midpoint of a full swing and consolidates the prior move.
Trading with Bullish Flag
> Flag Buy Signal - When the price has moved higher and prices have consolidated, creating a channel of support and resistance, a potential buy signal is given when prices penetrate and close above the upward resistance line.
> The pattern has completed when the price breaks out of the containing trend lines in the direction of the prevailing trend, at which point it will likely continue its course.
> Targets: The length of the flagpole can be applied to the resistance line of the flag to estimate the advance or target area.
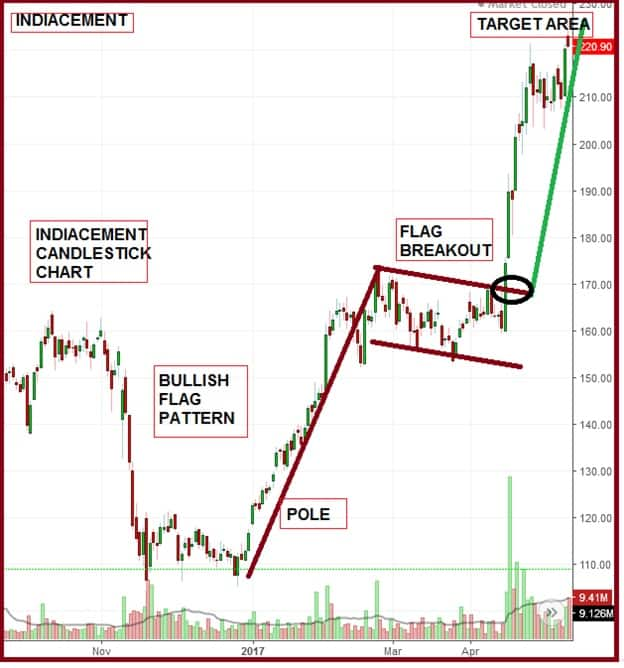 Figure .2. Trading with Bullish Flag Pattern
> The sideways period is often followed by another sharp rise. This is where the trading opportunity comes in. Once the flag pole and a flag or have formed, traders watch for the price to breakout above the upper flag/trend line. When this occurs, enter a long trade.
Trading with Bearish Flag
> Flag Sell Signal - Assuming prices previously moved downward, then after a period of price consolidation, a potential sell signal is given when price penetrates and closes below the support line.
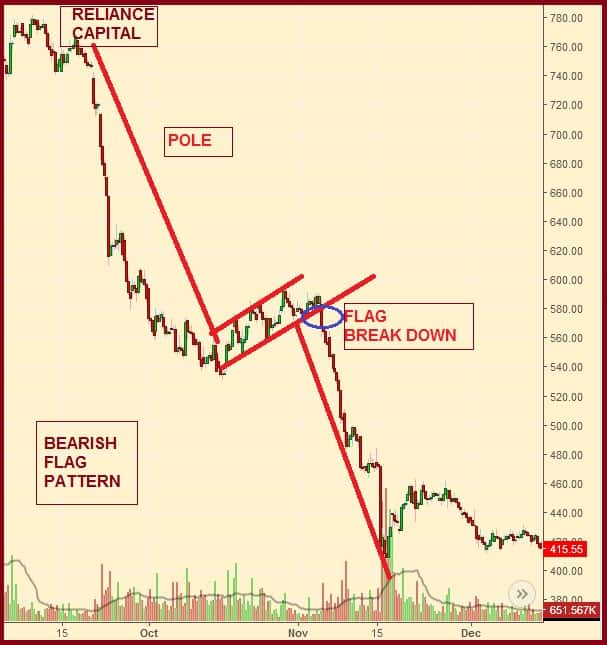 Figure .3. Trading with Bullish Flag Pattern
> If a short trade is taken on the downside breakout, place a stop loss above the high of the flag. > Targets: The length of the flagpole can be applied below the support line of the flag to estimate the decline or target area.
Volume and Flag Pattern
Volume can also add further insight while trading these patterns. Volume is invaluable when confirming any of the two flag pattern break out to upside or downside. If volume isn’t present alongside patterns breakouts, then the resulting trading signal isn’t as reliable.
While observing volume with flag pattern, there is high volume while forming the pole, then lowering of volume while forming mast then after again rising of volumes while breakouts.
Conclusion
> Flag patterns are a commonly used-technical analysis tool and majorly a choice of breakout traders and swing traders. > Flag is formed when there is a minor profit booking in either an uptrend or a downtrend. > The pole is formed by a line which represents the primary trend in the market. > It is important that flags are preceded by a sharp advance or decline.
The author is Head - Technical & Derivative Research at Narnolia Financial Advisors Ltd.Disclaimer: The views and investment tips expressed by investment expert on moneycontrol.com are his own and not that of the website or its management. Moneycontrol.com advises users to check with certified experts before taking any investment decisions.

Discover the latest Business News, Sensex, and Nifty updates. Obtain Personal Finance insights, tax queries, and expert opinions on Moneycontrol or download the Moneycontrol App to stay updated!
Find the best of Al News in one place, specially curated for you every weekend.
Stay on top of the latest tech trends and biggest startup news.


