


On the monthly chart, the Nifty is maintaining its higher top, higher bottom pattern, which tells that the positive trend is still intact for the longer term.
On the weekly chart, prices have taken resistance from the downward slopping trend line for the fourth time since October 2021 and is forming an outside candlestick pattern, which here indicates an increase in the volatility by the prices.
Prices on daily time frame have taken support from 23.6 percent Fibonacci retracement level of its prior advance from (July 20, 2022) 15,183.40 level till 17,992.20 (August 19, 2022)
RSI (relative strength index) plotted on the daily and the weekly timeframe is above 50 mark which reflects the strong momentum in the index.
The index has its immediate support placed at the level of 17,150 (multiple touch point) and 16,919 (38.2 percent Fibonacci retracement) of prior advance. On the other hand, the resistance is placed at the level of 17,777 (swing high) followed by 18,000 (key resistance).
Looking at the overall chart pattern, we feel that the overall trend is positive and index may attempt to go higher till the level of 17,777 & 18,000 level. Our bullish view would be negated if we see prices sustaining below the level of 17,150.
Here are three buy calls for next 2-3 weeks:
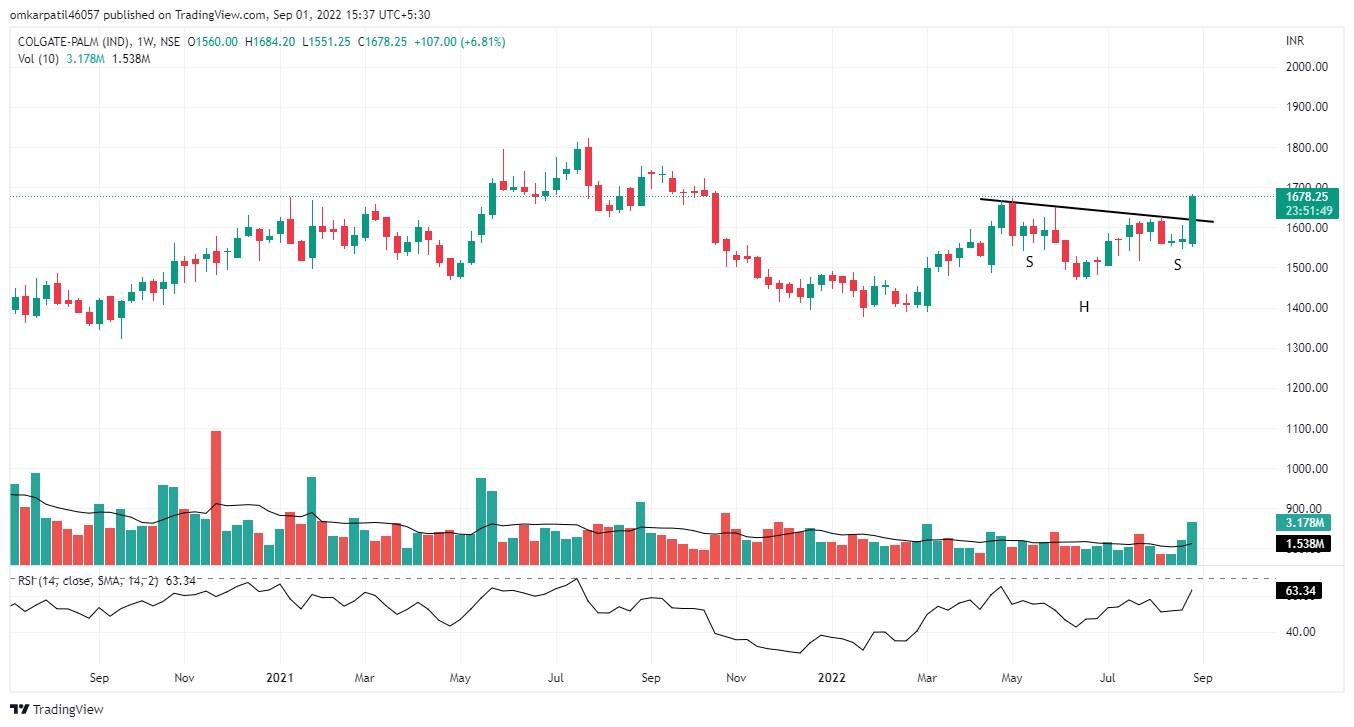
Colgate Palmolive: Buy | LTP: Rs 1,678.25 | Stop-Loss: Rs 1,584 | Target: Rs 1,830 | Return: 9 percent
Prices of Colgate Palmolive, on the monthly charts is currently at its 11 months high level, indicating strong positive undertone of the stock.
In the latest week, prices gave a breakout from the Inverse Head and shoulder pattern with high volumes, which indicates a continuation of the prior uptrend.
Prices have sustained above upper Bollinger band on daily timeframe which tells that the volatility in prices are rising for up move.
RSI plotted on the weekly timeframe have sustained above 50 mark which tells that the stock has strong momentum in the prices.
We recommend to buy this stock for the target level of Rs 1,830 with stop-loss on the closing basis at Rs 1,584.
Ashok Leyland: Buy | LTP: Rs 162.75 | Stop-Loss: Rs 137 | Target: Rs 192 | Return: 18 percent
On weekly chart of Ashok Leyland, we can observe that the stock is currently trading at its 52-week high level, this tells that the stock already is in a good momentum.
Prices after breakout from Inverse Head and Shoulder Pattern on July 2022, retested the above pattern’s neckline and have shown a bounce which indicates continuation of the prior uptrend.
The Bollinger Band on the Daily timeframe have started to expand with volume participation indicates that the volatility in the underlying is increasing for upside move.
RSI plotted on weekly and daily timeframe have sustained above 50 mark which tells that the prices are in strong momentum.
We recommend to buy this stock for target of Rs 192 with stop-loss at the level of Rs 137 on the closing basis.

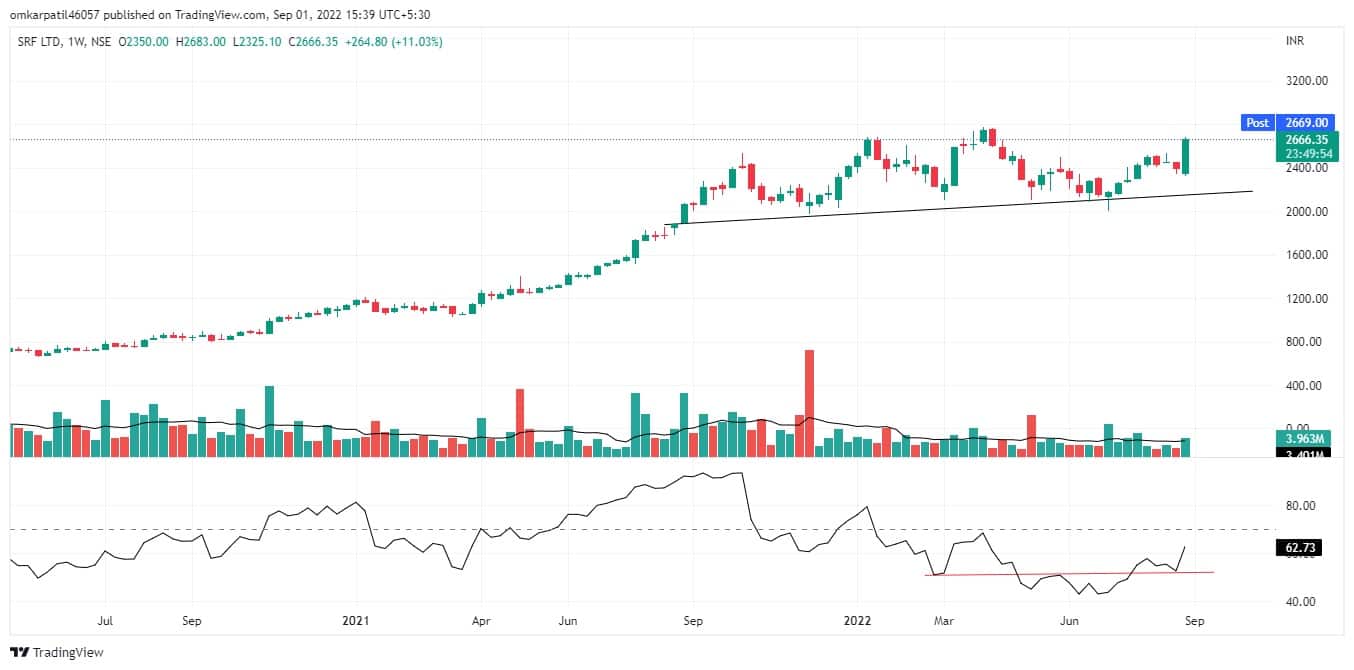
SRF: Buy | LTP: Rs 2,666.35 | Stop-Loss: Rs 2,325 | Target: Rs 3,100 | Return: 16 percent
On weekly chart of SRF, we can observe that the stock is currently trading at its 52-week high level, this tells that the stock already is in a strong up trend.
Prices in the latest week gave a breakout from the A-B-C pattern which indicates beginning of trend on the upside.
Bollinger band on the daily timeframe have started to expand which tells that the volatility in the prices are rising for upside move. RSI on the weekly timeframe have shown a range shift which reflects the rising momentum in the stock prices.
Going ahead we expect the prices to go higher further till the level of Rs 3,100 where the stop-loss must be at the level of Rs 2,325 on the closing basis.
Disclaimer: The views and investment tips expressed by investment experts on Moneycontrol.com are their own and not those of the website or its management. Moneycontrol.com advises users to check with certified experts before taking any investment decisions.

Discover the latest Business News, Sensex, and Nifty updates. Obtain Personal Finance insights, tax queries, and expert opinions on Moneycontrol or download the Moneycontrol App to stay updated!
Find the best of Al News in one place, specially curated for you every weekend.
Stay on top of the latest tech trends and biggest startup news.


