


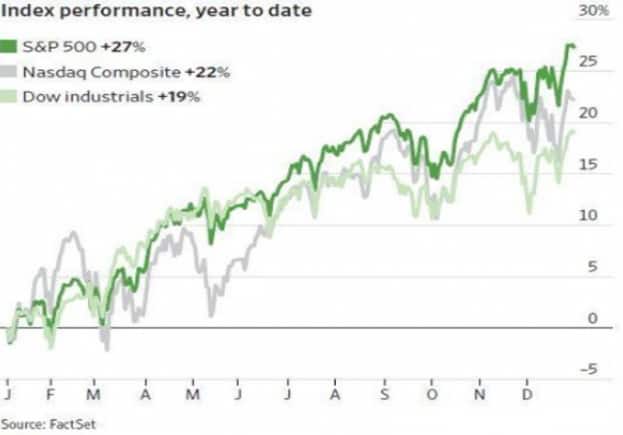
What a year it has been! The global COVID-19 cases are at record high, U.S. inflation at a 39-year high and the Fed is on track to raise rates in the current year. The U.S. markets, however, have been able to climb the wall of worry with the S&P 500 posting its 7th double-digit gains in the last 10 years, while all the 11 S&P 500 sectors finished the year in positive territory. The S&P 500 index gained about 27%, the tech-heavy Nasdaq Composite was higher by 22% and the Dow Jones Industrial index saw gains of 19% to end the year. 2021 was a good year for the bulls, as strong global growth, negative real bond yields and positive earnings revision saw the U.S. equity markets outperform.
Exhibit 1: Top Index performances in 2021| Nasdaq | 15,644.97 | 21.39% |
| S&P 500 | 4,766.18 | 26.89% |
| Dow Jones | 36,338.30 | 18.73% |
| 10-year Treasuries | 1.51% | 59.7bps |
| Bitcoin | $47,124 | 59.12% |
| Oil | $75.73 | 55.50% |
Source: FactSet.com, Data as of December 31, 2021
U.S. markets outperform MSCI All-country World ex-US index for 2021The S&P 500 index has surged almost 27% in 2021 which demonstrates that the U.S. stocks outperformed the rest of the world. According to Bloomberg calculations, the index has surged higher as compared to a 3% gain from the MSCI All-country World ex-U.S. index (chart below).
Exhibit 2: S&P 500 returns vs. MSCI World index ex-U.S. 2021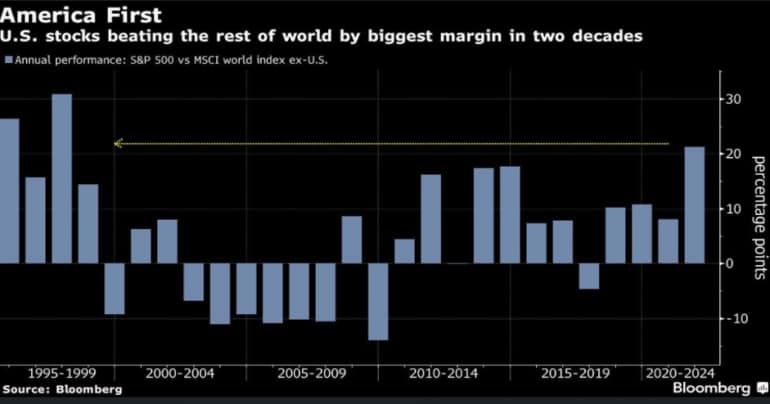
Source: Bloomberg.com, Data as of December 31, 2021
The U.S. accounted for a 44% share of the aggregate global market capitalization in 2021The U.S. stock markets are by far the largest in the world with an aggregate global stock market capitalisation of 44.15% reported at the end of 2021 as per data from Bloomberg. As shown below, the U.S. has seen its share of world market cap. increase by 2.84% in 2021. This however, shouldn’t come as a huge surprise given that the U.S. market has outperformed nearly every major country stock market this year.
Exhibit 3: World stock market capitalisation by country as of end of 2021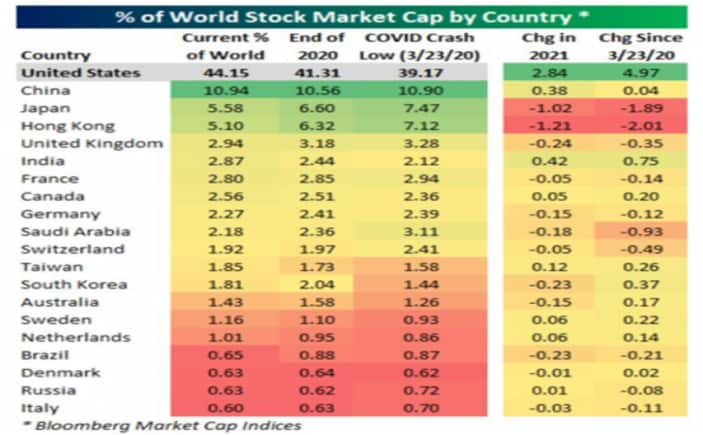
Source: Bloomberg.com, December 2021
The S&P 500 index ends the year at new highsThe S&P 500 index recorded its best December since 2010 as the “Santa Claus rally” lifted the U.S. stocks to record highs, even while trading was exceptionally lower during the month, to end the year. The index ended the year with gains of 26.9% in terms of price and a total return of 28.7% (including dividends). Over the last three years, the S&P 500 has more than doubled (+100%) which has been its highest three-year return since 1997-99. As shown in the graph below there were three down months during the year: January (-1.1%), September (-4.8%) and November (-0.8%). The best has been the seven months between February and August when the index gained about 21% with no down months.
Exhibit 4: Month-wise S&P 500 index returns in 2021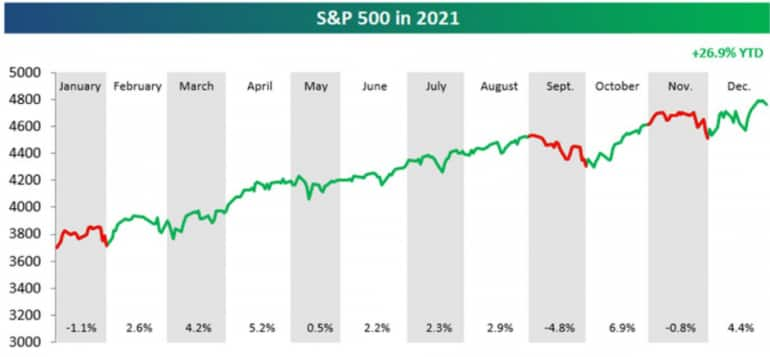
Source: Bespokepremium.com, January 2022
Small cap index added to the 2021 rally tooThe S&P Small Cap 600 Index generated returns of almost 25% from the start of the year until now – in-line with the broader market rallies seen in the S&P 500 index over the same period.
Exhibit 5: S&P 500 Small Cap 600 Index performance 2021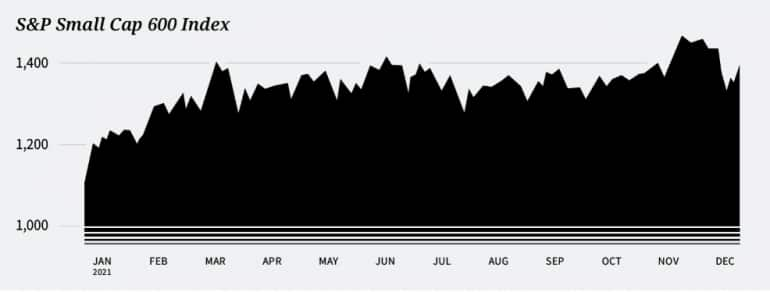
Source: Bloomberg.com, December 31, 2021
All the 11 S&P 500 sectors posted double-digit annual returns in 2021Among the sectoral winners, the S & P 500 Energy index is 2021’s biggest winner – gaining about 48% after being the worst performer in 2020. This is followed by the Real Estate sector which posted gains of over 42% for the year. Technology and Financials were also among the top sectoral gainers for 2021 with more than 30% gains from each of these sectors (graph below). Technology, innovation and disruption seems to be all over the place and we discovered new terms like NFTs (Non-Fungible Tokens), metaverse and Decentralized Finance (DeFi) during the year.
Exhibit 6: S&P 500 sectoral performance and crude oil returns 2021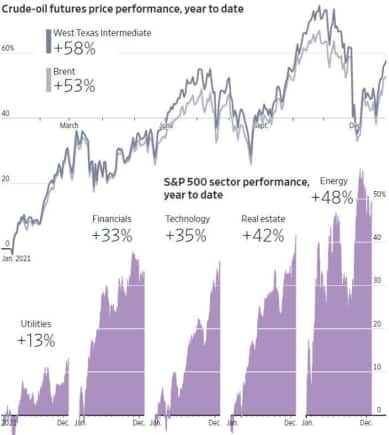
Source: WSJ, December 30, 2021
35% of the S&P 500 index’s returns has come from five stocksStocks like Alphabet (GOOGL), Apple(AAPL), Meta Platforms (FB) and Tesla(TSLA) were among the top gainers on the Nasdaq Composite index. The chart below explains the weight of the top five companies on the index. Home Depot (HD) and Microsoft (MFST) were the top gainers on the Dow Jones index. Additionally, the combined market capitalisation of the FAANGM stocks has hit a fresh all-time high of $11.2 trillion. In 2021 alone, the FAANGM stocks have gained over $3 trillion in market cap.
Exhibit 7: Share of Top five companies vs. rest of the S&P 500 index, 2021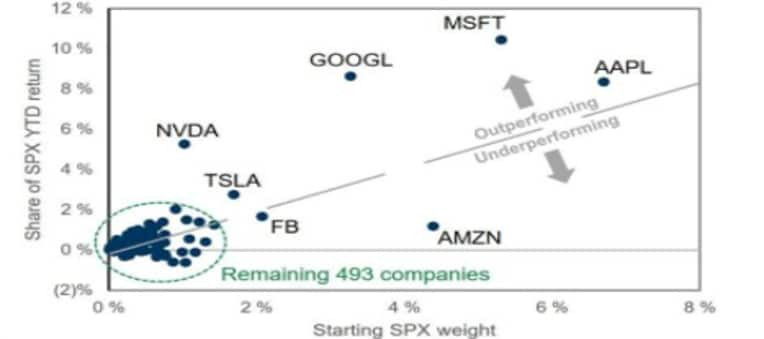
Source: Goldman Sachs Report, December 30, 2021
Exhibit 8: Top gainers in the S&P 500 index apart from the FAANGM stocks| Stock | Ticker | 2021 Returns |
| Devon Energy | DVN | 198% |
| Marathon Oil | MRO | 150% |
| Fortinet | FTNT | 146% |
| Signature Bank | SBNY | 141% |
| Ford Motor | F | 137% |
| Nvidia | NVDA | 132% |
| Diamondback Energy | FANG | 132% |
| Bath & Body Works | BBWI | 131% |
| Moderna | MRNA | 130% |
| Nucor | NUE | 118% |
Source: Yahoofinance.com, December 31, 2021
Meta, Tesla were among the companies that defined 2021As put together by visual capitalist, these handful of companies defined the U.S. markets in 2021. Several metricS were looked upon to select these companies including google search and news volumes or be it performance relative to its competitors, industry-specific indicators and more. Most of these companies (graph below), are digital companies which have massive reach, scale and influence. Interestingly many of these companies were also embroiled in controversies along with their successes in 2021.
Exhibit 9: Companies that defined 2021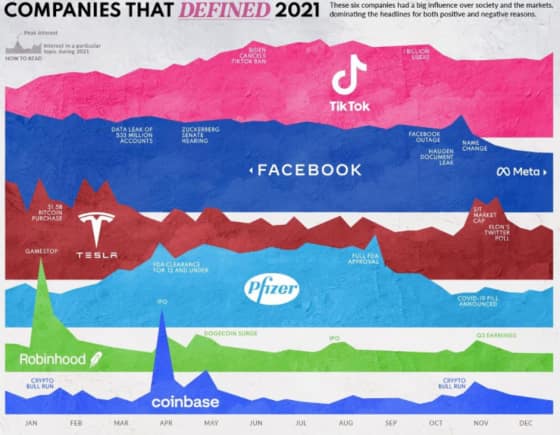
Source: Visual Capitalist.com December, 2021
U.S. public listings surpassed the record $1 trillion in 2021The year 2021 has seen some impressive number of companies going public on the U.S. exchanges which surpassed a record $1 trillion mark in value. According to data from PitchBook, there have been over 980 deals after the recent EV major Rivian (RIVN) added nearly $56 billion in exit value during its listing in November last month. The breadth and depth of today’s IPOs, SPACs and direct listings have far exceeded the public debuts of some of the contemporary tech giants. Amazon (AMZN) was valued at $333 million in its IPO in 1997 and Tesla (TSLA) was worth $1.31 billion when it was listed in 2010. However, the trillion-dollar figure may undercount the current value of 2021’s U.S. market listings. Additionally, the U.S. IPO market has mirrored sky-high valuations across the board with the market capitalisation of Apple (AAPL) touching $3 trillion earlier this month and Microsoft (MFST) worth more than $2 trillion while Alphabet (GOOGL), Amazon (AMZN) Tesla (TSLA) and Meta (FB) all trading at $1 trillion plus market capitalisation.
Exhibit 10: U.S. public listings by type, 2021
Source: Pitchbook.com, December 2021
Coinbase and Rivian’s IPOs remained the most valued public listings in 2021During the year, Coinbase’s (COIN) direct listing in April surpassed the $85.8 billion valuations followed by Rivian (RIVN) with over $60 billion and Roblox’s (RBLX) $45 billion plus valuations in March, which was the second and the third largest IPO valuations respectively. Several other offerings including UiPath (PATH), AppLovin (APP) and Toast (TOST) were all valued at over $10 billion in the public offerings in 2021. (Graph below)
Exhibit 11: Most valuable U.S. public listings of 2021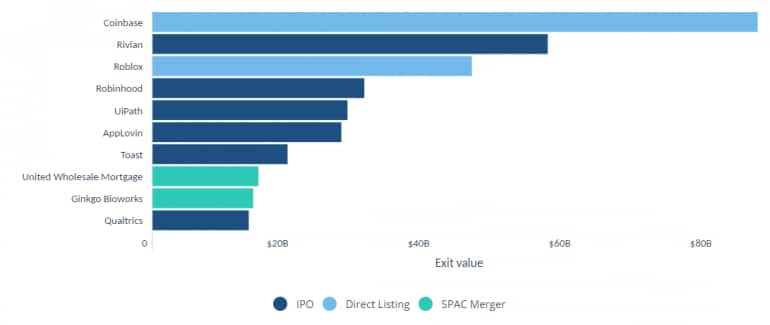
Source: Pitchbook.com, December 2021
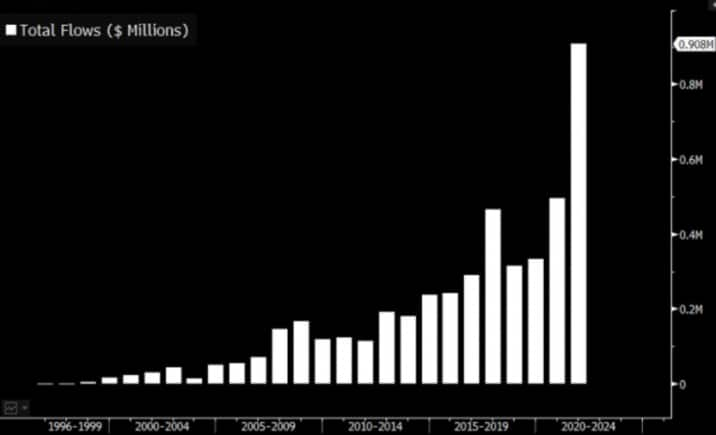
A huge year for new ETF launches and record inflowsOut of the total 600 new ETF launches seen in 2021, about 445 ETFs were in the U.S. alone – which is about 67% higher than the previous annual record. Net inflows were 80% higher than the previous record. According to Bloomberg, the 2021 ETFs flows was around $908 billion, which is second to none when we look at the historical flows (chart below). December 2021 saw the strongest inflow of $100 billion (a monthly record) with most of the inflows seen in S&P 500 index ETFs, accounting for nearly one-third of the total inflows during the year.
Exhibit 12: New ETF launches and total inflows in 2021
Source: Bloomberg.com, January 2022
Most of the energy ETFs performed well in 2021Although over one-third of the inflows in the year were towards the index ETFs, there was also considerable interest seen in the Energy ETFs in 2021. A handful of ETFs have even outperformed the broader market index returns during the year. There were also some smaller funds which did remarkably well such as the Breakwave Dry Bulk Shipping ETF (BDRY) which surged over 180% during the year. Some of the best performed ETFs of 2021 are listed below.
Exhibit 13: Some of the best-performing ETFs in 2021| ETF | Ticker | 2021 Returns |
| United States Oil Fund | USO | 58% |
| Global X Uranium ETF | URA | 53% |
| Fidelity MSCI Energy Index | FENY | 47% |
| Vanguard Energy ETF | VDE | 48% |
| SPDR S&P Oil & Gas Exploration ETF | XOP | 61% |
| VanEck Rare Earth Metals ETF | REMX | 65% |
| KraneShares Global Carbon Strategy ETF | KRBN | 97% |
Source: Yahoofinance.com, December 2021
Crypto market saw another explosive yearThe Crypto currencies overall had an impressive year, although it continues to remain highly volatile. The price of Bitcoins gained about 60% in 2021 when it began trading at $29,000 at the start of the year and reached an all-time high of $69,000 in November this year to currently trading the $50,000 levels to end the year. The amount of capital that came in to other cryptocurrencies were also quite impressive this year, with Ethereum up nearly 500% this year and Solana up a whopping 12,500% in 2021 which greatly outpaced the Bitcoin’s returns while the Non-Fungible Tokens (NFTs) emerged as one of the hottest markets during the year.
Exhibit 14: Bitcoin prices during the year 2021
Source: Bloomberg.com, December 2021
Corporate earnings hit a new all-time highCorporate earnings recovered very well after the big declines during the pandemic in 2020 and hit a new all-time high in 2021. For the full year, S&P 500 index companies are expected to have an earnings growth of 45.1% for CY2021 as per data from FactSet – which marks the highest annual earnings growth rate reported by the index since 2008 (graph below). Earnings have been bolstered by increased consumer demand and higher productivity as businesses were able to reduce costs in a more virtual environment.
Exhibit 15: Full year earnings and revenue growth estimates for S&P 500 companies, CY2021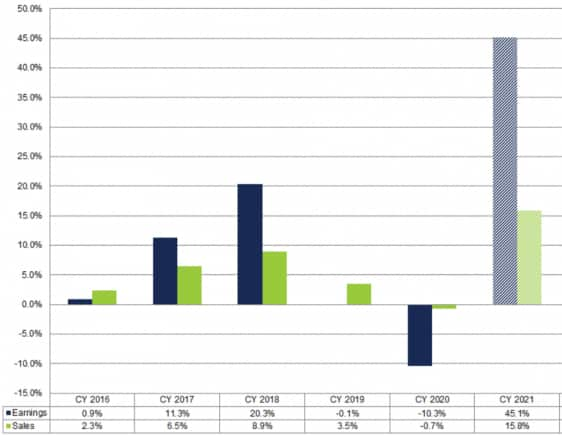
Source: FactSet Insights, December 30, 2021
Valuations remain high with a forward P/E of 21.18 for the S&P 500 indexThe U.S. equities moved higher in 2021 which was characterised by range-bound valuations and rising earnings expectations. The Forward P/E for index now stands at 21.18x – higher than the 25-year average of 16.83x (graph below). The stock prices based on current forward P/E ratios still look elevated although they have come-in-in-line with the earnings so far.
Exhibit 16: S&P 500 index - Forward P/E ratio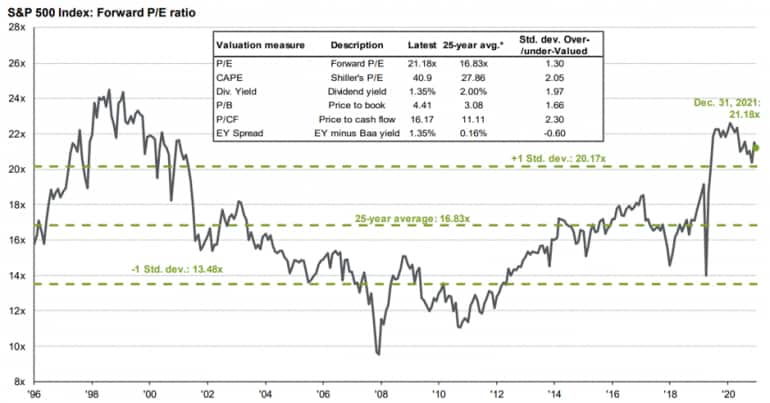
Source: J.P Morgan Report, December 31, 2021
Fixed income and treasury yieldsThe U.S. 10-year Treasury yield, which is the benchmark and most widely traded bond, ended the year with gains of 59.7 basis points at 1.51%. However, when we consider inflation for the year, the real 10-year U.S. Treasury yields were negative for the year at -3.45%. (graph below)
Exhibit 17: U.S. 10-year Treasury: Nominal and real yields 2021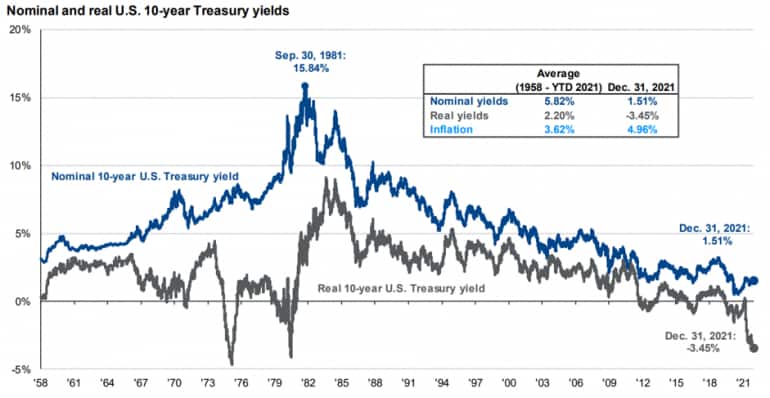
Source: J.P Morgan Report, December 31, 2021
Commodities were among the best asset class during the yearAmong the other assets, commodities were the best performing asset class in 2021 as oil prices (WTI) surged over 55% for the year, and Crude oil prices ended the year at a high of about $75 per barrel. Agricultural commodities gained too, while copper was higher by over 26% during the year. However, precious metals were the laggards for the year in dollar terms while Gold was down 5% and silver gave up over 11% for the year. However, the Dollar index gained 6.8% to end the year.
Exhibit 18: Various asset class performance in 2021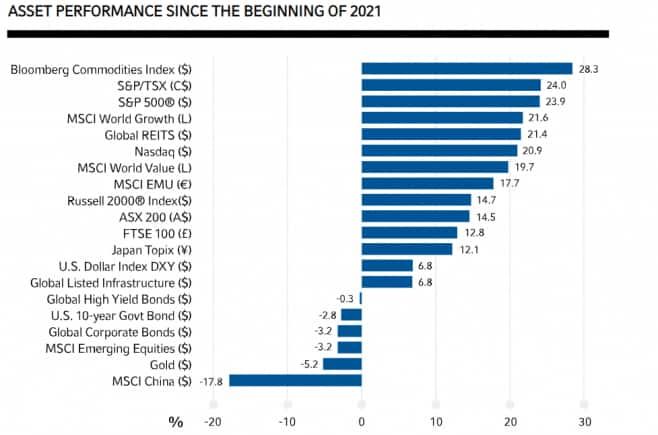
Source: Russellinvestments.com, December 2021
The pandemic’s impact on the economy has largely reducedAfter the return-to-normalcy seen post the summer in 2021, the new COVID-19 variant, Omicron, has caused cases to rise in the winter before the close of the year. The path of the pandemic has largely been difficult with the onset of the Delta variant during fall and now the Omicron variant of the pandemic. However, its impact on the economy and largely markets has reduced as businesses and workers had adapted to operating in a pandemic environment all through the year. It is estimated that the combination of vaccinations and infections has largely left close to 90% of the country with some immunity to the virus.
Exhibit 19: Covid-19 and vaccination progress in 2021
Source: J.P Morgan Report, December 31, 2021
The Fed’s monetary policy: Hawkish tone to tackle inflation woesThe Fed continued to maintain a zero-interest rate environment all through the year, in-line to support economic growth which led to easy liquidity in the system thus leading to some asset bubbles in Equities and other asset classes. This environment also led to a steep rise in costs and U.S. inflation to touch a 39-year high. In order to tackle the inflation woes, the Fed decides to stick to its more hawkish tone before ending the year 2021 announcing its doubling of the tapering. (Monthly bond buying activity) to $30 billion per month from the previous $15 billion made in November 2021 which is likely to end by March 2022.
Exhibit 20: The Fed and interest rates
Source: Bloomberg, FactSet.com, December 2021
U.S. inflation rose to 6.8%, the highest levels before the end of 2021The annual inflation rate in the U.S. grew to 6.8% in November 2021, which was in line with the forecasts and marked the 9th consecutive month of inflation that was above the Fed’s target rate of 2%. The steep rise in these numbers is largely attributed to global commodities rally, increasing demand, wage pressures, supply chain disruptions along with a lower base effect from 2020 which continued to push prices higher. Energy costs largely contributed to upward pressure on inflation numbers with over 33% gains seen in October. The inflation numbers excluding food and energy was reported at 4.9% in November from the previous 4.6% which was the highest since 1991.
Exhibit 21: Month-wise headline inflation for 2021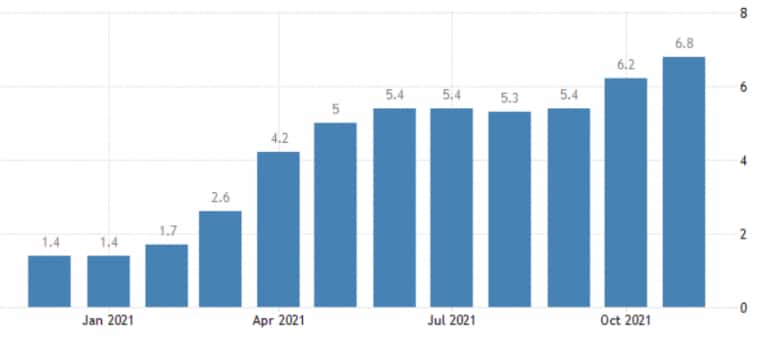
Source: Trading economics, December 2021
Unemployment numbers improved and wages were higher in 2021The U.S. labour market saw a huge improvement over the course of 2021 with the unemployment rate falling to 4.2% to end the year from the previous 4.6% seen in October 2021 (graph below) and from 6.7% seen in December 2020. This was well below the market expectations of 4.5% and was also the lowest jobless rate since the start of the pandemic in March 2020. Additionally, the labour force participation rate edged higher up to 61.8% in November which was also the highest level since March 2020, and the growth in wages has remained higher during the year.
Exhibit 22: Unemployment numbers and wage growth 2021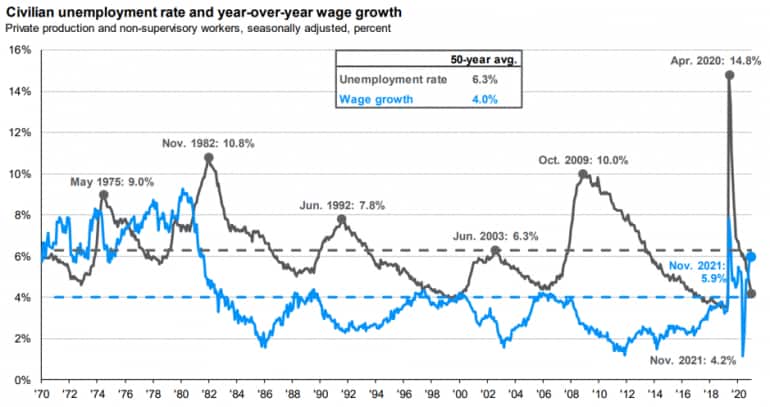
Source: FactSet, JPMorgan Report, December 2021
Exhibit 23: Month-wise unemployment numbers, 2021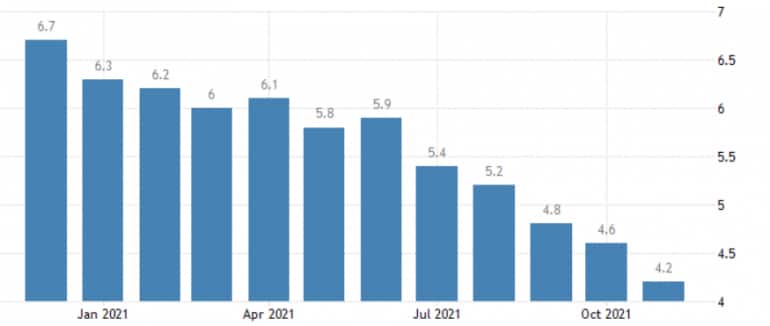
Source: Tradingeconomics.com, December 2021
Conclusion2021 was another exceptional year for the U.S. equity markets which was supported by the accommodative Fed and its fiscal and monetary policies. The economic rebound along with strong corporate earnings that started in 2020 carried over well into 2021 lifting the markets to record highs. The 2021 returns were largely driven by earnings growth which marked the highest annual earnings growth rate of 45.1% for 2021 according to FactSet. U.S. markets have outperformed all other major indexes with the S&P 500 gaining almost 27% for the year even as the pandemic continued to remain a major risk factor all through the year. The rollout of mass vaccinations have likely given way to some of the positive sentiments in the markets in 2021.
About The Author:
Menaka Reddy heads the Investment Research department for Stockal and has over 15 years of experience in Indian and U.S. Equity markets. She holds an MBA in Finance and has been consistently publishing research articles with Stockal, apprising investors about the latest insights in the U.S. markets.Discover the latest Business News, Sensex, and Nifty updates. Obtain Personal Finance insights, tax queries, and expert opinions on Moneycontrol or download the Moneycontrol App to stay updated!


