


The market continued to witness profit booking-led selling pressure for another session, with the Nifty 50 falling 96 points and breaking its six-day winning streak on October 24. This signals a pause in momentum and suggests that the index may have entered a consolidation phase in the short term, possibly before resuming its uptrend. A decisive fall below 25,700, the immediate support, can open the door to 25,500, a crucial support level, which could strengthen bearish momentum. On the higher side, the 25,900–26,000 zone is likely to act as resistance, as sustaining above this range could revive bullish sentiment, experts said.
Here are 15 data points we have collated to help you spot profitable trades:
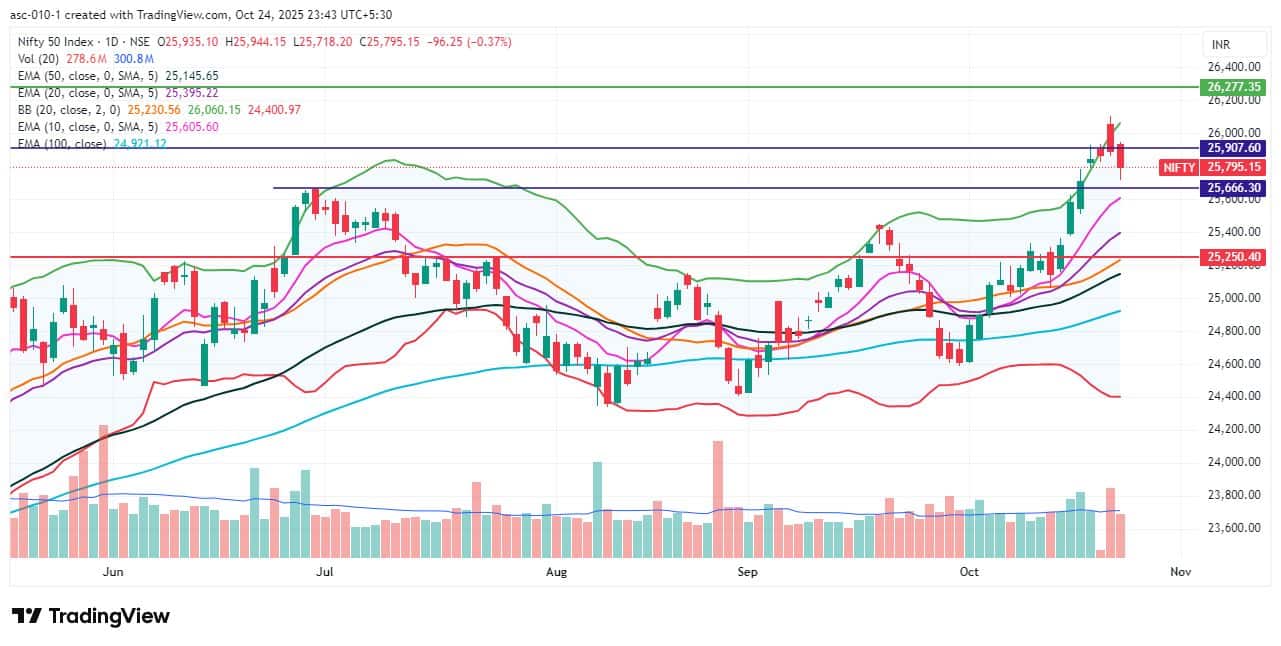
1) Key Levels For The Nifty 50 (25,795)
Resistance based on pivot points: 25,906, 25,959, and 26,045
Support based on pivot points: 25,733, 25,680, and 25,593
Special Formation: The Nifty 50 formed another long bearish candle with a minor lower shadow on the daily charts, signalling pressure with limited buying at lower levels. The index negated the higher high–higher low formation of the previous six days, though the higher high–higher low structure continued on the weekly charts, accompanied by an expansion in Bollinger Bands. The index remained well above all key moving averages, while the RSI, at 67.92, bent downward, and the Stochastic RSI showed a negative crossover. The MACD sustained its bullish crossover, and the histogram stayed above the zero line, though momentum faded further. All these factors indicate a short-term consolidation despite the broader positive trend.
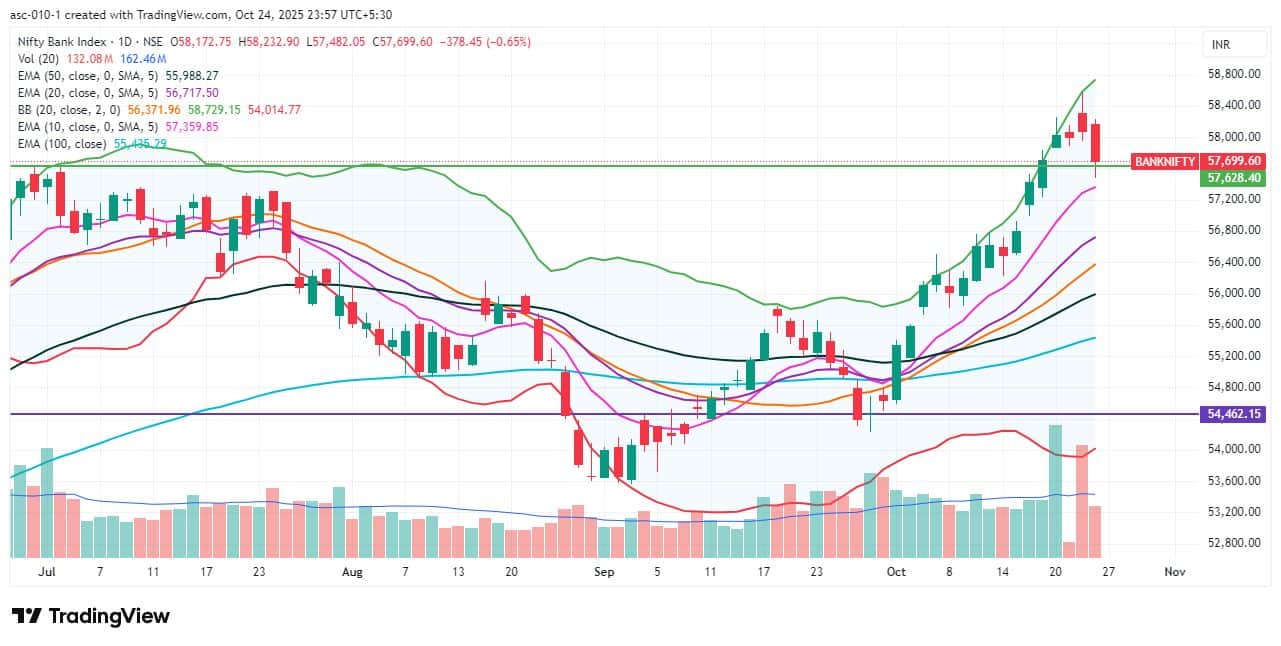
2) Key Levels For The Bank Nifty (57,700)
Resistance based on pivot points: 58,092, 58,269, and 58,556
Support based on pivot points: 57,518, 57,341, and 57,054
Resistance based on Fibonacci retracement: 58,762, 60,181
Support based on Fibonacci retracement: 57,407, 56,669
Special Formation: The Bank Nifty also displayed a lower high–lower low structure on Friday, after hitting a fresh record high followed by profit booking on Thursday. The banking index formed a bearish candle with a lower shadow on the daily timeframe, indicating that selling pressure persisted with limited buying interest at lower levels. Meanwhile, it remained well above all key moving averages, with the short- and medium-term averages still trending higher. However, the RSI, at 68.69, is on the verge of a breakdown, while the Stochastic RSI has shown a bearish crossover. The MACD continued to maintain a positive crossover, and the histogram stayed above the zero line, though momentum has gradually been fading. All these factors indicate emerging some weakness within the ongoing bullish structure.
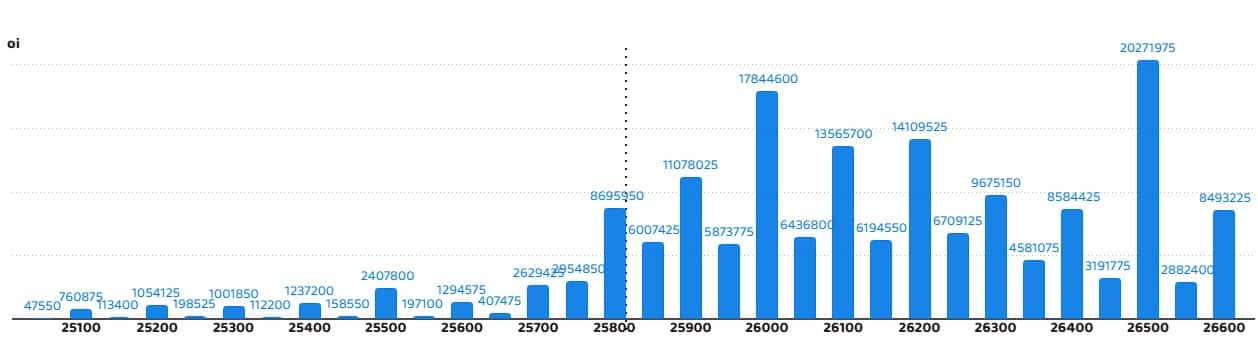
According to the monthly options data, the maximum Call open interest was placed at the 26,500 strike (with 2.02 crore contracts). This level can act as a key resistance for the Nifty in the short term. It was followed by the 26,000 strike (1.78 crore contracts), and the 26,200 strike (1.41 crore contracts).
Maximum Call writing was observed at the 26,000 strike, which saw an addition of 63.91 lakh contracts, followed by the 25,900 and 25,800 strikes, which added 60.4 lakh and 57.64 lakh contracts, respectively. The maximum Call unwinding was seen at the 25,500 strike, which shed 7.98 lakh contracts, followed by the 25,200 and 25,600 strikes, which shed 3.17 lakh and 2.7 lakh contracts, respectively.
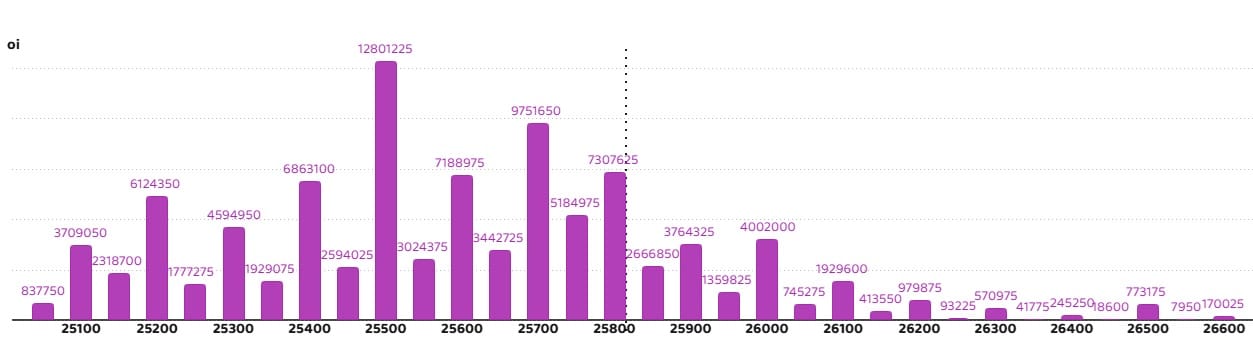
On the Put side, the 25,500 strike holds the maximum Put open interest (with 1.28 crore contracts), which can act as a key support level for the Nifty. It was followed by the 25,700 strike (97.51 lakh contracts) and the 25,800 strike (73.07 lakh contracts).
The maximum Put writing was placed at the 25,700 strike, which saw an addition of 28.59 lakh contracts, followed by the 25,500 and 25,750 strikes, which added 24.81 lakh and 24 lakh contracts, respectively. The maximum Put unwinding was seen at the 26,000 strike, which shed 28.81 lakh contracts, followed by the 25,900 and 26,100 strikes, which shed 20.34 lakh and 14.01 lakh contracts, respectively.
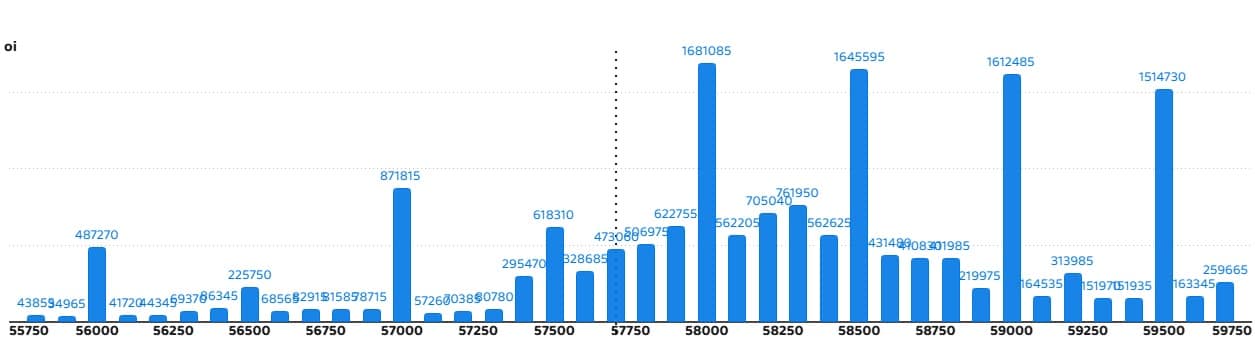
5) Bank Nifty Call Options Data
According to the monthly options data, the 58,000 strike holds the maximum Call open interest, with 16.81 lakh contracts. This can act as a key resistance level for the index in the short term. It was followed by the 58,500 strike (16.45 lakh contracts) and the 59,000 strike (16.12 lakh contracts).
Maximum Call writing was observed at the 59,500 strike (with the addition of 7.42 lakh contracts), followed by the 58,000 (3.99 lakh contracts) and 59,000 strike (3.85 lakh contracts). The maximum Call unwinding was seen at the 57,000 strike, which shed 3.66 lakh contracts, followed by the 58,800 and 56,500 strikes, which shed 1.13 lakh and 1.1 lakh contracts, respectively.
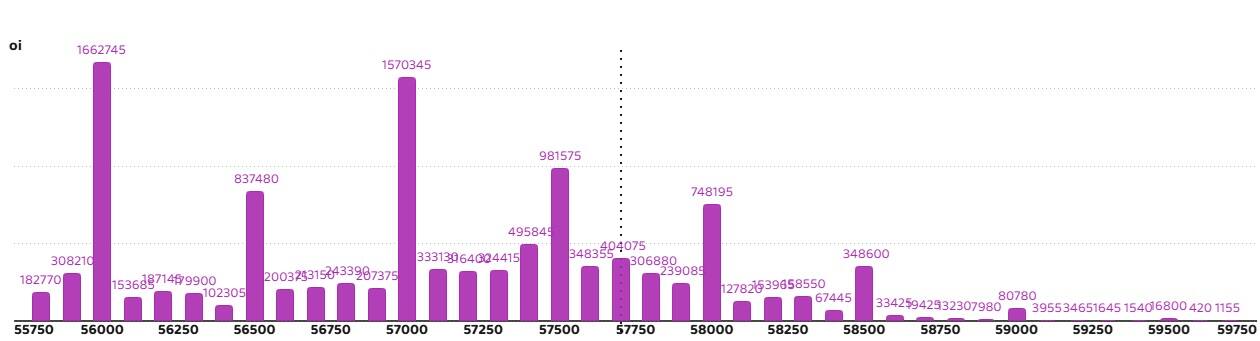
6) Bank Nifty Put Options Data
On the Put side, the maximum Put open interest was seen at the 56,000 strike (with 16.62 lakh contracts), which can act as a key support level for the index. This was followed by the 57,000 strike (15.7 lakh contracts) and the 57,500 strike (9.81 lakh contracts).
The maximum Put writing was placed at the 56,000 strike (which added 2.15 lakh contracts), followed by the 57,700 strike (1.58 lakh contracts) and the 57,100 strike (1.47 lakh contracts). The maximum Put unwinding was seen at the 57,000 strike which shed 3.95 lakh contracts, followed by the 58,000 and 58,500 strikes, which shed 2.73 lakh and 1.42 lakh contracts, respectively.
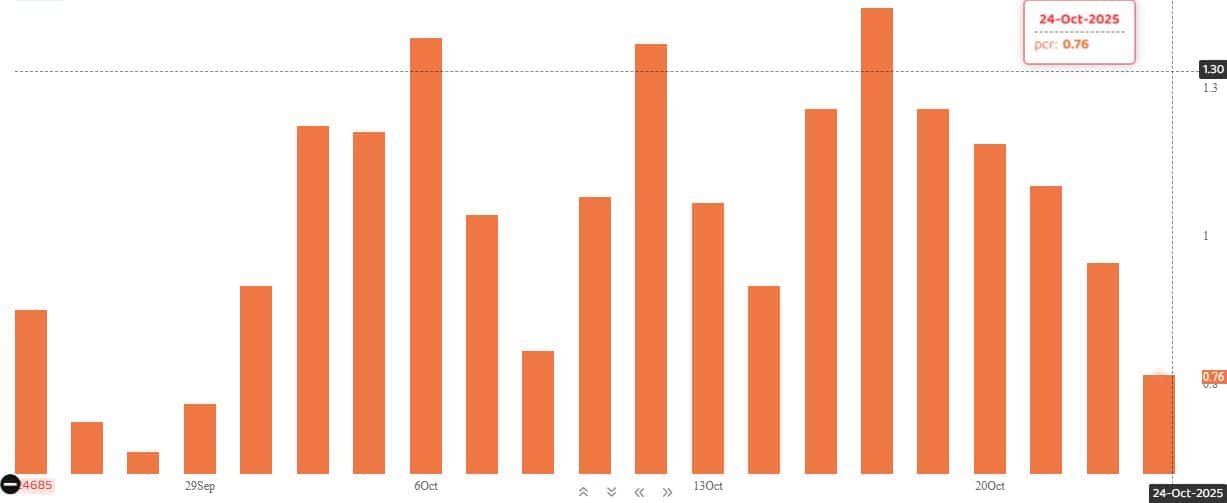
The Nifty Put-Call ratio (PCR), which indicates the mood of the market, dropped further to 0.76 on October 24, compared to 0.95 in the previous session.
The increasing PCR, or being higher than 0.7 or surpassing 1, means traders are selling more Put options than Call options, which generally indicates the firming up of a bullish sentiment in the market. If the ratio falls below 0.7 or moves towards 0.5, then it indicates selling in Calls is higher than selling in Puts, reflecting a bearish mood in the market.
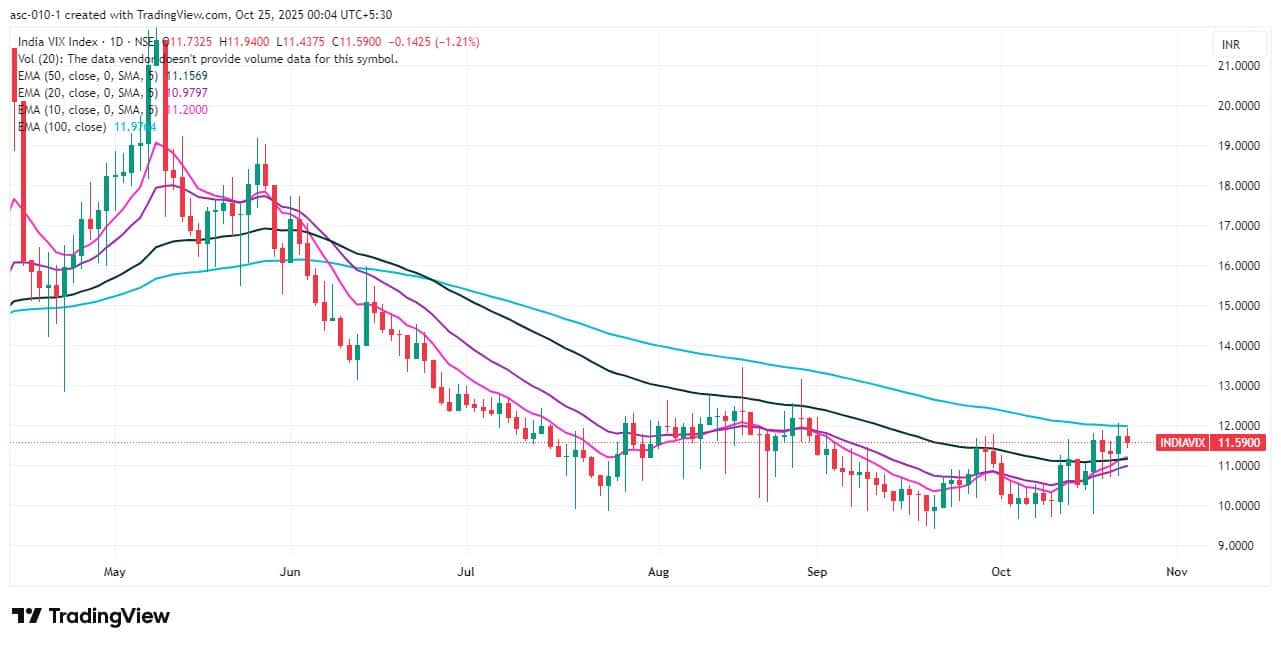
9) India VIX
The India VIX, also known as the fear gauge, remained within the previous day’s range, falling 1.21 percent to 11.59. This remains a comfort zone for bulls, and it is not a major concern unless the VIX decisively surpasses the 13 level.
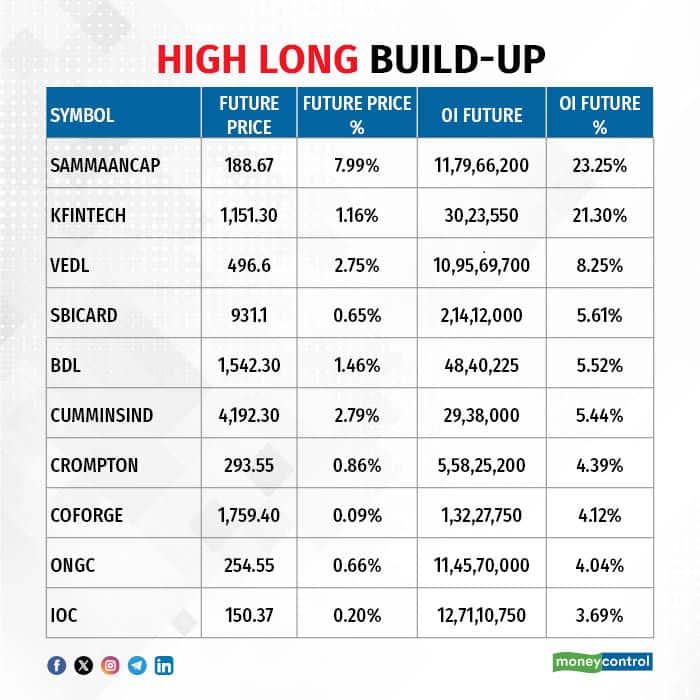
A long build-up was seen in 29 stocks. An increase in open interest (OI) and price indicates a build-up of long positions.
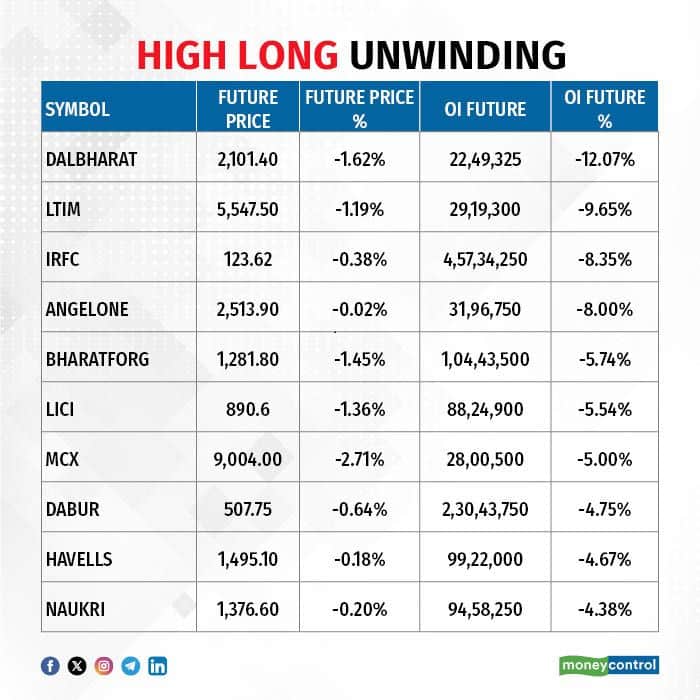
11) Long Unwinding (79 Stocks)
79 stocks saw a decline in open interest (OI) along with a fall in price, indicating long unwinding.
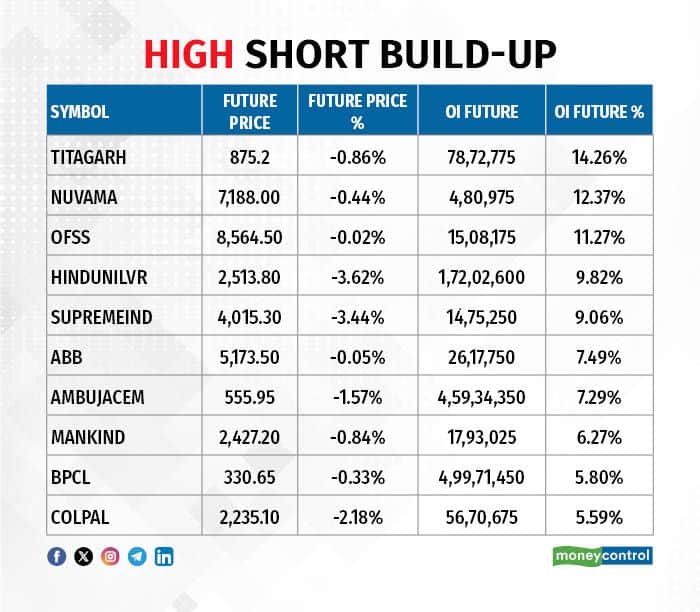
12) Short Build-up (74 Stocks)
74 stocks saw an increase in OI along with a fall in price, indicating a build-up of short positions.
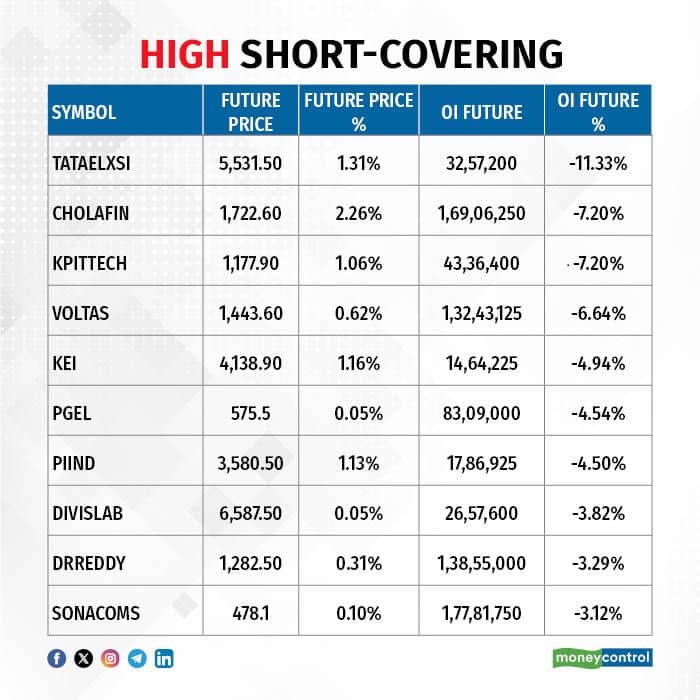
13) Short-Covering (30 Stocks)
30 stocks saw short-covering, meaning a decrease in OI, along with a price increase.
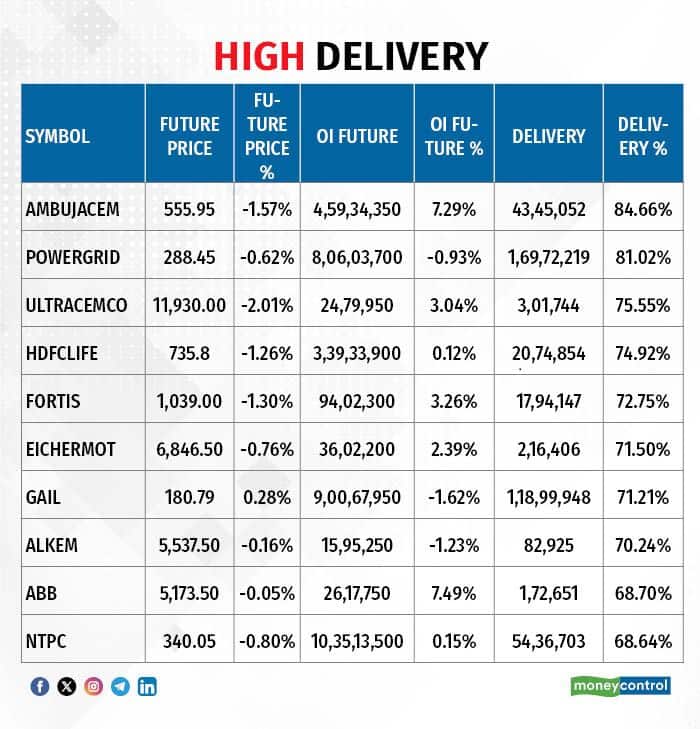
Here are the stocks that saw a high share of delivery trades. A high share of delivery reflects investing (as opposed to trading) interest in a stock.
Securities banned under the F&O segment include companies where derivative contracts cross 95 percent of the market-wide position limit.
Stocks added to F&O ban: SAIL, Sammaan Capital
Stocks retained in F&O ban: Nil
Stocks removed from F&O ban: Nil
Disclaimer: The views and investment tips expressed by experts on Moneycontrol are their own and not those of the website or its management. Moneycontrol advises users to check with certified experts before taking any investment decisions.Disclaimer: Moneycontrol is a part of the Network18 group. Network18 is controlled by Independent Media Trust, of which Reliance Industries is the sole beneficiary.Discover the latest Business News, Sensex, and Nifty updates. Obtain Personal Finance insights, tax queries, and expert opinions on Moneycontrol or download the Moneycontrol App to stay updated!
Find the best of Al News in one place, specially curated for you every weekend.
Stay on top of the latest tech trends and biggest startup news.


