


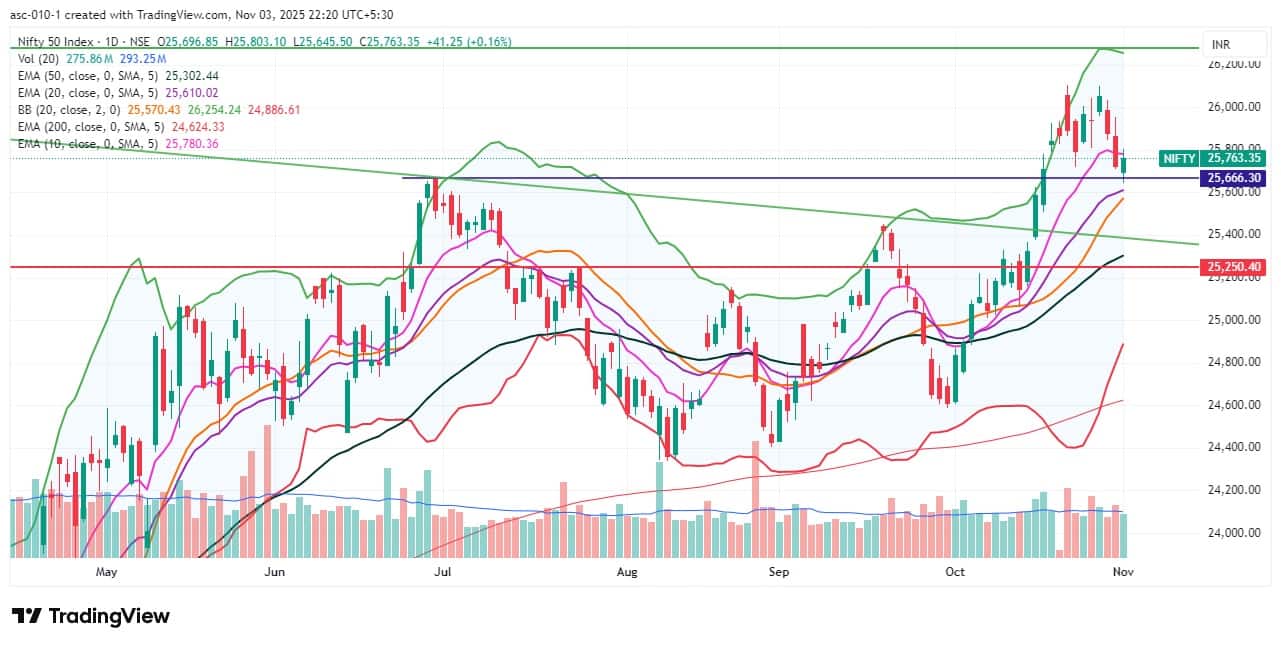
The Nifty 50 could not witness follow-through selling on November 3, ending the session with moderate gains. The index traded above the 20-day and 50-day EMAs as well as the midline of the Bollinger Bands, but continued to display a lower high–lower low structure on the daily chart, along with a bearish crossover in the RSI. Hence, until these indicators align positively, the consolidation phase may continue, with the 25,700–25,600 zone acting as key support. Below this, 25,500 remains a crucial support level. On the higher side, the 25,900–26,000 zone is expected to act as a hurdle, according to experts.
Here are 15 data points we have collated to help you spot profitable trades:
1) Key Levels For The Nifty 50 (25,763)
Resistance based on pivot points: 25,798, 25,835, and 25,895
Support based on pivot points: 25,677, 25,640, and 25,580
Special Formation: The Nifty 50 formed a bullish candle with upper and lower shadows on the daily chart, reflecting a positive trend amid volatility. The lower high–lower low structure continued for the third consecutive session after the index hit 26,100. It remained below the 10-day EMA but sustained above the 20-day and 50-day EMAs, as well as above the midline of the Bollinger Bands. The RSI, at 58.99, maintained a bearish crossover, while the MACD was on the verge of a negative crossover, with its histogram flattening out. All these signals indicate that while some underlying strength persists, the index may remain in a consolidation phase until momentum indicators turn favourable.
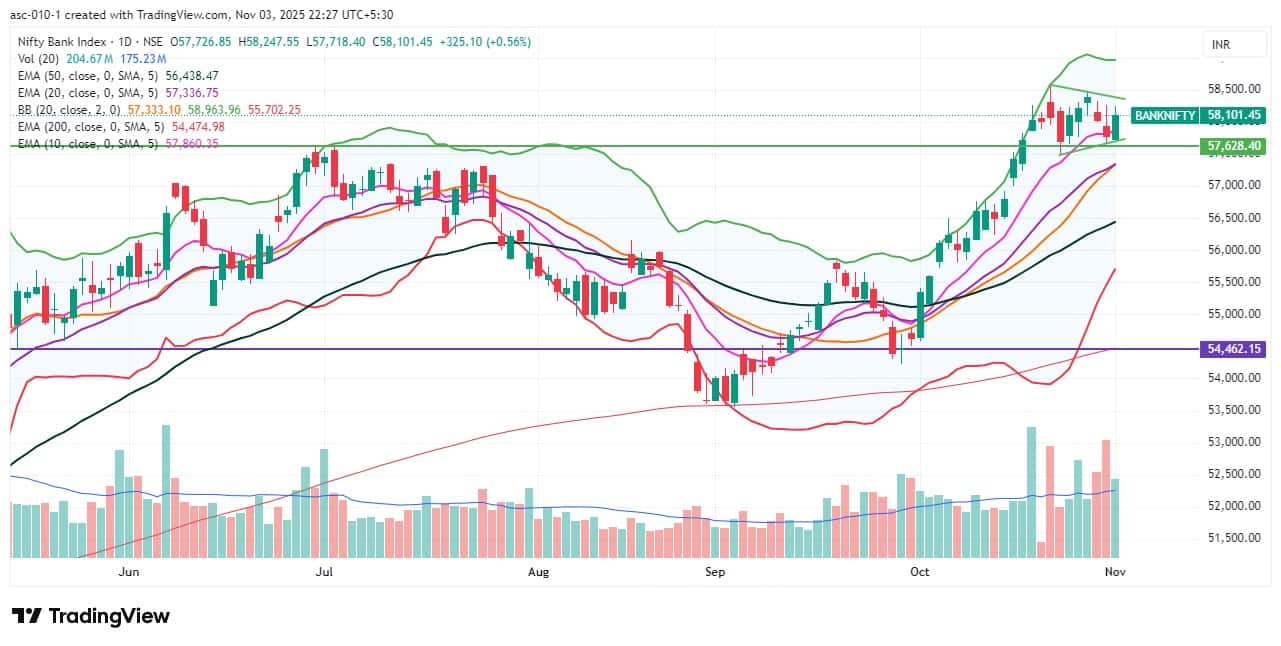
2) Key Levels For The Bank Nifty (58,101)
Resistance based on pivot points: 58,225, 58,350, and 58,552
Support based on pivot points: 57,820, 57,695, and 57,493
Resistance based on Fibonacci retracement: 58,739, 60,148
Support based on Fibonacci retracement: 57,394, 56,662
Special Formation: The Bank Nifty formed a bullish candle within the previous day’s range, supported by above-average volumes, suggesting a positive undertone. The index traded above all key moving averages. The RSI, at 65.60, moved upward but remained in a negative crossover, while the MACD displayed a bearish crossover, with the histogram dipping below the zero line. These mixed signals indicate short-term caution despite the prevailing positive sentiment.
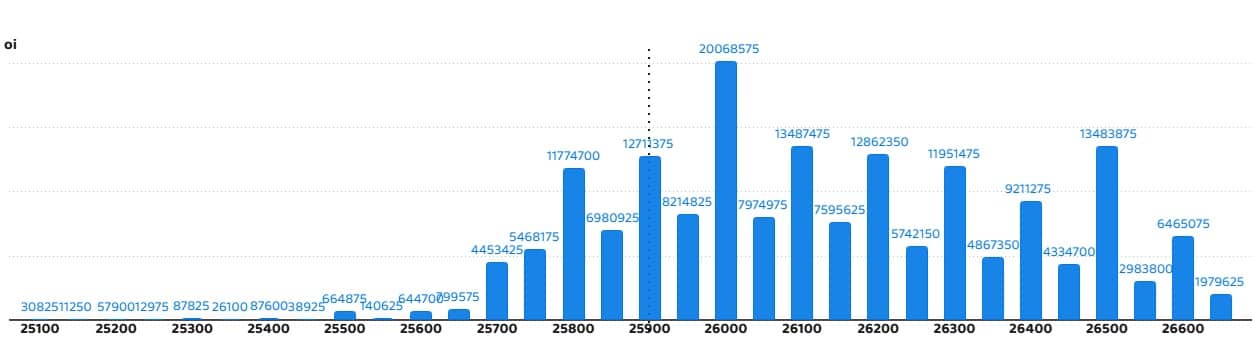
According to the weekly options data, the maximum Call open interest was seen at the 26,000 strike (with 2 crore contracts). This level can act as a key resistance for the Nifty in the short term. It was followed by the 26,100 and 26,500 strikes (1.34 crore contracts each).
Maximum Call writing was observed at the 25,750 strike, which saw an addition of 29.29 lakh contracts, followed by the 25,700 and 25,800 strikes, which added 16.38 lakh and 15.94 lakh contracts, respectively. The maximum Call unwinding was seen at the 26,600 strike, which shed 18.44 lakh contracts, followed by the 26,550 and 26,000 strikes, which shed 16.02 lakh and 12.63 lakh contracts, respectively.
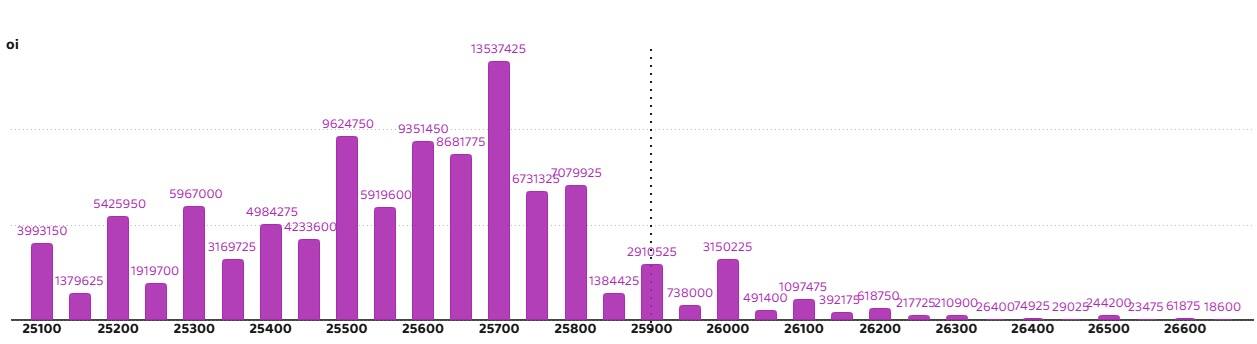
On the Put side, the 25,700 strike holds the maximum Put open interest (with 1.35 crore contracts), which can act as a key support level for the Nifty. It was followed by the 25,500 strike (96.24 lakh contracts) and the 25,600 strike (93.51 lakh contracts).
The maximum Put writing was placed at the 25,650 strike, which saw an addition of 60.18 lakh contracts, followed by the 25,700 and 25,600 strikes, which added 54.1 lakh and 41.91 lakh contracts, respectively. The maximum Put unwinding was seen at the 25,900 strike, which shed 12.74 lakh contracts, followed by the 26,000 and 25,850 strikes, which shed 11.01 lakh and 6.39 lakh contracts, respectively.
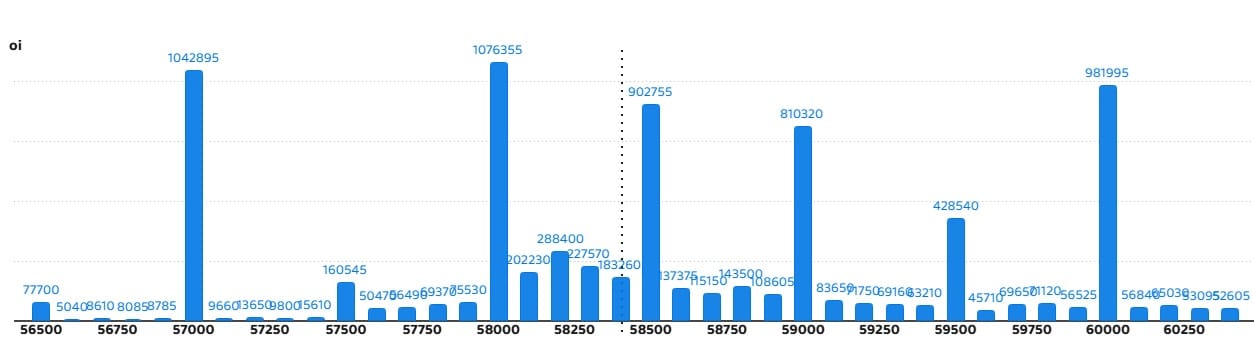
5) Bank Nifty Call Options Data
According to the monthly options data, the 58,000 strike holds the maximum Call open interest, with 10.76 lakh contracts. This can act as a key level for the index in the short term. It was followed by the 57,000 strike (10.42 lakh contracts) and the 60,000 strike (9.81 lakh contracts).
Maximum Call writing was observed at the 58,400 strike (with the addition of 33,320 contracts), followed by the 60,400 strike (18,760 contracts) and 59,700 strike (17,990 contracts). The maximum Call unwinding was seen at the 60,000 strike, which shed 37,870 contracts, followed by the 57,000 strike, which shed 36,085 contracts.
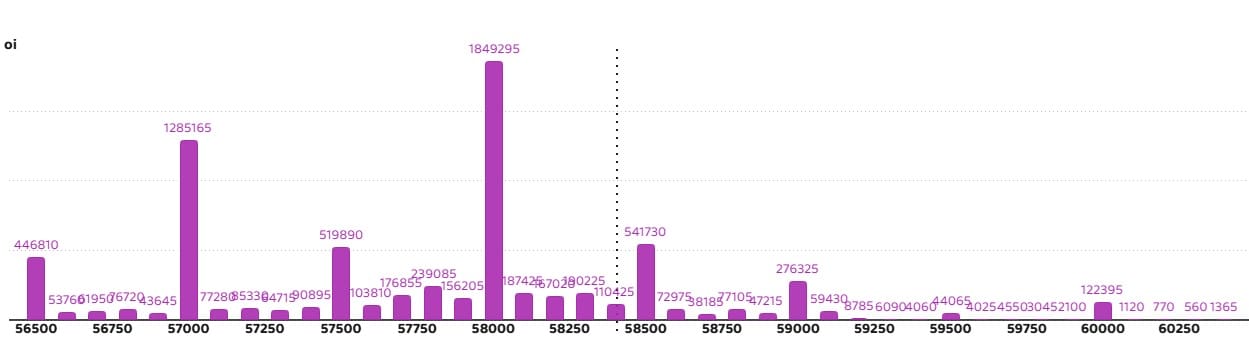
6) Bank Nifty Put Options Data
On the Put side, the maximum Put open interest was seen at the 58,000 strike (with 18.49 lakh contracts), which can act as a key support level for the index. This was followed by the 57,000 strike (12.85 lakh contracts) and the 58,500 strike (5.41 lakh contracts).
The maximum Put writing was placed at the 58,000 strike (which added 1.33 lakh contracts), followed by the 57,000 strike (94,150 contracts) and the 58,100 strike (84,350 contracts). The maximum Put unwinding was seen at the 58,200 strike which shed 7,560 contracts, followed by the 58,700 and 58,900 strikes, which shed 5,460 and 2,310 contracts, respectively.
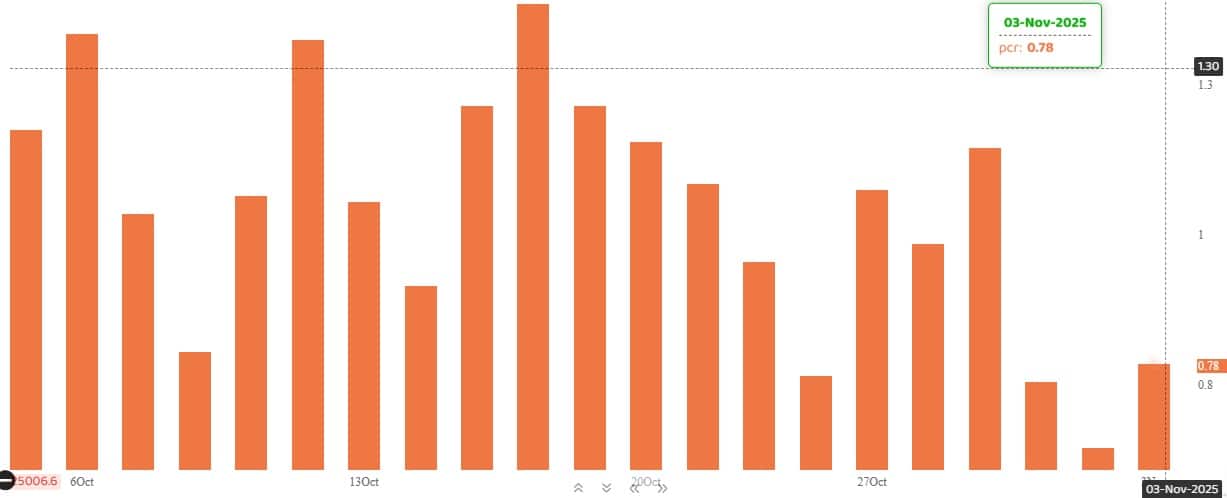
The Nifty Put-Call ratio (PCR), which indicates the mood of the market, climbed to 0.78 on November 3, compared to 0.64 in the previous session.
The increasing PCR, or being higher than 0.7 or surpassing 1, means traders are selling more Put options than Call options, which generally indicates the firming up of a bullish sentiment in the market. If the ratio falls below 0.7 or moves towards 0.5, then it indicates selling in Calls is higher than selling in Puts, reflecting a bearish mood in the market.
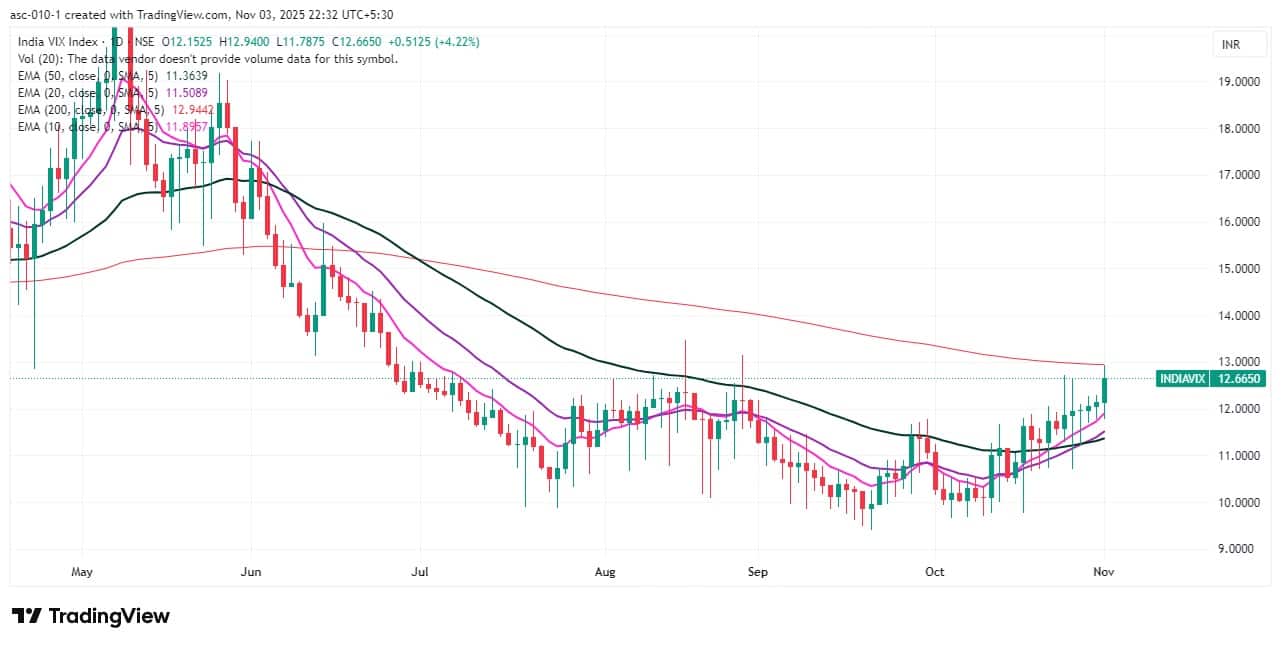
9) India VIX
The fear index, India VIX, continued its northward journey for the sixth straight session, touching the 200-day EMA intraday and rising 4.22 percent to 12.67—its highest closing level since June 30. This indicates increasing caution among market participants. If the VIX surpasses and sustains above 13, bulls may face further discomfort in the sessions ahead.
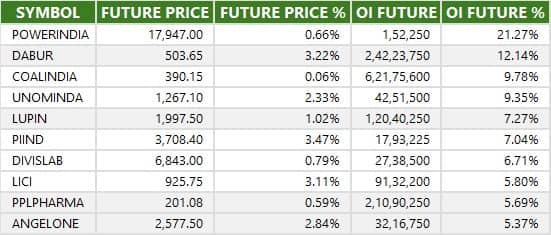
A long build-up was seen in 92 stocks. An increase in open interest (OI) and price indicates a build-up of long positions.
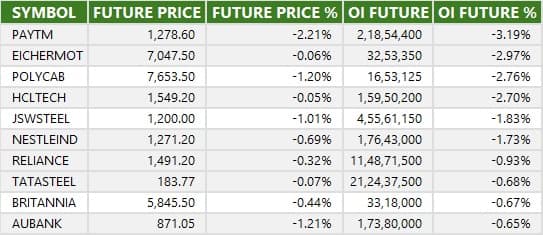
11) Long Unwinding (17 Stocks)
17 stocks saw a decline in open interest (OI) along with a fall in price, indicating long unwinding.
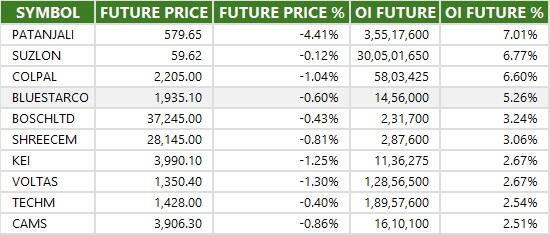
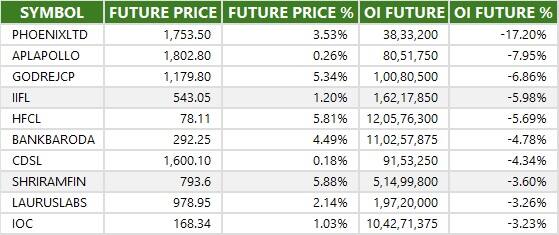
12) Short Build-up (36 Stocks)
36 stocks saw an increase in OI along with a fall in price, indicating a build-up of short positions.
13) Short-Covering (69 Stocks)
69 stocks saw short-covering, meaning a decrease in OI, along with a price increase.
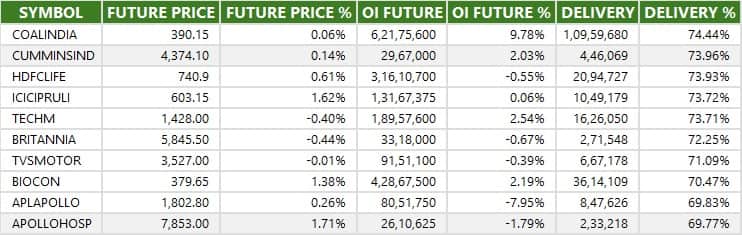
Here are the stocks that saw a high share of delivery trades. A high share of delivery reflects investing (as opposed to trading) interest in a stock.
Securities banned under the F&O segment include companies where derivative contracts cross 95 percent of the market-wide position limit.
Stocks added to F&O ban: Nil
Stocks retained in F&O ban: Nil
Stocks removed from F&O ban: Nil
Disclaimer: The views and investment tips expressed by experts on Moneycontrol are their own and not those of the website or its management. Moneycontrol advises users to check with certified experts before taking any investment decisions.Disclaimer: Moneycontrol is a part of the Network18 group. Network18 is controlled by Independent Media Trust, of which Reliance Industries is the sole beneficiary.Discover the latest Business News, Sensex, and Nifty updates. Obtain Personal Finance insights, tax queries, and expert opinions on Moneycontrol or download the Moneycontrol App to stay updated!
Find the best of Al News in one place, specially curated for you every weekend.
Stay on top of the latest tech trends and biggest startup news.


