


The relief rally continued for a second consecutive session, with the Nifty 50 rising 0.74 percent on March 17 despite oil prices sustaining above $100 a barrel amid the US-Iran war-led Strait of Hormuz crisis, supported by short covering and a fall in the VIX. Overall, market conditions have not improved significantly, with the index sustaining well below all key moving averages and continuing to form a lower high–lower low structure. According to experts, the Nifty 50 needs to close and sustain above the 23,600–23,700 levels in the next few sessions for a move toward the 23,800–24,000 zone. Until then, consolidation may continue, with immediate support at 23,350, followed by 23,000 as a crucial support level.
Here are 15 data points we have collated to help you spot profitable trades:
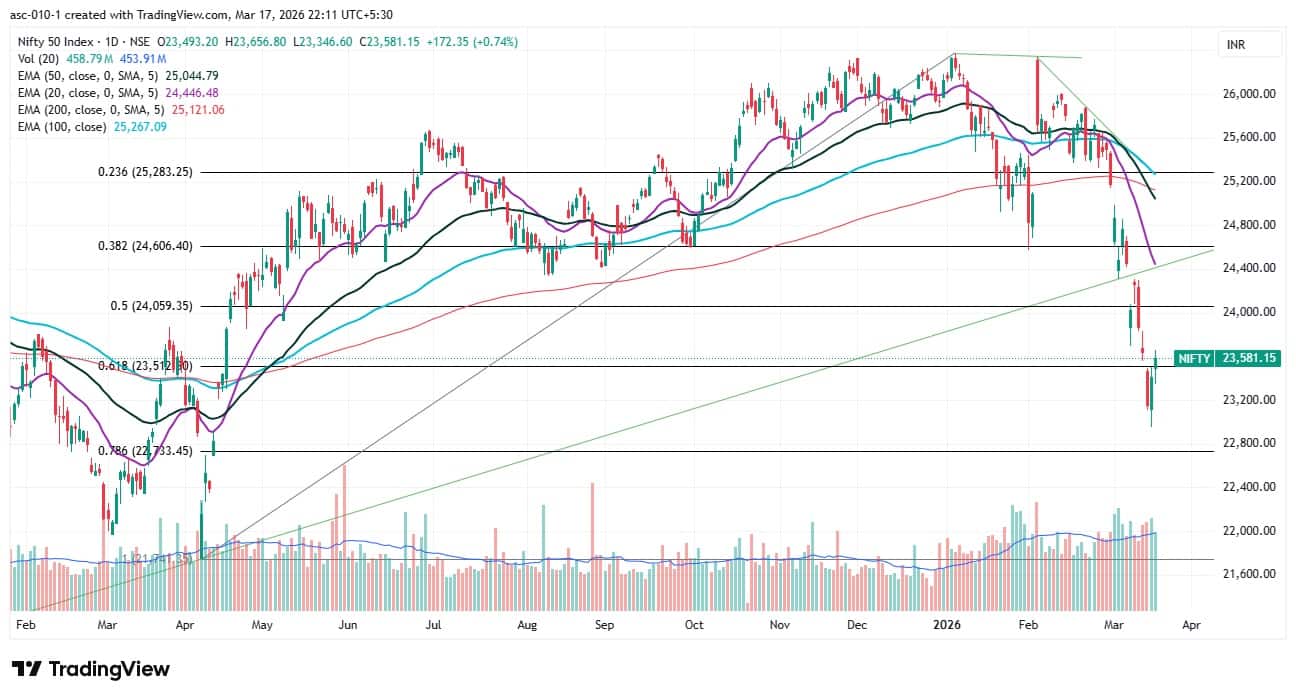
1) Key Levels For The Nifty 50 (23,581)
Resistance based on pivot points: 23,647, 23,720, and 23,838
Support based on pivot points: 23,410, 23,336, and 23,218
Special Formation: The Nifty 50 formed a bullish candle with upper and lower shadows, resembling a high-wave-type candlestick pattern (though not a classical one) on the daily charts, indicating indecision among bulls and bears after a rise and near an immediate hurdle. The index closed above the previous day's high as well as above the golden ratio (61.8 percent Fibonacci retracement of the rally from the April 2025 low to the January 2026 high). However, the index remains below all key moving averages, with the 50-day EMA sustaining below the 20-, 100-, and 200-day EMAs. The RSI at 33.18 is on the verge of a positive crossover, and the Stochastic RSI sustained above the signal line, while the histogram's weakness faded further. However, the MACD remains well below the signal and zero lines. All this indicates a mixed trend with early signs of potential recovery but no confirmed reversal yet.
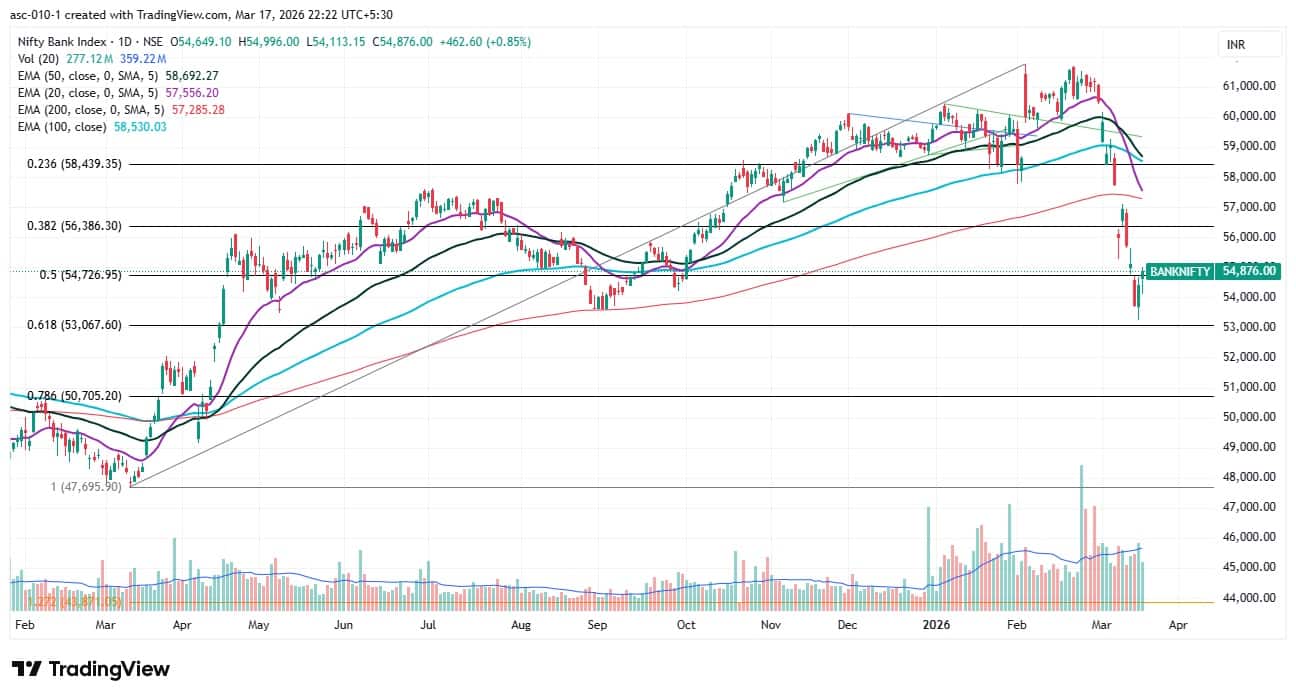
2) Key Levels For The Bank Nifty (54,876)
Resistance based on pivot points: 54,999, 55,207, and 55,545
Support based on pivot points: 54,324, 54,116, and 53,779
Resistance based on Fibonacci retracement: 55,220, 56,473
Support based on Fibonacci retracement: 53,068, 50,705
Special Formation: The Bank Nifty formed a bullish candle with a minor upper and long lower shadow on the daily timeframe, indicating strong buying interest at lower levels. The index closed above the previous day's high as well as the 50 percent Fibonacci retracement level (from the March 2025 low to the February 2026 high), while holding the golden ratio in the current fall. All key moving averages are sloping downward, while the RSI rose to 31.76 but remains below the signal line. The Stochastic RSI showed a positive crossover amid a sideways move, while the MACD sustained below the reference and zero lines, and the histogram's weakness faded further. All this indicates a recovery phase within a broader downtrend, warranting caution.
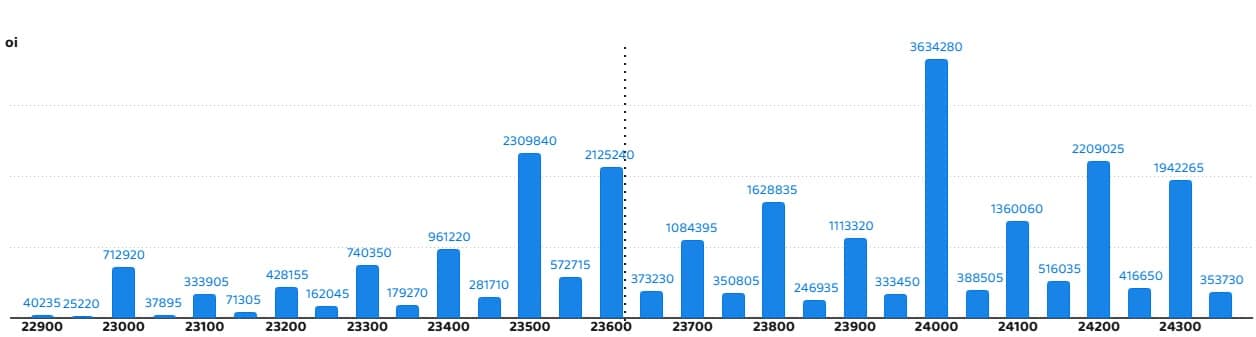
According to the weekly options data, the maximum Call open interest was seen at the 24,000 strike (with 36.34 lakh contracts). This level can act as a key resistance level for the Nifty in the short term. It was followed by the 23,500 strike (23.09 lakh contracts) and 24,200 strike (22.09 lakh contracts).
Maximum Call writing was observed at the 24,000 strike, which saw an addition of 17.39 lakh contracts, followed by the 23,600 and 24,200 strikes, which added 15.35 lakh and 11.29 lakh contracts, respectively. The maximum Call unwinding was seen at the 23,200 strike, which shed 3.08 lakh contracts, followed by the 23,400 and 23,300 strikes, which shed 1.94 lakh and 80,990 contracts, respectively.
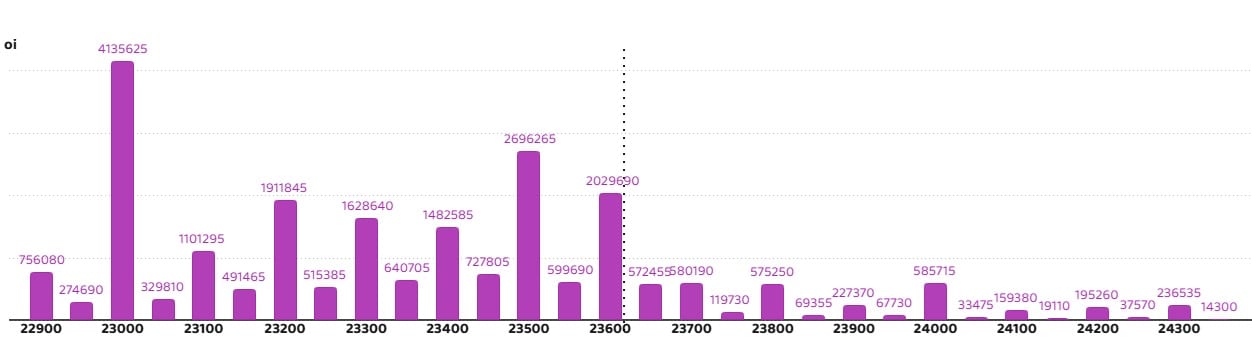
On the Put side, the 23,000 strike holds the maximum Put open interest (with 41.35 lakh contracts), which can act as a key support level for the Nifty in the short term. It was followed by the 23,500 strike (26.96 lakh contracts) and the 23,600 strike (20.29 lakh contracts).
The maximum Put writing was placed at the 23,000 strike, which saw an addition of 21.72 lakh contracts, followed by the 23,500 and 23,600 strikes, which added 17.22 lakh and 16.21 lakh contracts, respectively. The maximum Put unwinding was seen at the 24,350 strike, which shed 14,235 contracts, followed by the 24,250 and 24,150 strikes, which shed 3,315 and 195 contracts, respectively.
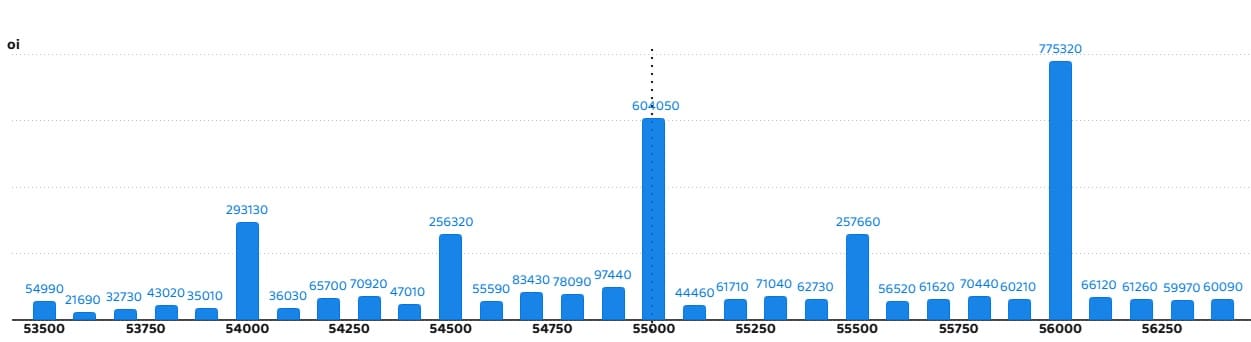
5) Bank Nifty Call Options Data
According to the monthly options data, the maximum Call open interest was seen at the 56,000 strike, with 7.75 lakh contracts. This can act as a key resistance level for the index in the short term. It was followed by the 55,000 strike (6.04 lakh contracts) and the 54,000 strike (2.93 lakh contracts).
Maximum Call writing was observed at the 54,900 strike (with the addition of 63,450 contracts), followed by the 54,800 strike (32,970 contracts) and 54,700 strike (26,670 contracts). The maximum Call unwinding was seen at the 54,500 strike, which shed 78,750 contracts, followed by the 54,000 and 54,400 strikes, which shed 42,780 and 25,560 contracts, respectively.
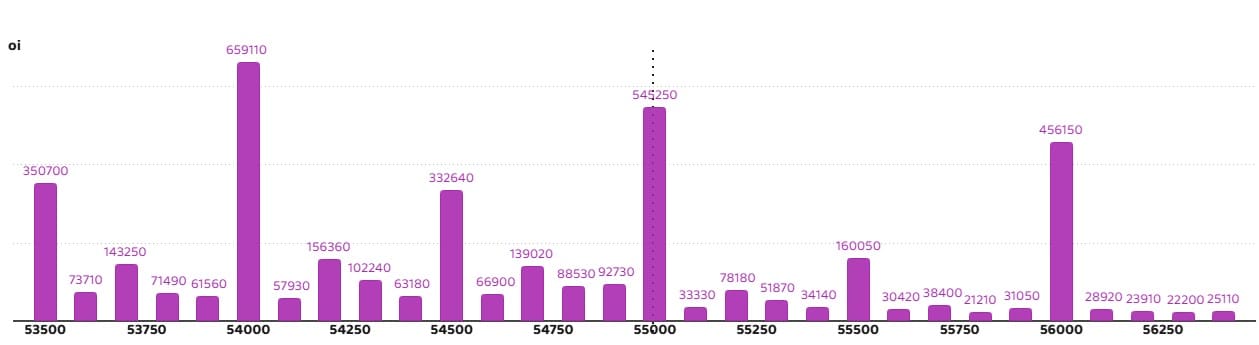
6) Bank Nifty Put Options Data
On the Put side, the 54,000 strike holds the maximum Put open interest (with 6.59 lakh contracts), which can act as a key support level for the index. This was followed by the 55,000 strike (5.45 lakh contracts) and the 56,000 strike (4.56 lakh contracts).
The maximum Put writing was placed at the 55,000 strike (which added 61,440 contracts), followed by the 54,800 (54,600 contracts) and 55,200 (52,740 contracts). The maximum Put unwinding was seen at the 54,000 strike, which shed 12,095 contracts, followed by the 53,800 and 56,200 strikes, which shed 10,440 and 3,330 contracts, respectively.
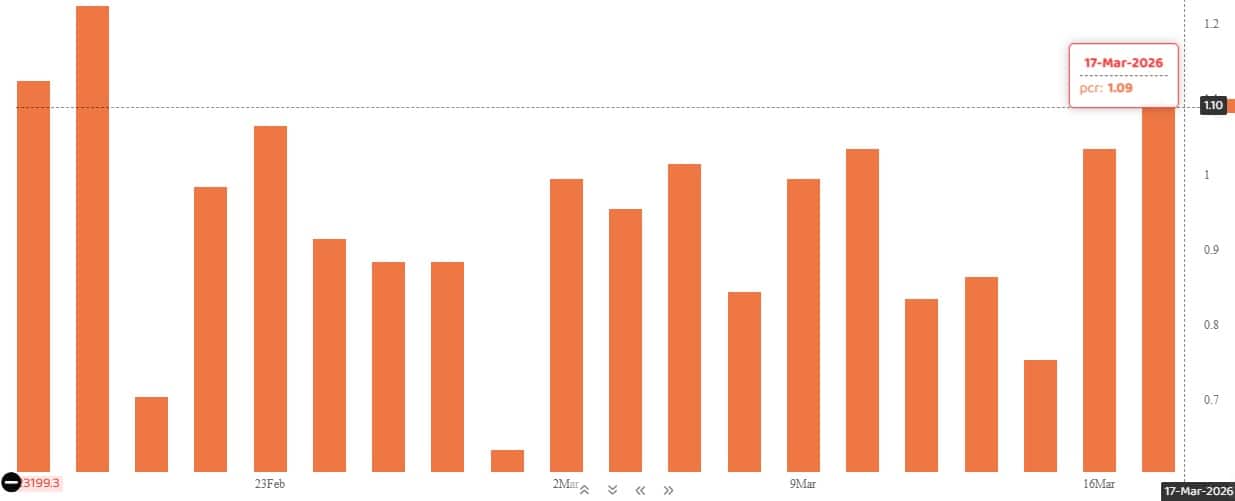
The Nifty Put-Call ratio (PCR), which indicates the mood of the market, rose to 1.09 on March 17, compared to a 1.03 in previous session.
The increasing PCR, or being higher than 0.7 or surpassing 1, means traders are selling more Put options than Call options, which generally indicates the firming up of a bullish sentiment in the market. If the ratio falls below 0.7 or moves towards 0.5, then it indicates selling in Calls is higher than selling in Puts, reflecting a bearish mood in the market.
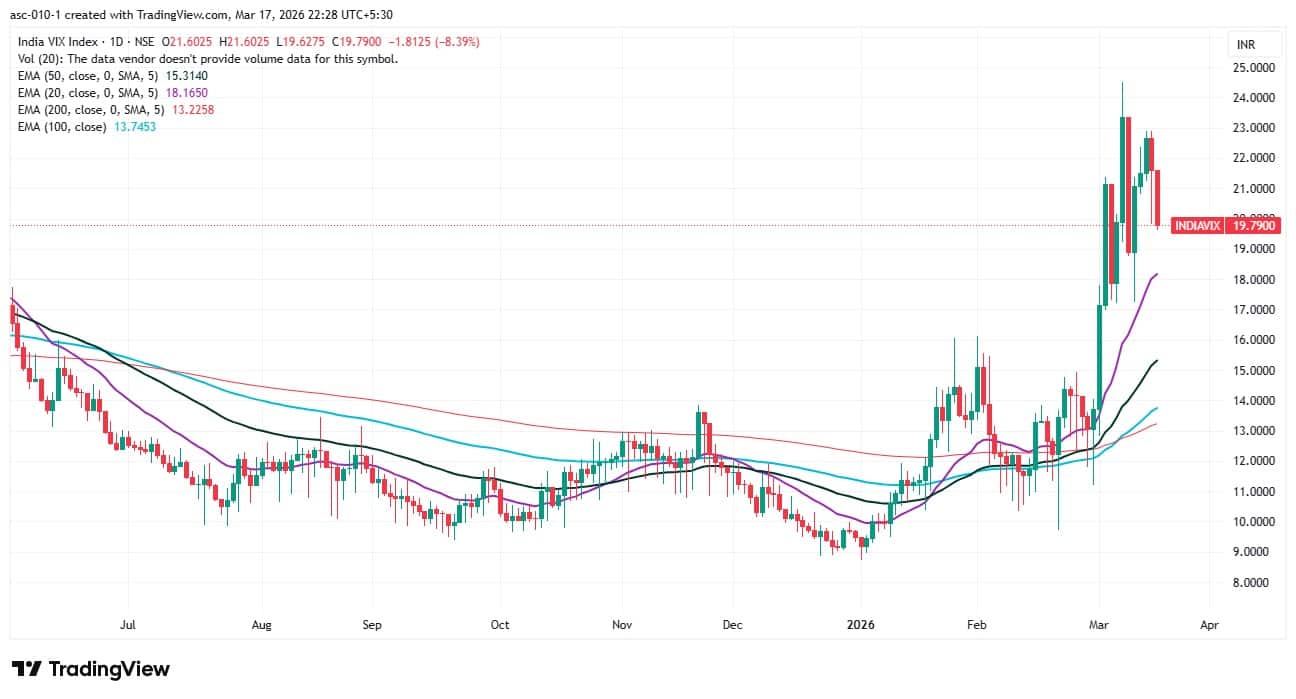
9) India VIX
The fear gauge, India VIX, dropped 8.4 percent to 19.79, extending its downtrend for another session and providing comfort to bulls. However, it needs to fall below the 18 zone to offer further support to bullish sentiment.
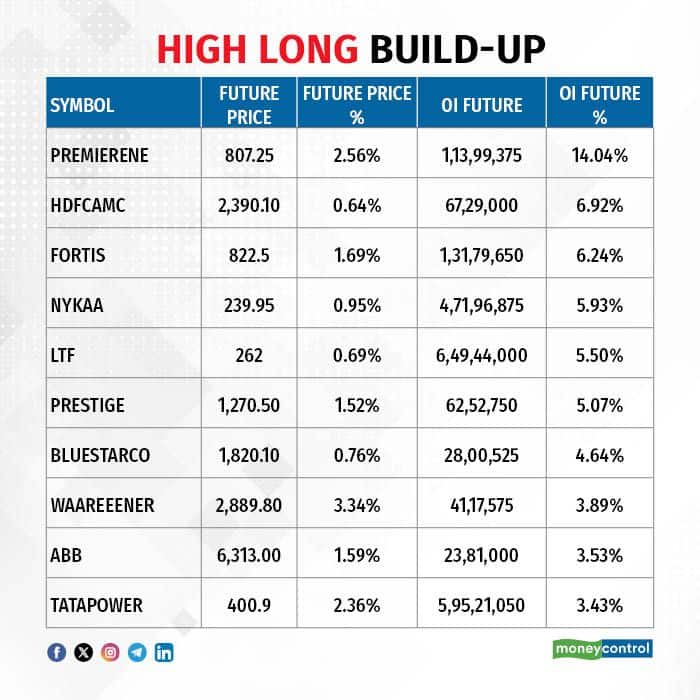
A long build-up was seen in 95 stocks. An increase in open interest (OI) and price indicates a build-up of long positions.
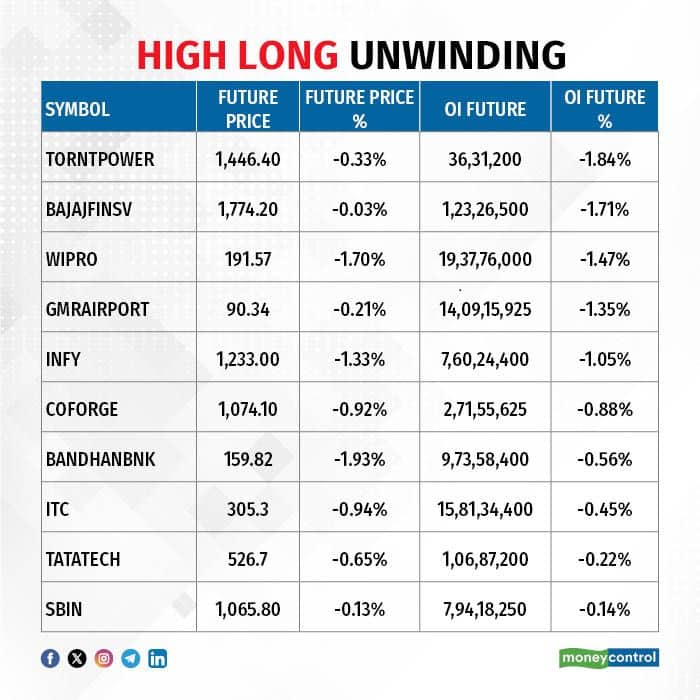
11) Long Unwinding (11 Stocks)
11 stocks saw a decline in open interest (OI) along with a fall in price, indicating long unwinding.
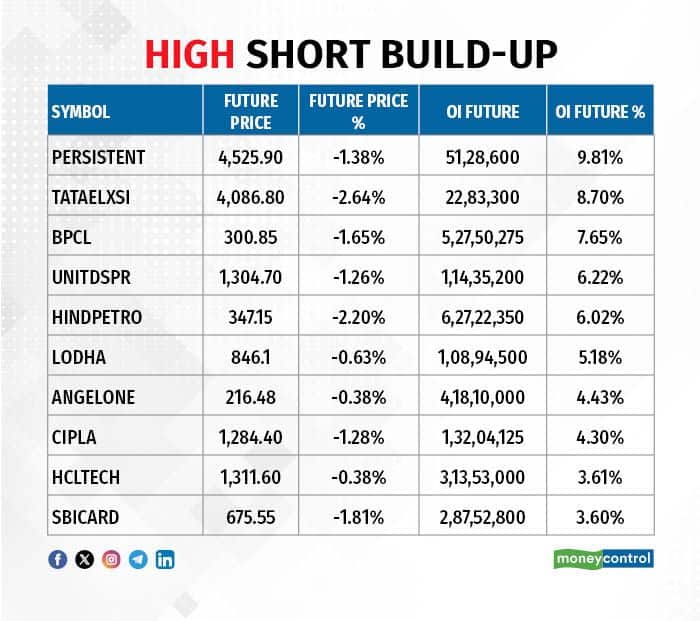
12) Short Build-up (35 Stocks)
35 stocks saw an increase in OI along with a fall in price, indicating a build-up of short positions.
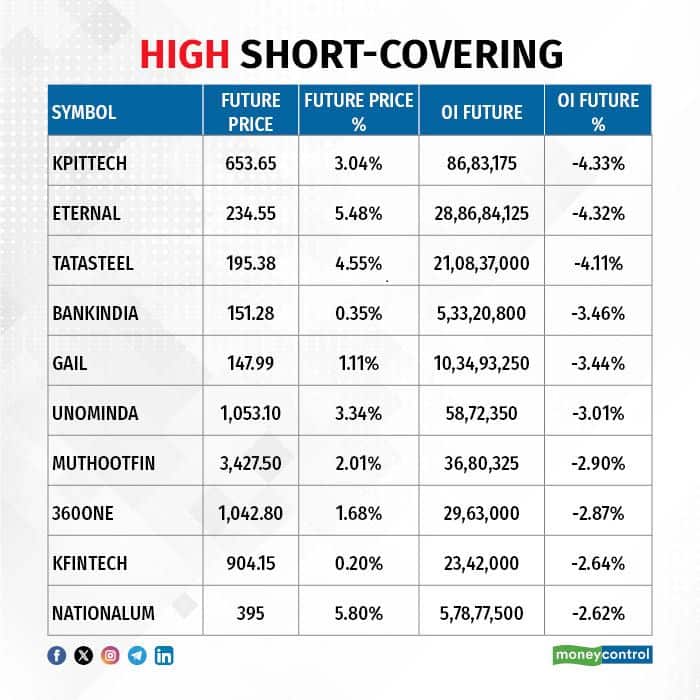
13) Short-Covering (70 Stocks)
70 stocks saw short-covering, meaning a decrease in OI, along with a price increase.
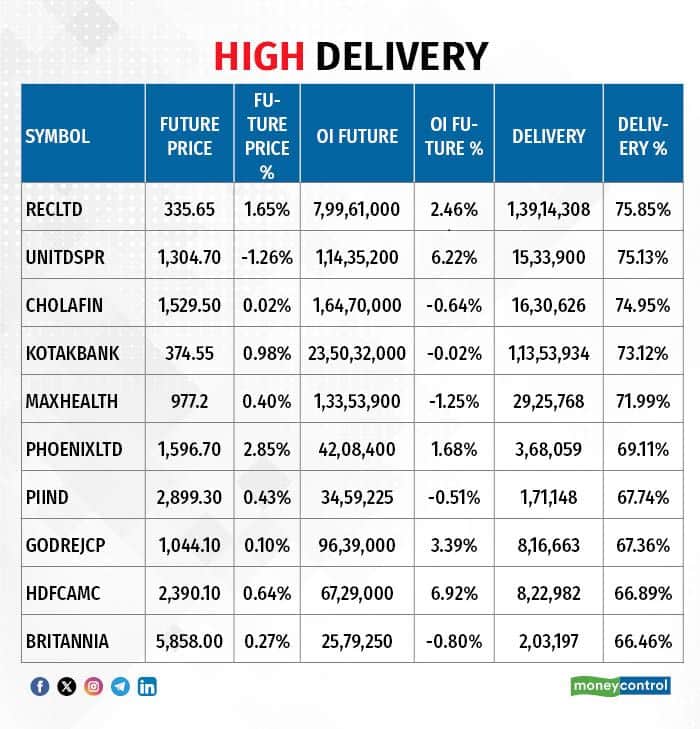
Here are the stocks that saw a high share of delivery trades. A high share of delivery reflects investing (as opposed to trading) interest in a stock.
Securities banned under the F&O segment include companies where derivative contracts cross 95 percent of the market-wide position limit.
Stocks added to F&O ban: Nil
Stocks retained in F&O ban: SAIL, Sammaan Capital
Stocks removed from F&O ban: Nil
Disclaimer: The views and investment tips expressed by experts on Moneycontrol are their own and not those of the website or its management. Moneycontrol advises users to check with certified experts before taking any investment decisions.Disclaimer: Moneycontrol is a part of the Network18 group. Network18 is controlled by Independent Media Trust, of which Reliance Industries is the sole beneficiary.Discover the latest Business News, Sensex, and Nifty updates. Obtain Personal Finance insights, tax queries, and expert opinions on Moneycontrol or download the Moneycontrol App to stay updated!


Find the best of Al News in one place, specially curated for you every weekend.
Stay on top of the latest tech trends and biggest startup news.


