


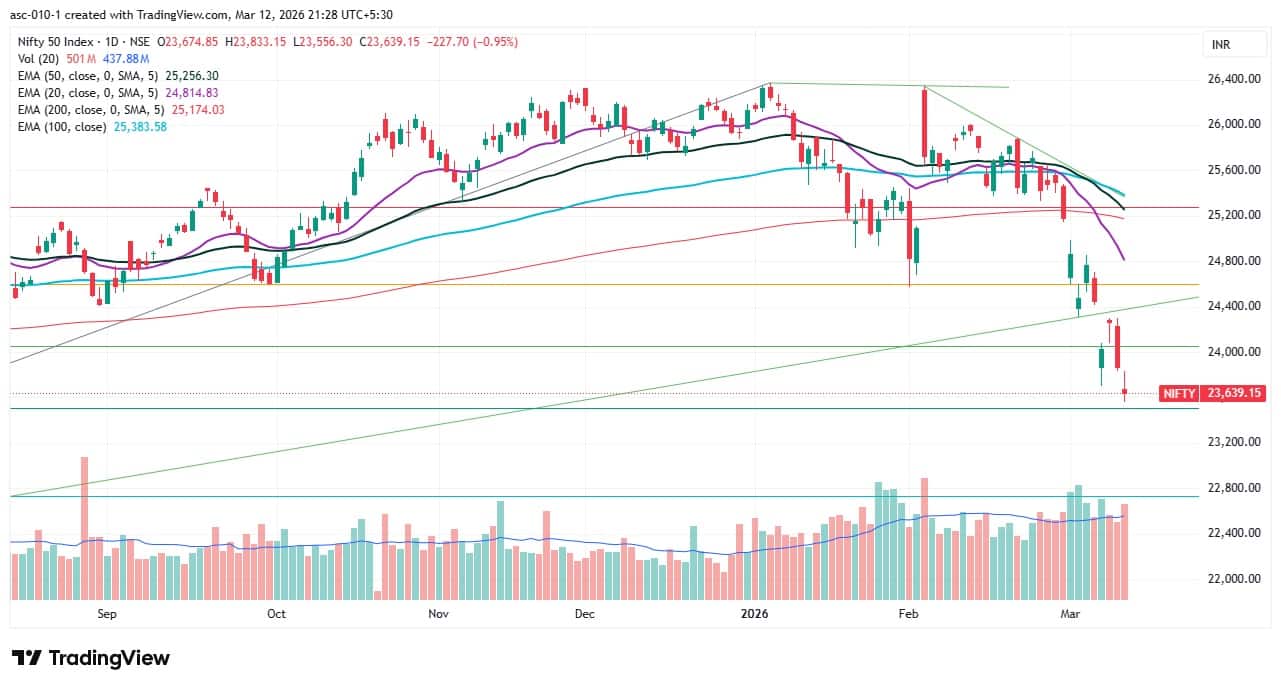
The Nifty 50 hit a fresh 11-month low, falling nearly 1 percent as Middle East tensions escalated after Iran's new Supreme Leader, Mojtaba Khamenei, commented that the Strait of Hormuz must remain closed, driving oil prices to $100 a barrel again. Even the technical and momentum indicators maintained a sell signal. Hence, the bears seem to be keeping tight control over the market in the upcoming sessions, possibly pushing the Nifty 50 toward the immediate support of 23,500 and signalling a major risk for the 23,200–23,000 zone. Notably, 23,000 has the maximum Put open interest. However, the 23,700–23,800 zone is likely to be the immediate resistance for the index, according to experts.
Here are 15 data points we have collated to help you spot profitable trades:
1) Key Levels For The Nifty 50 (23,639)
Resistance based on pivot points: 23,782, 23,847, and 23,953
Support based on pivot points: 23,570, 23,505, and 23,399
Special Formation: The Nifty 50 formed a small-bodied bearish candle with a long upper shadow and a minor lower shadow on the daily timeframe, along with a lower high–lower low formation, signalling consistent pressure at higher levels, though there was some buying interest at lower levels. All moving averages maintained a downward move, while the 50-day EMA is inching closer to the 200-day EMA, raising the possibility of a Death Cross formation. The RSI declined to 28.02, while the MACD dropped to the lowest level since April 2020, with further expansion in the red histogram bar (which is the biggest red bar since March 2020). All this indicates a strong bearish momentum and sustained selling pressure in the index.
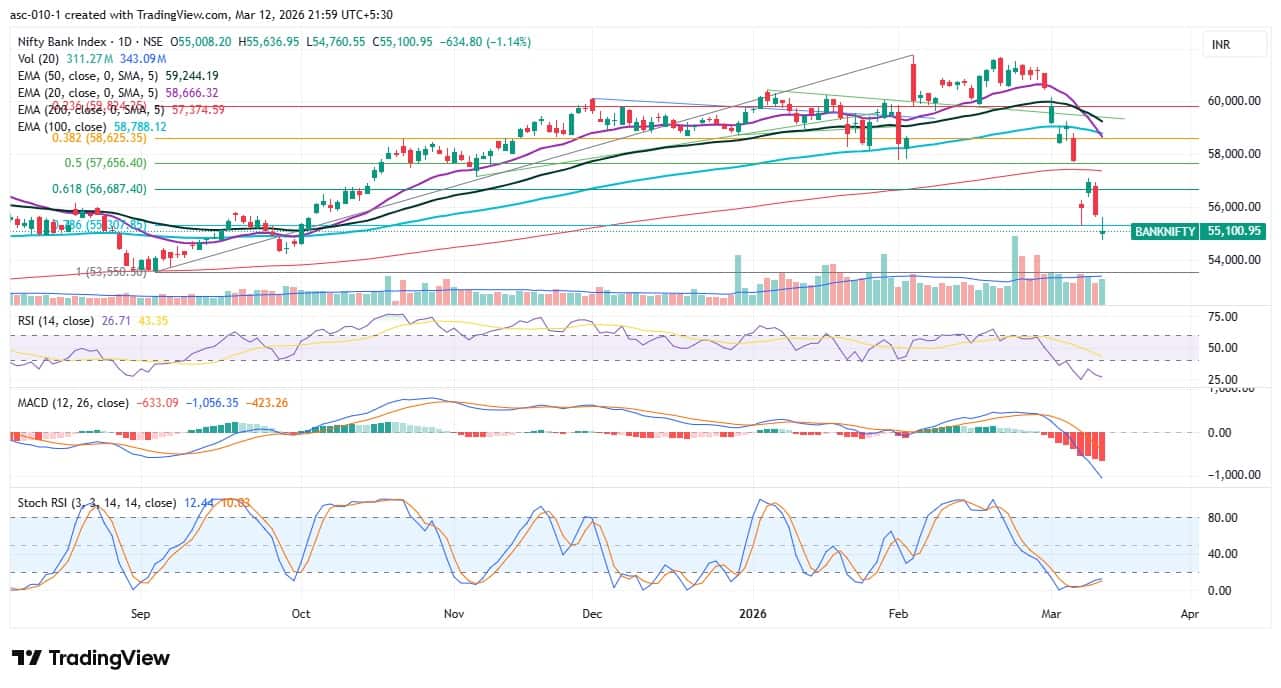
2) Key Levels For The Bank Nifty (55,101)
Resistance based on pivot points: 55,501, 55,708, and 56,042
Support based on pivot points: 54,831, 54,625, and 54,290
Resistance based on Fibonacci retracement: 56,414, 57,436
Support based on Fibonacci retracement: 53,562, 51,317
Special Formation: The Bank Nifty also broke Monday's low and formed a Nifty-like candlestick pattern on the daily charts, while all the moving averages trended down. The 20-day EMA saw a bearish crossover with the 100-day EMA and is already below the 50-day EMA, while the lower high–lower low formation remains intact. The RSI declined to 26.71 (in the oversold zone), and the MACD hit the lowest level since March 2022 with further expansion in the red histogram bar (the biggest red bar since March 2020). The Stochastic RSI has maintained a positive crossover in the oversold zone since Monday. All this indicates continued bearish momentum, though the oversold conditions may trigger intermittent pullbacks.
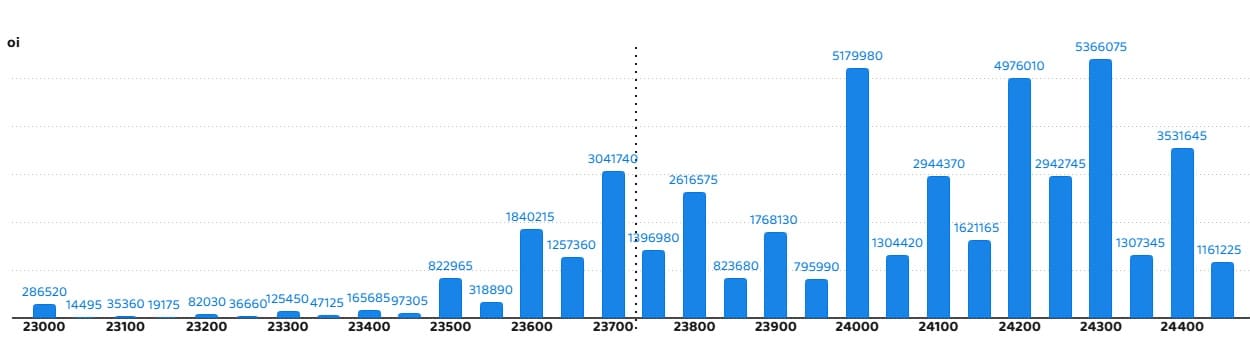
According to the weekly options data, the 24,300 strike holds the maximum Call open interest (with 53.66 lakh contracts). This level can act as a key resistance level for the Nifty in the short term. It was followed by the 24,000 strike (51.79 lakh contracts) and 24,200 strike (49.76 lakh contracts).
Maximum Call writing was observed at the 23,700 strike, which saw an addition of 25.18 lakh contracts, followed by the 23,800 and 23,600 strikes, which added 18.82 lakh and 17.24 lakh contracts, respectively. The maximum Call unwinding was seen at the 24,350 strike, which shed 3.48 lakh contracts, followed by the 23,950 strike which shed 2.38 lakh contracts.
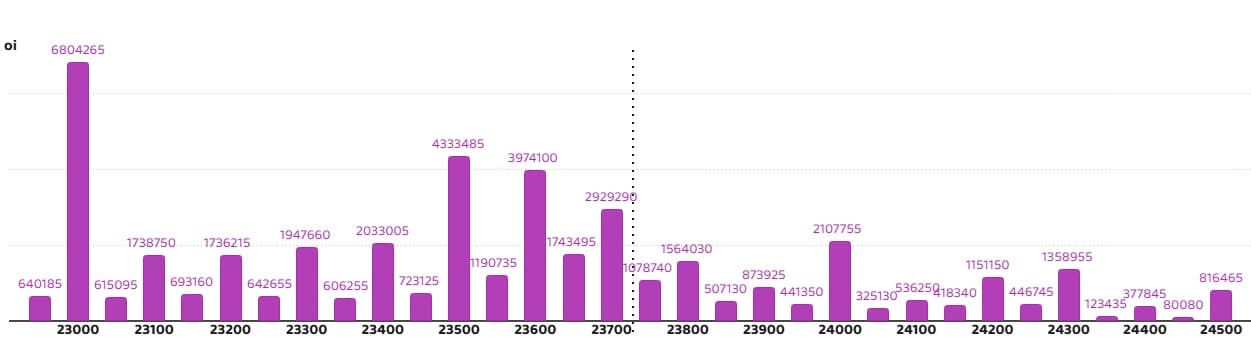
On the Put side, the maximum Put open interest was seen at the 23,000 strike (with 68.04 lakh contracts), which can act as a key support level for the Nifty in the short term. It was followed by the 23,500 strike (43.33 lakh contracts) and the 23,600 strike (39.74 lakh contracts).
The maximum Put writing was placed at the 23,600 strike, which saw an addition of 26.14 lakh contracts, followed by the 23,000 and 23,650 strikes, which added 15.53 lakh and 12.6 lakh contracts, respectively. The maximum Put unwinding was seen at the 23,900 strike, which shed 10.74 lakh contracts, followed by the 24,000 and 24,200 strikes, which shed 9.95 lakh and 8.07 lakh contracts, respectively.
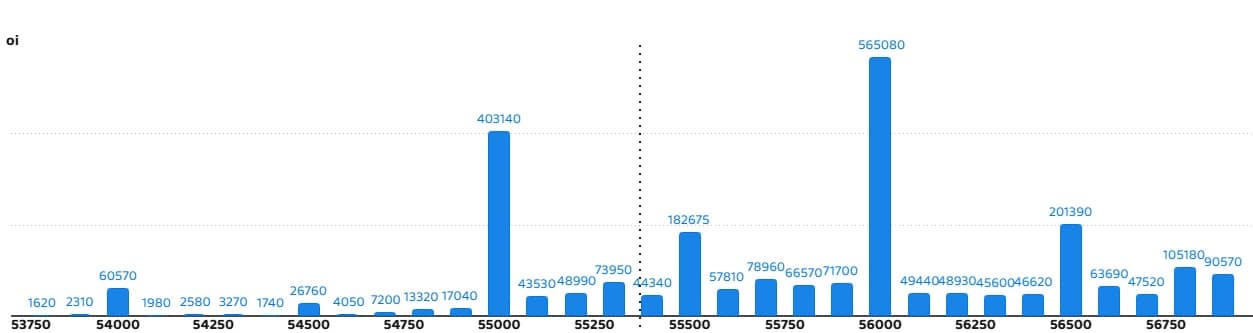
5) Bank Nifty Call Options Data
According to the monthly options data, the 56,000 strike holds the maximum Call open interest, with 5.65 lakh contracts. This can act as a key resistance level for the index in the short term. It was followed by the 55,000 strike (4.03 lakh contracts) and the 56,500 strike (2.01 lakh contracts).
Maximum Call writing was observed at the 55,000 strike (with the addition of 1.53 lakh contracts), followed by the 56,000 strike (1.06 lakh contracts) and 55,500 strike (66,870 contracts). The maximum Call unwinding was seen at the 56,700 strike, which shed 24,510 contracts, followed by the 56,200 and 56,500 strikes, which shed 22,680 and 15,480 contracts, respectively.
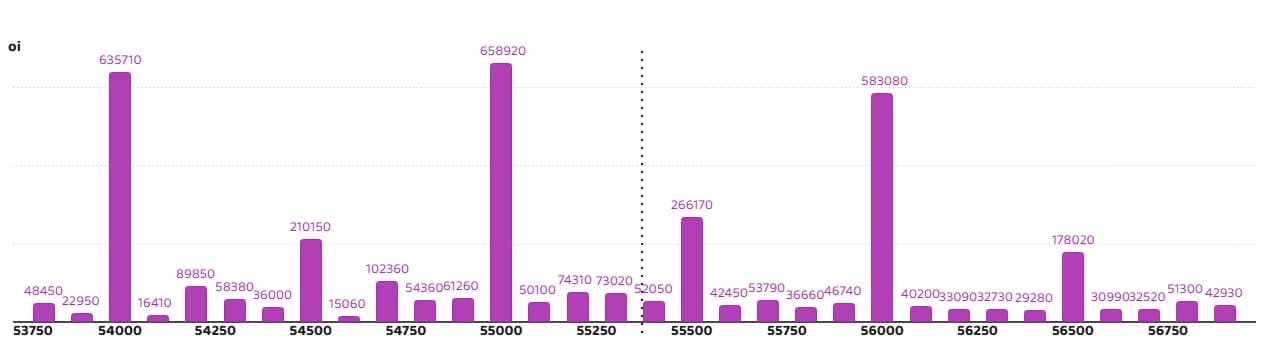
6) Bank Nifty Put Options Data
On the Put side, the maximum Put open interest was seen at the 55,000 strike (with 6.58 lakh contracts), which can act as a key support level for the index. This was followed by the 54,000 strike (6.35 lakh contracts) and the 56,000 strike (5.83 lakh contracts).
The maximum Put writing was placed at the 55,000 strike (which added 1.19 lakh contracts), followed by the 54,000 (1.01 lakh contracts) and 54,200 (78,630 contracts). The maximum Put unwinding was seen at the 56,000 strike, which shed 1.18 lakh contracts, followed by the 56,500 and 55,800 strikes, which shed 41,670 and 34,080 contracts, respectively.
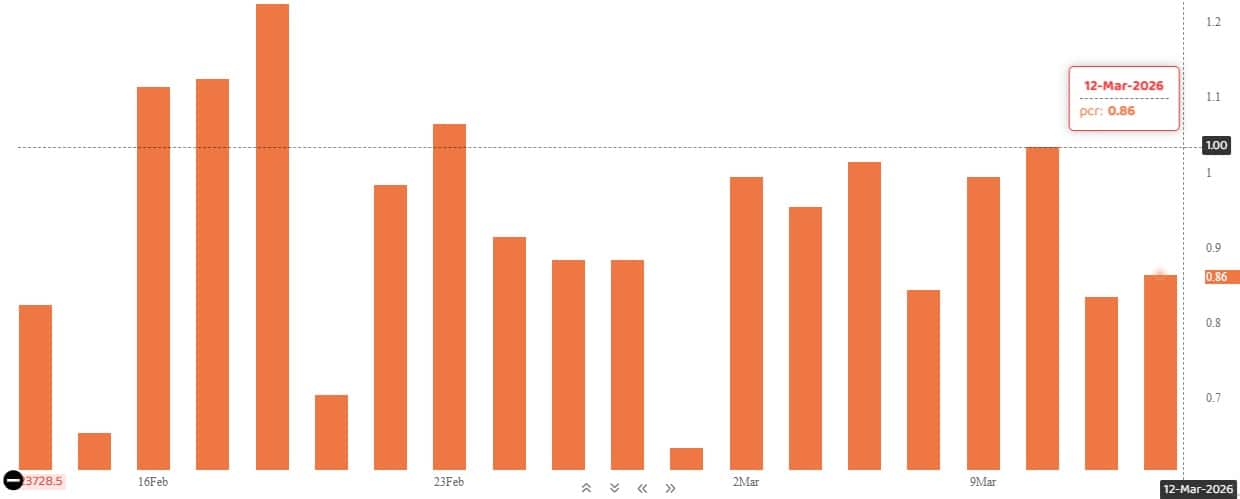
The Nifty Put-Call ratio (PCR), which indicates the mood of the market, increased to 0.86 on March 12, compared to a 0.83 in previous session.
The increasing PCR, or being higher than 0.7 or surpassing 1, means traders are selling more Put options than Call options, which generally indicates the firming up of a bullish sentiment in the market. If the ratio falls below 0.7 or moves towards 0.5, then it indicates selling in Calls is higher than selling in Puts, reflecting a bearish mood in the market.
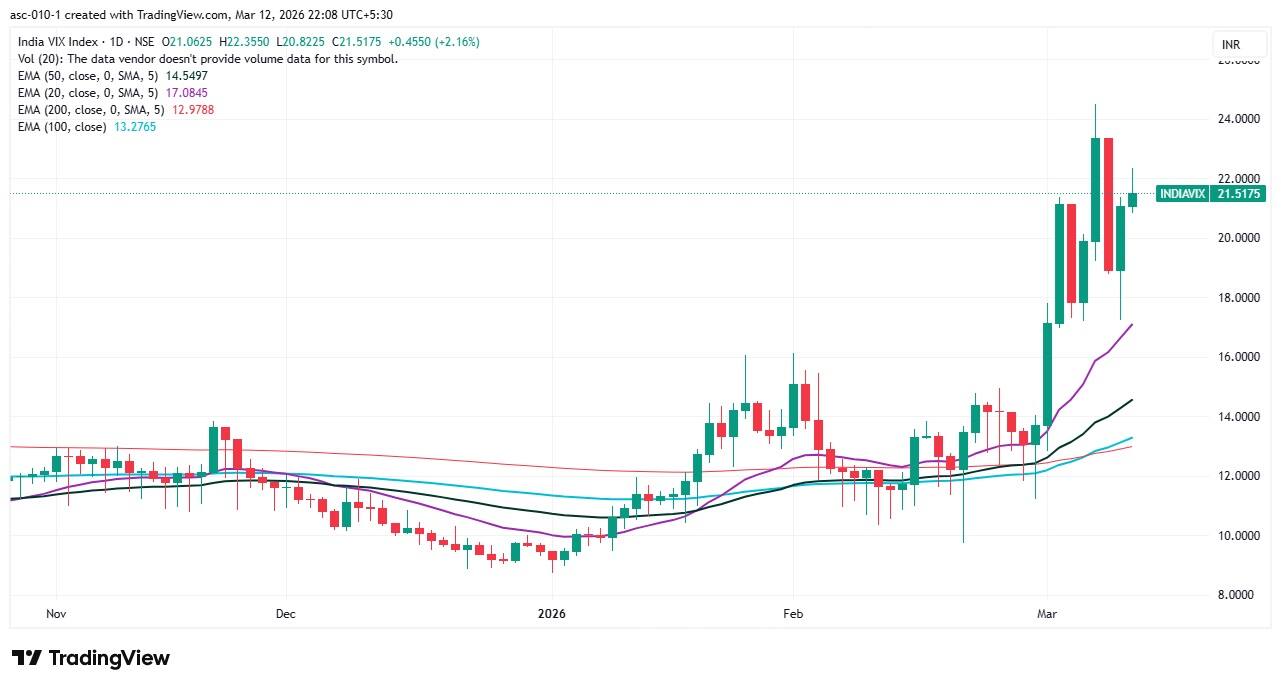
9) India VIX
The India VIX, which measures expected market volatility, maintained an upward bias and rose 2.16 percent to the 21.52 level. This signals elevated risk for bulls.
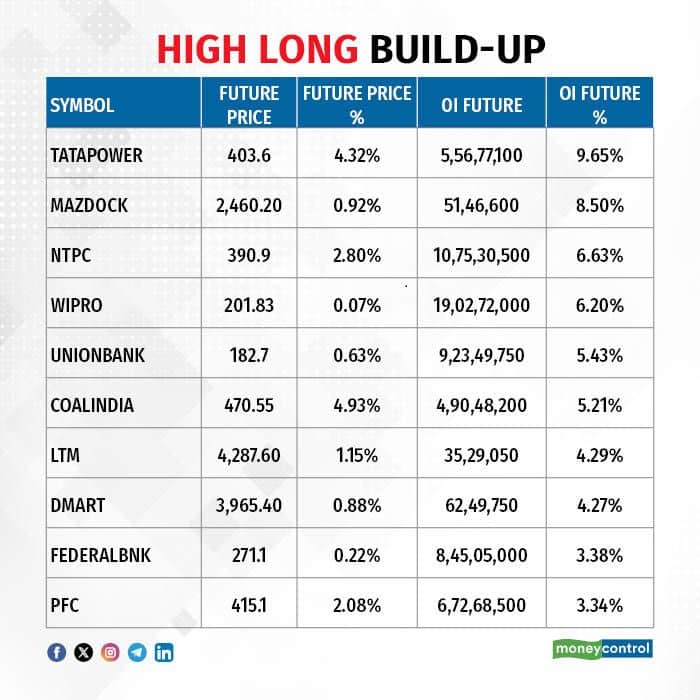
A long build-up was seen in 37 stocks. An increase in open interest (OI) and price indicates a build-up of long positions.
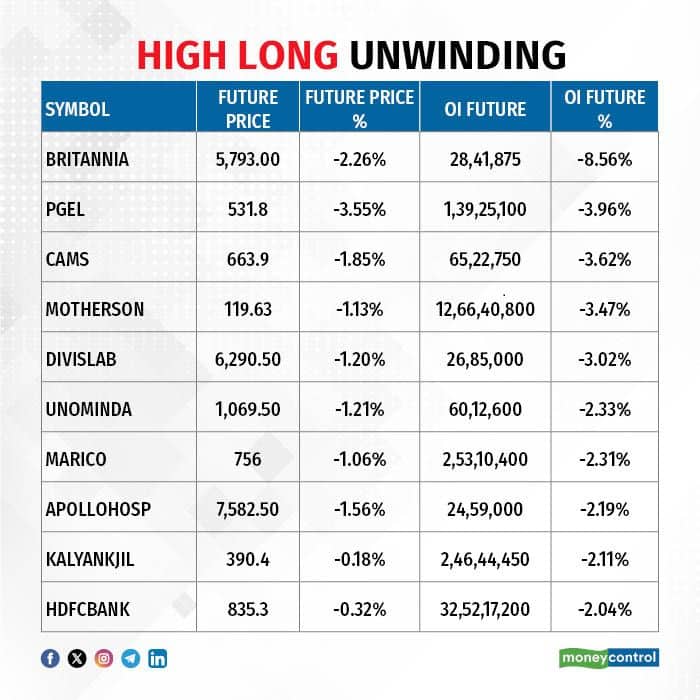
11) Long Unwinding (47 Stocks)
47 stocks saw a decline in open interest (OI) along with a fall in price, indicating long unwinding.
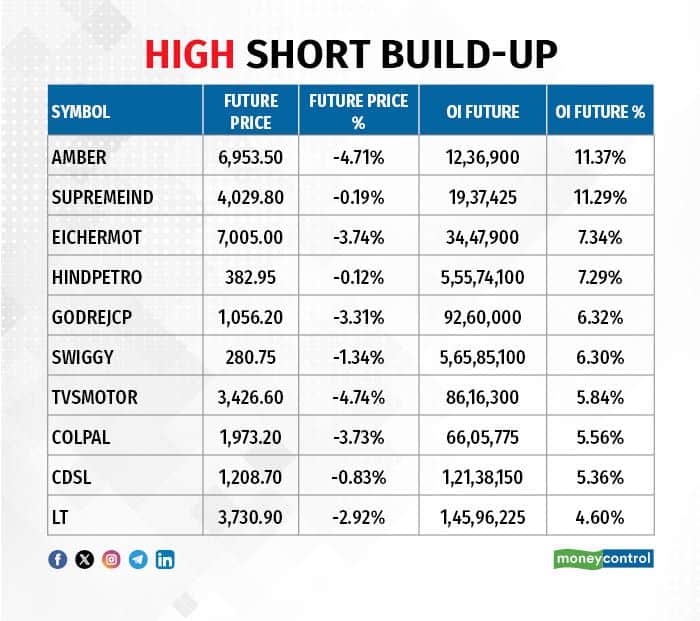
12) Short Build-up (91 Stocks)
91 stocks saw an increase in OI along with a fall in price, indicating a build-up of short positions.
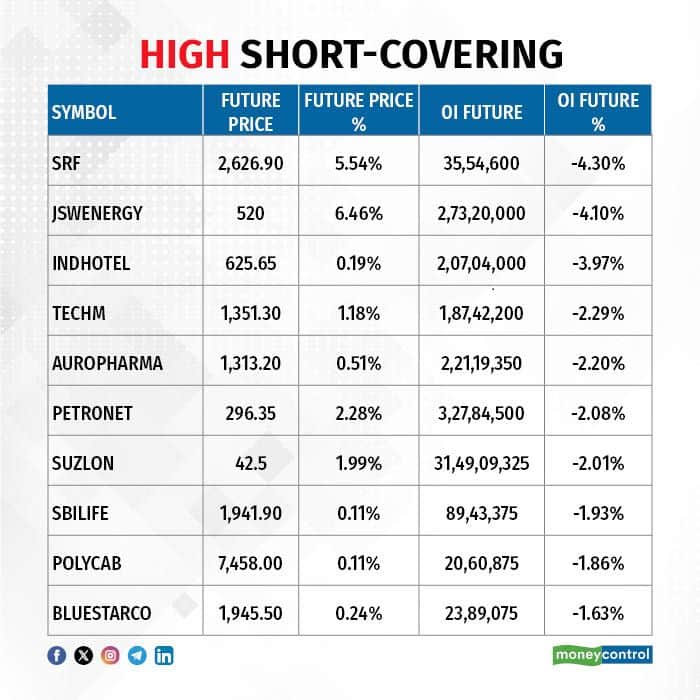
13) Short-Covering (32 Stocks)
32 stocks saw short-covering, meaning a decrease in OI, along with a price increase.
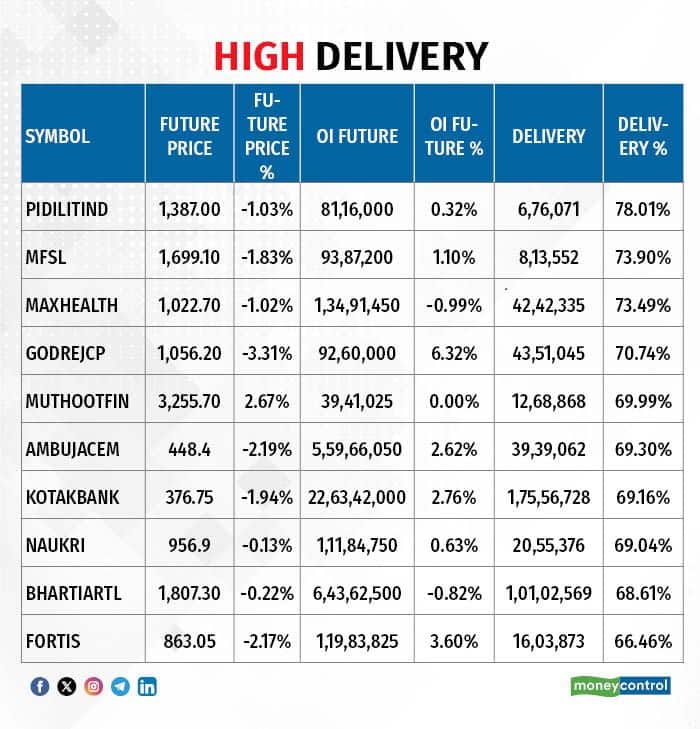
Here are the stocks that saw a high share of delivery trades. A high share of delivery reflects investing (as opposed to trading) interest in a stock.
Securities banned under the F&O segment include companies where derivative contracts cross 95 percent of the market-wide position limit.
Stocks added to F&O ban: Nil
Stocks retained in F&O ban: SAIL, Sammaan Capital
Stocks removed from F&O ban: Nil
Disclaimer: The views and investment tips expressed by experts on Moneycontrol are their own and not those of the website or its management. Moneycontrol advises users to check with certified experts before taking any investment decisions.Disclaimer: Moneycontrol is a part of the Network18 group. Network18 is controlled by Independent Media Trust, of which Reliance Industries is the sole beneficiary.Discover the latest Business News, Sensex, and Nifty updates. Obtain Personal Finance insights, tax queries, and expert opinions on Moneycontrol or download the Moneycontrol App to stay updated!


Find the best of Al News in one place, specially curated for you every weekend.
Stay on top of the latest tech trends and biggest startup news.


