


After two days of gains, the market failed to extend its northward journey on January 3, as profit booking pulled the Nifty 50 down by 184 points on above-average volumes. However, the index managed to hold the 24,000 mark on a closing basis. If the index sustains this level, it may face resistance at 24,200–24,250 (coinciding with the 50- and 100-day EMAs), followed by potential targets at 24,400 and 24,800. On the downside, falling below 24,000 would place immediate support at 23,900, with the key support zone at 23,750–23,700. Experts suggest that the index's trading range for the next week could be between 23,700 and 24,500.

Here are 15 data points we have collated to help you spot profitable trades:
1) Key Levels For The Nifty 50 (24,005)
Resistance based on pivot points: 24,143, 24,195, and 24,279
Support based on pivot points: 23,975, 23,923, and 23,839
Special Formation: The Nifty 50 has formed a Bearish Belt Hold pattern on the daily charts. This is generally a bearish reversal pattern, but it is not strong enough to act independently. Confirmation in the following session is required. Additionally, for sentiment to improve significantly, the index must begin trading above the midline of the Bollinger Bands. On a weekly timeframe, the index formed a bullish candlestick pattern with long upper and lower shadows, resembling a high wave pattern. This indicates indecision in the market.
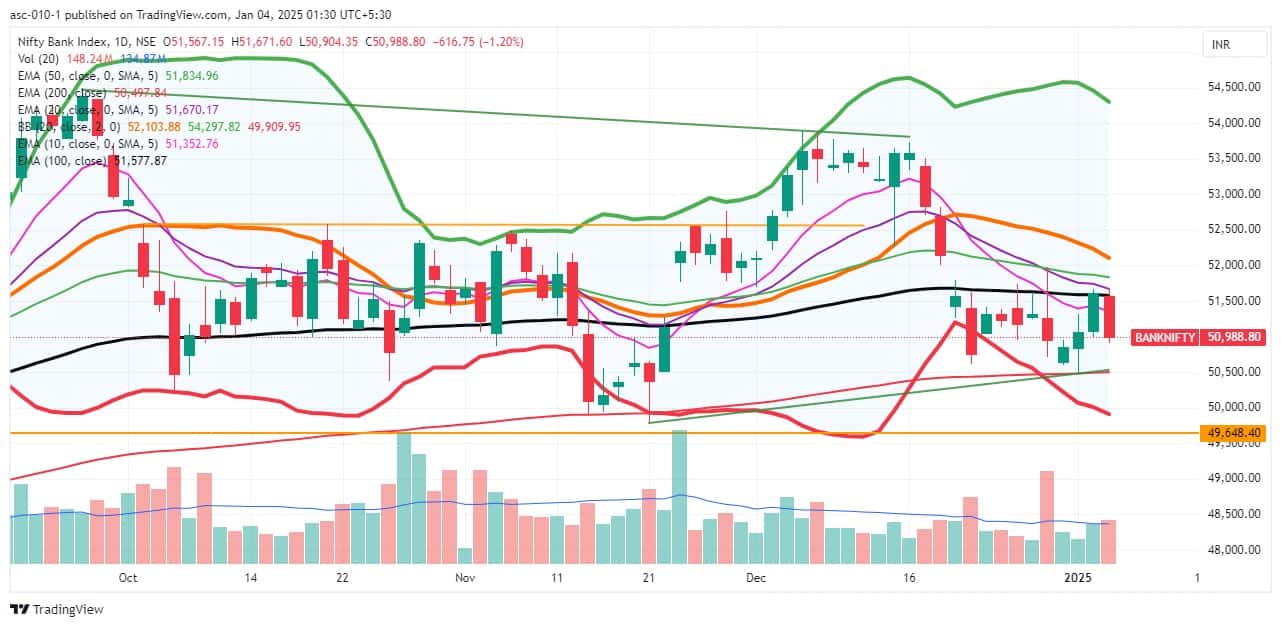
2) Key Levels For The Bank Nifty (50,989)
Resistance based on pivot points: 51,481, 51,662, and 51,955
Support based on pivot points: 50,895, 50,714, and 50,421
Resistance based on Fibonacci retracement: 51,570, 52,132
Support based on Fibonacci retracement: 50,671, 49,787
Special Formation: The Bank Nifty formed a long bearish candlestick pattern on the daily charts, accompanied by above-average volumes, erasing all the previous day's gains and signaling weakness. The index continues to trade below the 10-, 20-, 50-, and 100-day EMAs, indicating a weak trend. On Friday, it fell by 1.2%, and for the week, it shed 0.63%. On the weekly timeframe, it also formed a bearish candlestick pattern with long upper and lower wicks, signaling indecision among buyers and sellers. Although the index made an attempt to surpass the midline of the Bollinger Bands, it failed to do so.
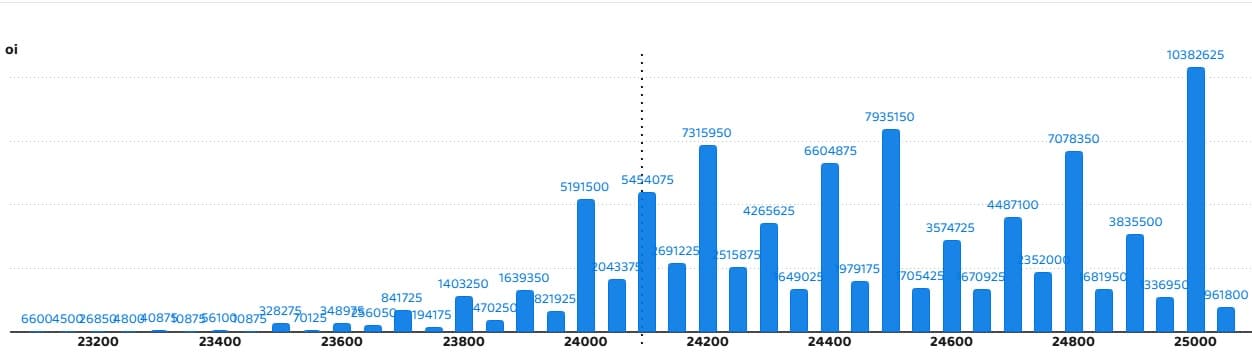
According to the weekly options data, the 25,000 strike holds the maximum Call open interest (with 1.03 crore contracts). This level can act as a key resistance for the Nifty in the short term. It was followed by the 24,500 strike (79.35 lakh contracts) and the 24,200 strike (73.15 lakh contracts).
Maximum Call writing was observed at the 24,500 strike, which saw an addition of 49.83 lakh contracts, followed by the 25,000 and 24,400 strikes, which added 49.07 lakh and 44.27 lakh contracts, respectively. The maximum Call unwinding was seen at the 23,700 strike, which shed 64,050 contracts, followed by the 23,400 and 23,200 strikes, which shed 14,550 and 12,900 contracts, respectively.
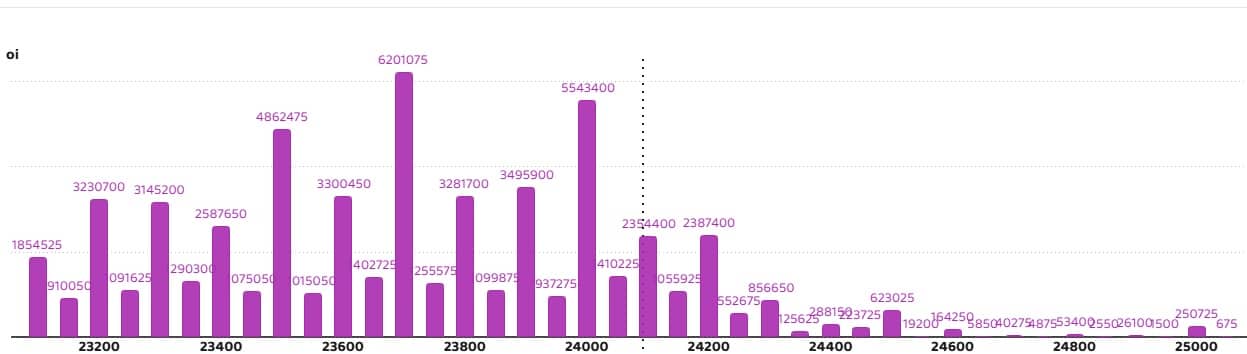
On the Put side, the 23,700 strike holds the maximum Put open interest (with 62.01 lakh contracts), which can act as a key support level for the Nifty. It was followed by the 24,000 strike (55.43 lakh contracts) and the 23,500 strike (48.62 lakh contracts).
The maximum Put writing was placed at the 23,700 strike, which saw an addition of 34.88 lakh contracts, followed by the 23,500 and 23,300 strikes, which added 19.33 lakh and 16.7 lakh contracts, respectively. The maximum Put unwinding was seen at the 24,200 strike, which shed 5.46 lakh contracts, followed by the 23,900 and 24,400 strikes, which shed 42,900 and 10,800 contracts, respectively.
5) Bank Nifty Call Options Data
According to the monthly options data, the 52,000 strike holds the maximum Call open interest, with 17.02 lakh contracts. This can act as a key resistance level for the index in the short term. It was followed by the 53,000 strike (16.29 lakh contracts) and the 51,500 strike (10.93 lakh contracts).
Maximum Call writing was visible at the 52,000 strike (with the addition of 4.26 lakh contracts), followed by the 51,500 strike (3.23 lakh contracts) and the 53,000 strike (2.98 lakh contracts). There was hardly any Call unwinding seen in the 49,250-53,250 strike band.

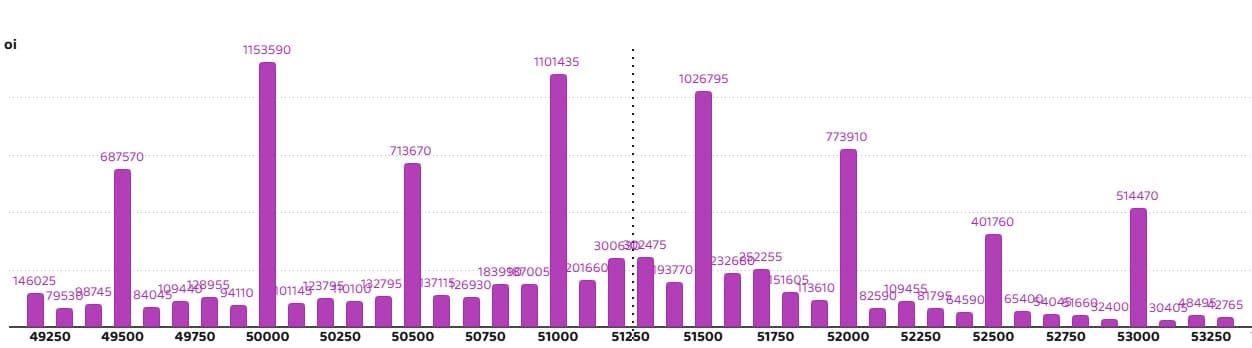
6) Bank Nifty Put Options Data
On the Put side, the maximum Put open interest was seen at the 50,000 strike (with 11.53 lakh contracts), which can act as a key support level for the index. This was followed by the 51,000 strike (11.01 lakh contracts) and the 51,500 strike (10.26 lakh contracts).
The maximum Put writing was observed at the 50,000 strike (which added 1.37 lakh contracts), followed by the 49,500 strike (61,710 contracts) and the 51,300 strike (34,065 contracts). The maximum Put unwinding was seen at the 50,800 strike, which shed 39,645 contracts, followed by the 50,200 and 50,700 strikes which shed 38,175 and 30,120 contracts, respectively.
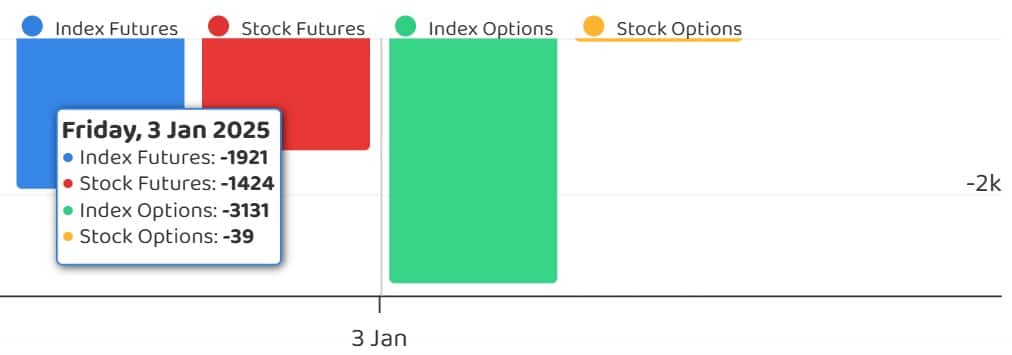
7) Funds Flow (Rs crore)
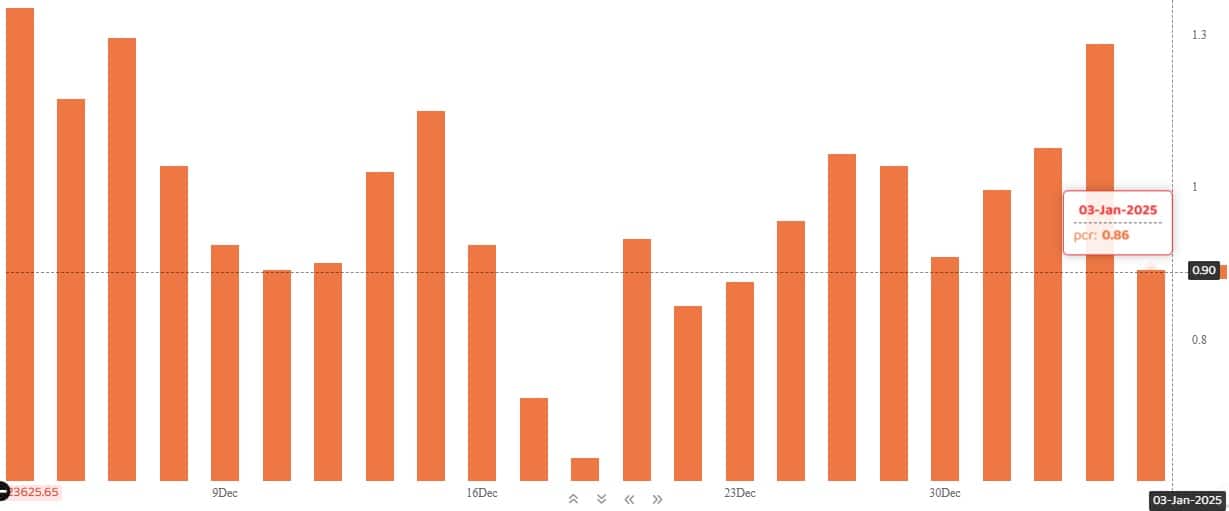
The Nifty Put-Call ratio (PCR), which indicates the mood of the market, dropped sharply to 0.86 on January 3, from 1.23 level in the previous session.
The increasing PCR, or being higher than 0.7 or surpassing 1, means traders are selling more Put options than Call options, which generally indicates the firming up of a bullish sentiment in the market. If the ratio falls below 0.7 or moves towards 0.5, then it indicates selling in Calls is higher than selling in Puts, reflecting a bearish mood in the market.
9) India VIX
The India VIX, which measures market volatility, extended its downtrend for another session, falling 1.44% to 13.54. Sustaining levels below 14 could provide comfort for bulls.

A long build-up was seen in 44 stocks. An increase in open interest (OI) and price indicates a build-up of long positions.
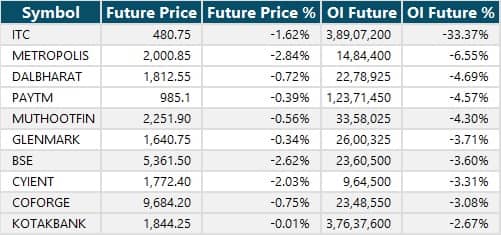
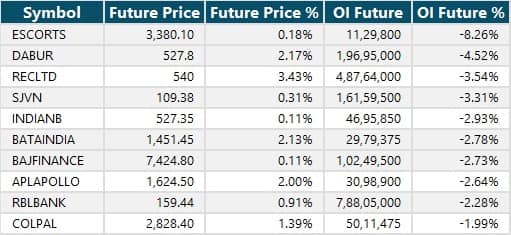
11) Long Unwinding (52 Stocks)
52 stocks saw a decline in open interest (OI) along with a fall in price, indicating long unwinding.
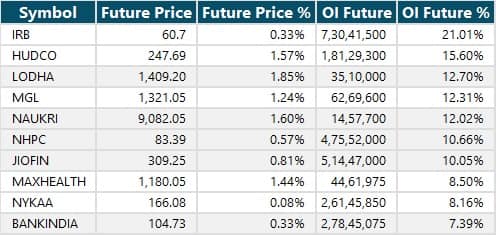
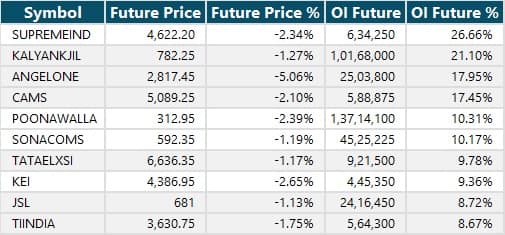
12) Short Build-up (100 Stocks)
100 stocks saw an increase in OI along with a fall in price, indicating a build-up of short positions.
13) Short-Covering (31 Stocks)
31 stocks saw short-covering, meaning a decrease in OI, along with a price increase.
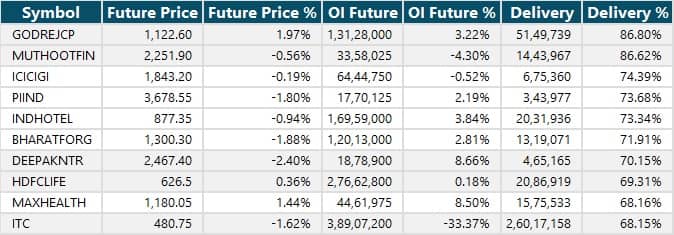
Here are the stocks that saw a high share of delivery trades. A high share of delivery reflects investing (as opposed to trading) interest in a stock.
Securities banned under the F&O segment include companies where derivative contracts cross 95 percent of the market-wide position limit.
Stocks added to F&O ban: Nil
Stocks retained in F&O ban: Manappuram Finance, RBL Bank
Stocks removed from F&O ban: Nil
Disclaimer: The views and investment tips expressed by experts on Moneycontrol are their own and not those of the website or its management. Moneycontrol advises users to check with certified experts before taking any investment decisions.Disclosure: Moneycontrol is a part of the Network18 group. Network18 is controlled by Independent Media Trust, of which Reliance Industries is the sole beneficiary.Discover the latest Business News, Sensex, and Nifty updates. Obtain Personal Finance insights, tax queries, and expert opinions on Moneycontrol or download the Moneycontrol App to stay updated!
Find the best of Al News in one place, specially curated for you every weekend.
Stay on top of the latest tech trends and biggest startup news.


