


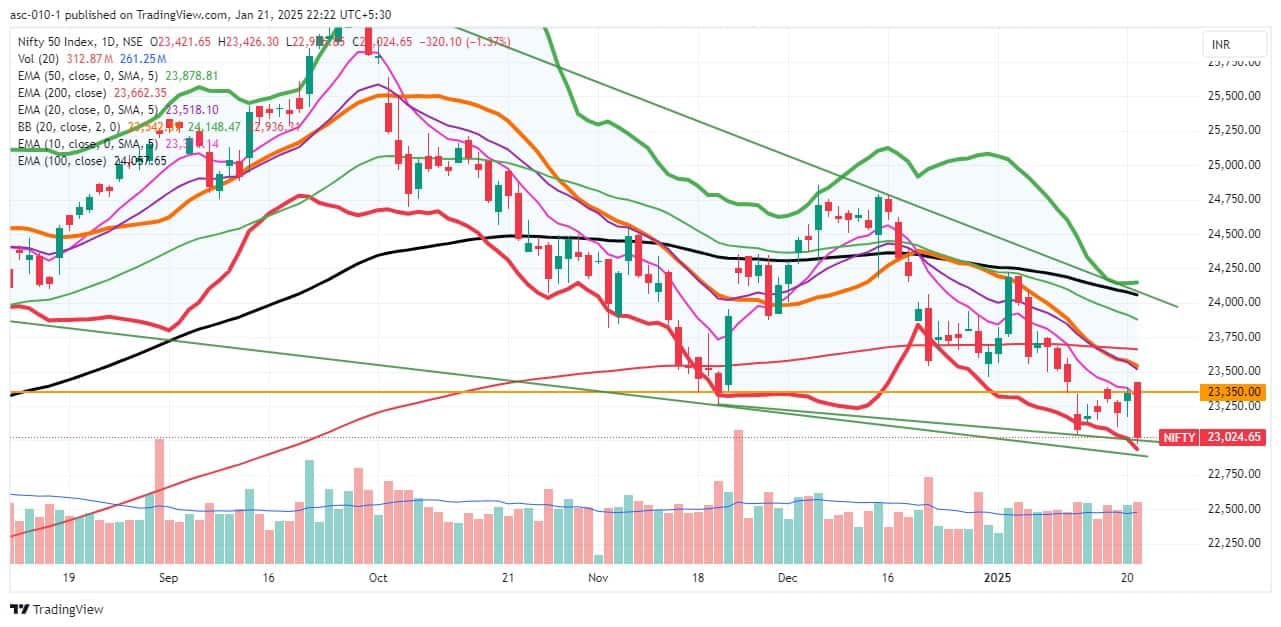
The Nifty 50 nosedived sharply and erased all its previous day's gains, correcting by 1.4 percent on January 21 and forming a long Bearish Engulfing candlestick pattern on the daily charts, testing the downward-sloping support trendline intraday, indicating weakness. The index has broken its 23,400-23,050 range on the lower side and closed at 23,025. Hence, if the index fails to defend the 23,000 level in the upcoming sessions on a closing basis, the selling pressure may extend towards 22,800, the immediate support, followed by 22,600 as the next support. However, on the higher side, 23,200-23,300 is the hurdle zone, according to experts.
Here are 15 data points we have collated to help you spot profitable trades:
1) Key Levels For The Nifty 50 (23,025)
Resistance based on pivot points: 23,314, 23,420, and 23,592
Support based on pivot points: 22,971, 22,865, and 22,693
Special Formation: The Nifty 50 formed a long bearish candle, engulfing the narrow-range movement of the last six sessions on the downside, with above-average volumes, indicating that bears hold strong control over the market. The momentum indicators—RSI (Relative Strength Index at 35.37)—remained in the lower band, and MACD (Moving Average Convergence Divergence) stayed below the zero line. The index traded near the lower band of Bollinger Bands and well below all key moving averages, indicating a negative trend.
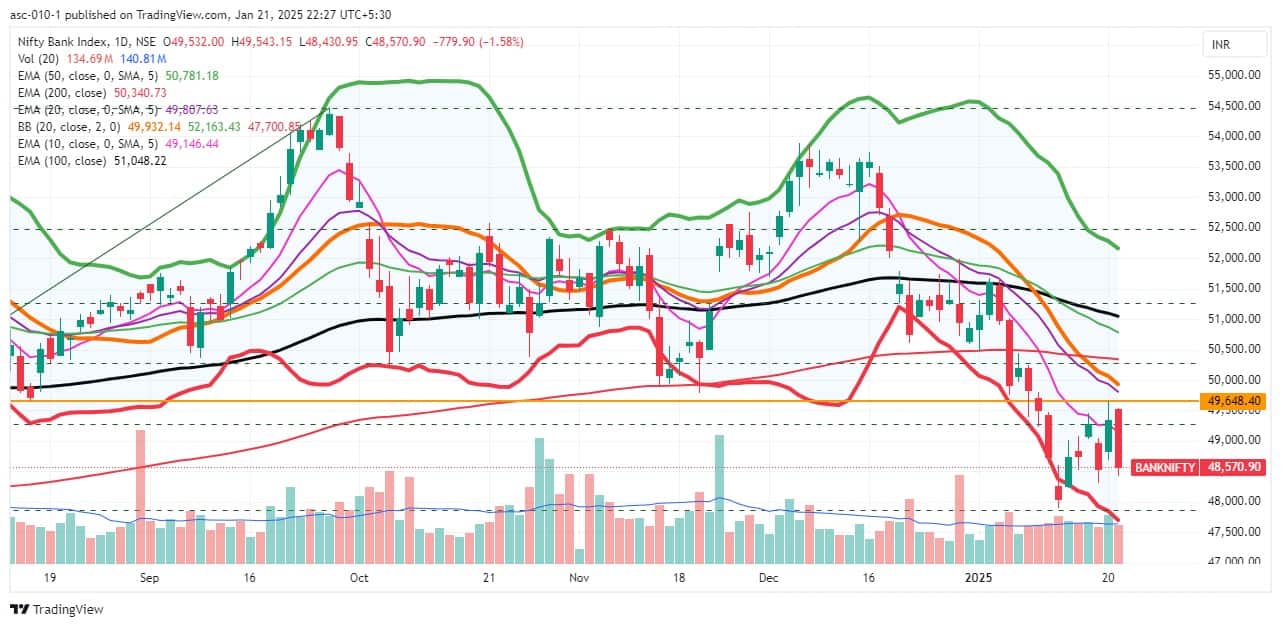
2) Key Levels For The Bank Nifty (48,571)
Resistance based on pivot points: 49,273, 49,536, and 49,961
Support based on pivot points: 48,423, 48,161, and 47,736
Resistance based on Fibonacci retracement: 49,457, 50,401
Support based on Fibonacci retracement: 47,876, 46,078
Special Formation: The Bank Nifty also formed a bearish engulfing-like candlestick pattern on the daily timeframe, sustaining below all key moving averages, indicating weakness. However, it took support at the upward-sloping support trendline adjoining the lows of January 13 and 17, which is a bit positive. The momentum indicators remained in the negative terrain.
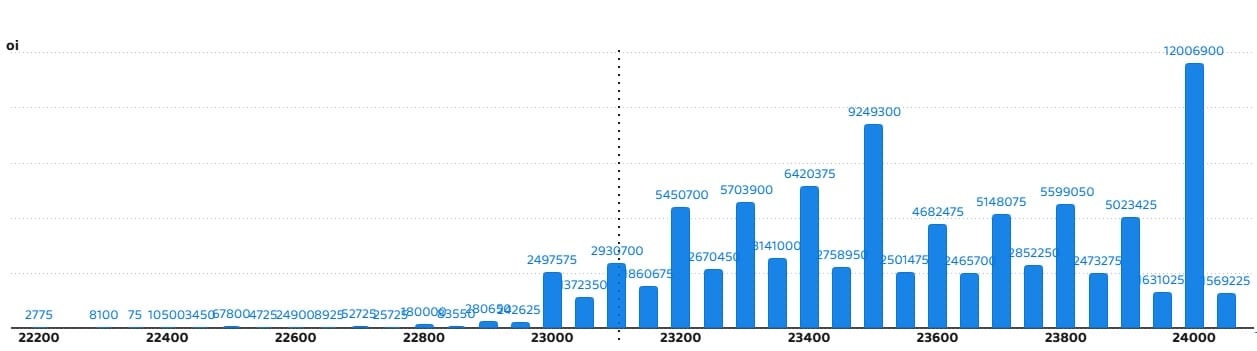
According to the weekly options data, the 24,000 strike holds the maximum Call open interest (with 1.2 crore contracts). This level can act as a key resistance for the Nifty in the short term. It was followed by the 23,500 strike (92.49 lakh contracts) and the 23,400 strike (64.2 lakh contracts).
Maximum Call writing was observed at the 23,500 strike, which saw an addition of 46.41 lakh contracts, followed by the 23,400 and 24,000 strikes, which added 31.73 lakh and 29.39 lakh contracts, respectively. The maximum Call unwinding was seen at the 23,600 strike which shed 7.93 lakh contracts, followed by the 22,300 and 22,450 strikes, which shed 1,125 and 975 contracts, respectively.
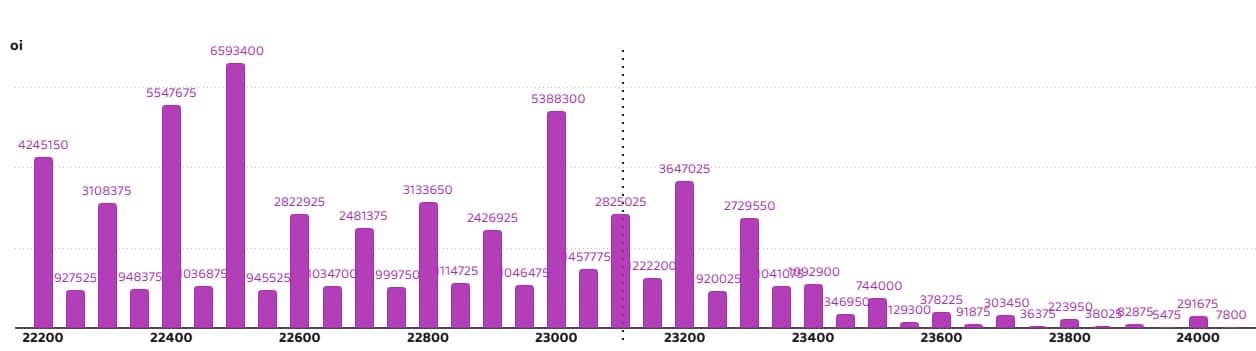
On the Put side, the maximum Put open interest was seen at the 22,500 strike (with 65.93 lakh contracts), which can act as a key support level for the Nifty. It was followed by the 22,400 strike (55.47 lakh contracts) and the 23,000 strike (53.88 lakh contracts).
The maximum Put writing was placed at the 22,400 strike, which saw an addition of 24.79 lakh contracts, followed by the 22,500 and 22,450 strikes, which added 3.83 lakh and 2.3 lakh contracts, respectively. The maximum Put unwinding was seen at the 23,200 strike, which shed 21.6 lakh contracts, followed by the 23,000 and 23,300 strikes, which shed 20.42 lakh and 19.14 lakh contracts, respectively.
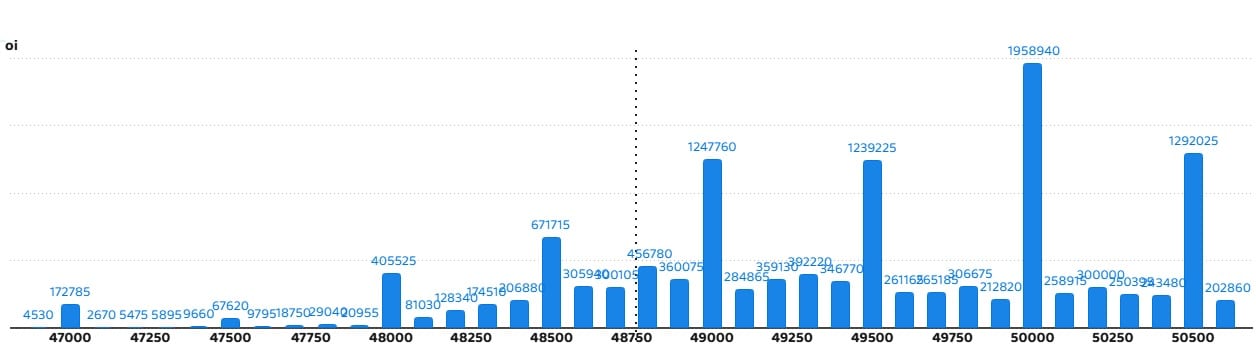
5) Bank Nifty Call Options Data
According to the monthly options data, the 50,000 strike holds the maximum Call open interest, with 19.58 lakh contracts. This can act as a key resistance level for the index in the short term. It was followed by the 50,500 strike (12.92 lakh contracts) and the 49,000 strike (12.47 lakh contracts).
Maximum Call writing was visible at the 50,000 strike (with the addition of 2.84 lakh contracts), followed by the 49,000 strike (2.64 lakh contracts) and the 50,500 strike (2.63 lakh contracts). The maximum Call unwinding was seen at the 48,000 strike, which shed 13,545 contracts, followed by the 47,900 and 47,800 strikes, which shed 3,795 and 3,195 contracts, respectively.
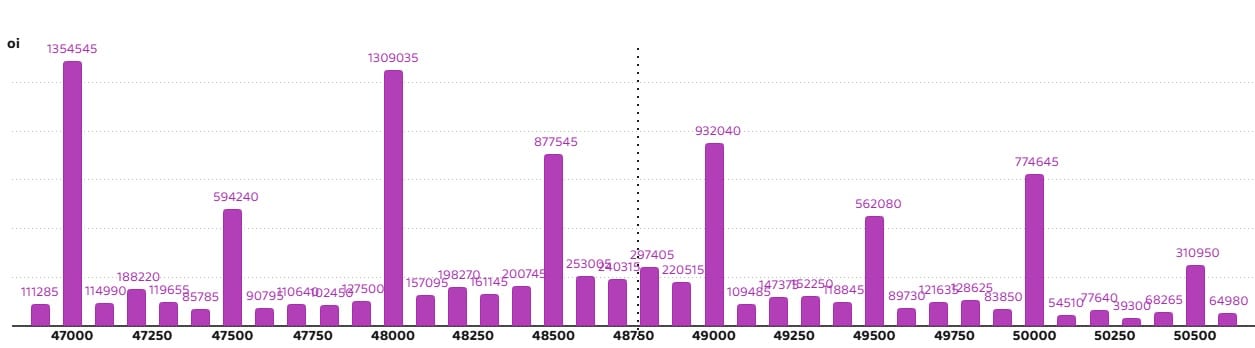
6) Bank Nifty Put Options Data
On the Put side, the maximum Put open interest was seen at the 47,000 strike (with 13.54 lakh contracts), which can act as a key support level for the index. This was followed by the 48,000 strike (13.09 lakh contracts) and the 49,000 strike (9.32 lakh contracts).
The maximum Put writing was observed at the 47,100 strike (which added 21,315 contracts), followed by the 49,900 strike (13,545 contracts) and the 47,200 strike (9,300 contracts). The maximum Put unwinding was seen at the 49,000 strike, which shed 4.79 lakh contracts, followed by the 49,400 and 49,500 strikes which shed 1.85 lakh and 1.72 lakh contracts, respectively.
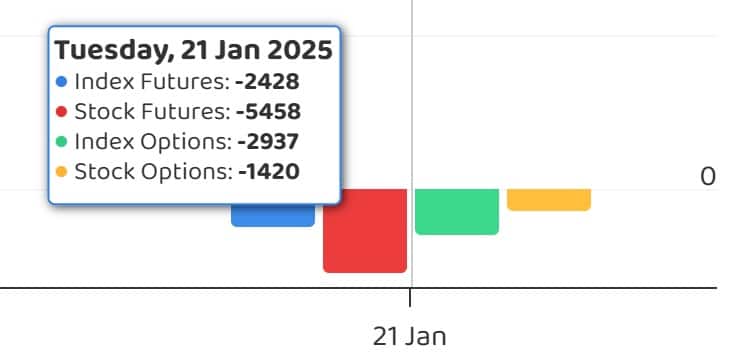
7) Funds Flow (Rs crore)
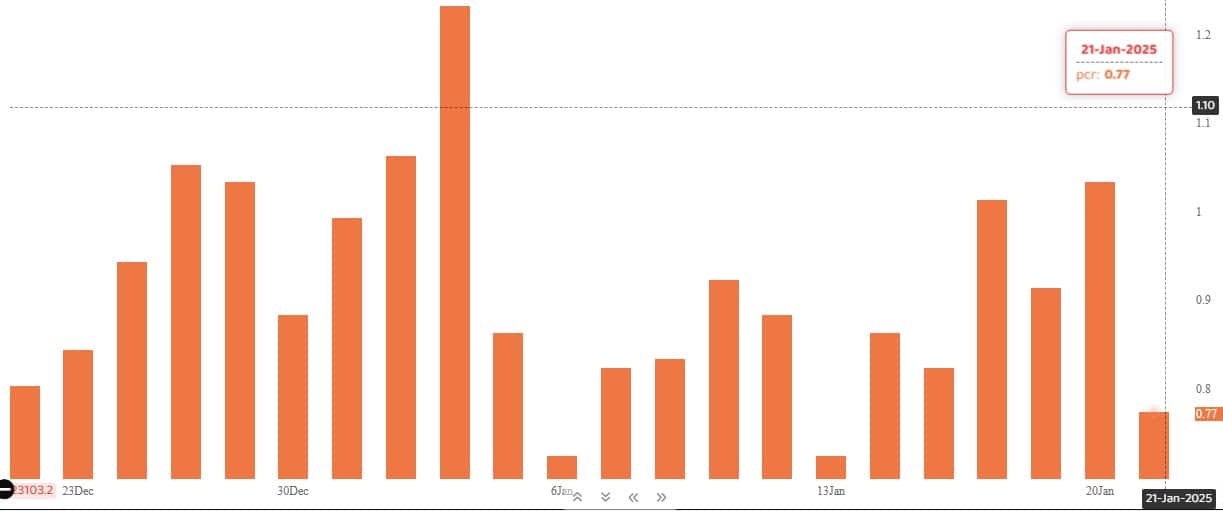
The Nifty Put-Call ratio (PCR), which indicates the mood of the market, dropped sharply to 0.77 on January 21, from 1.03 level in the previous session.
The increasing PCR, or being higher than 0.7 or surpassing 1, means traders are selling more Put options than Call options, which generally indicates the firming up of a bullish sentiment in the market. If the ratio falls below 0.7 or moves towards 0.5, then it indicates selling in Calls is higher than selling in Puts, reflecting a bearish mood in the market.
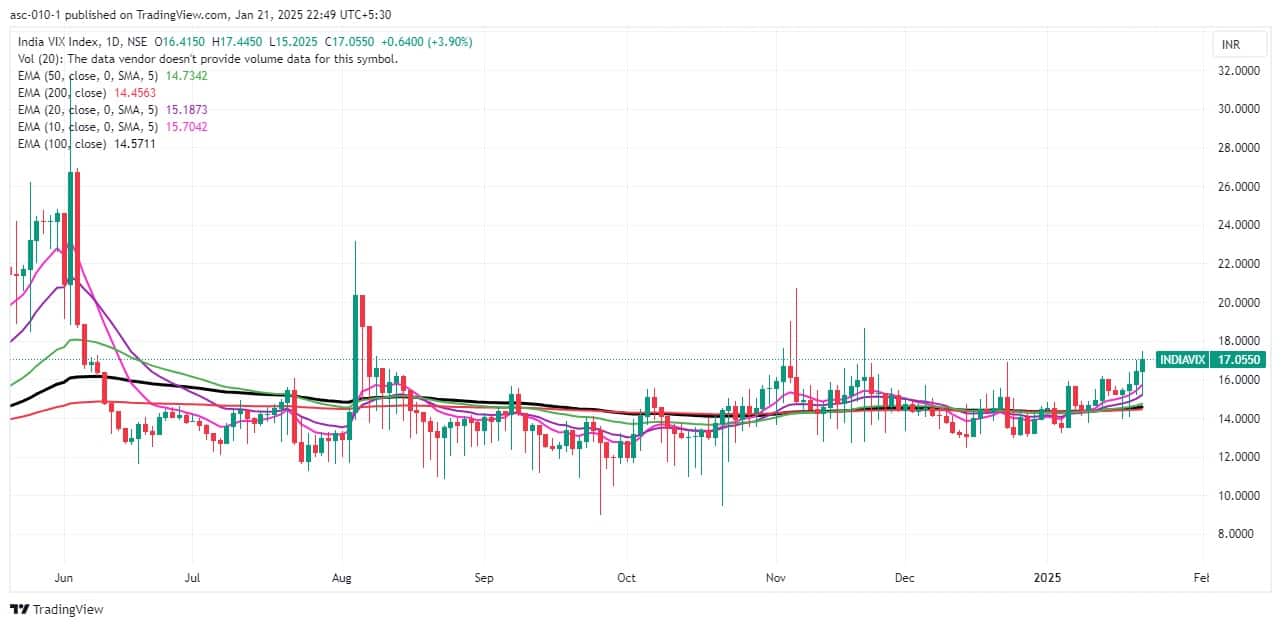
9) India VIX
India VIX, the volatility index that measures expected market volatility, extended its northward journey for the fourth consecutive session, rising 3.9 percent to 17.05, the highest closing level since August 6, 2024, making the bulls further uncomfortable.
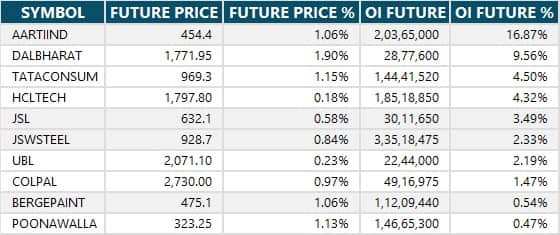
A long build-up was seen in 12 stocks. An increase in open interest (OI) and price indicates a build-up of long positions.
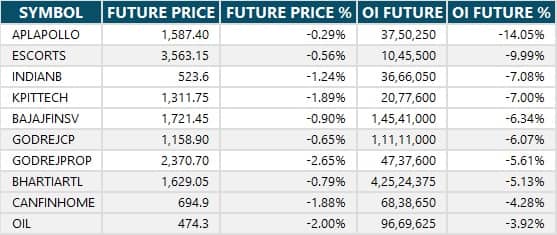
11) Long Unwinding (76 Stocks)
76 stocks saw a decline in open interest (OI) along with a fall in price, indicating long unwinding.
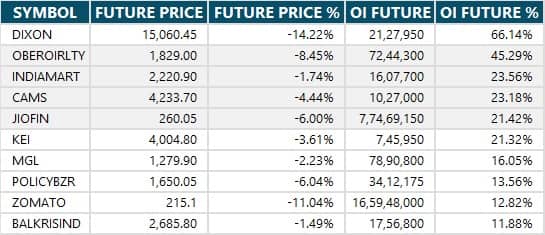
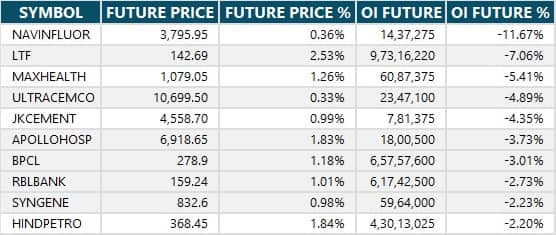
12) Short Build-up (125 Stocks)
125 stocks saw an increase in OI along with a fall in price, indicating a build-up of short positions.
13) Short-Covering (15 Stocks)
15 stocks saw short-covering, meaning a decrease in OI, along with a price increase.
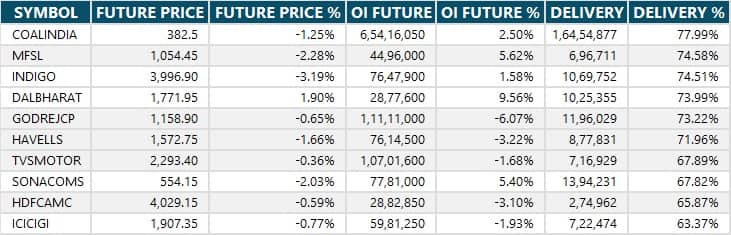
Here are the stocks that saw a high share of delivery trades. A high share of delivery reflects investing (as opposed to trading) interest in a stock.
Securities banned under the F&O segment include companies where derivative contracts cross 95 percent of the market-wide position limit.
Stocks added to F&O ban: Dixon Technologies, Mahanagar Gas
Stocks retained in F&O ban: Aditya Birla Fashion & Retail, Angel One, Bandhan Bank, Can Fin Homes, Kalyan Jewellers, L&T Finance, Manappuram Finance, RBL Bank
Stocks removed from F&O ban: Nil
Disclaimer: The views and investment tips expressed by experts on Moneycontrol are their own and not those of the website or its management. Moneycontrol advises users to check with certified experts before taking any investment decisions.Disclosure: Moneycontrol is a part of the Network18 group. Network18 is controlled by Independent Media Trust, of which Reliance Industries is the sole beneficiary.Discover the latest Business News, Sensex, and Nifty updates. Obtain Personal Finance insights, tax queries, and expert opinions on Moneycontrol or download the Moneycontrol App to stay updated!
Find the best of Al News in one place, specially curated for you every weekend.
Stay on top of the latest tech trends and biggest startup news.


