


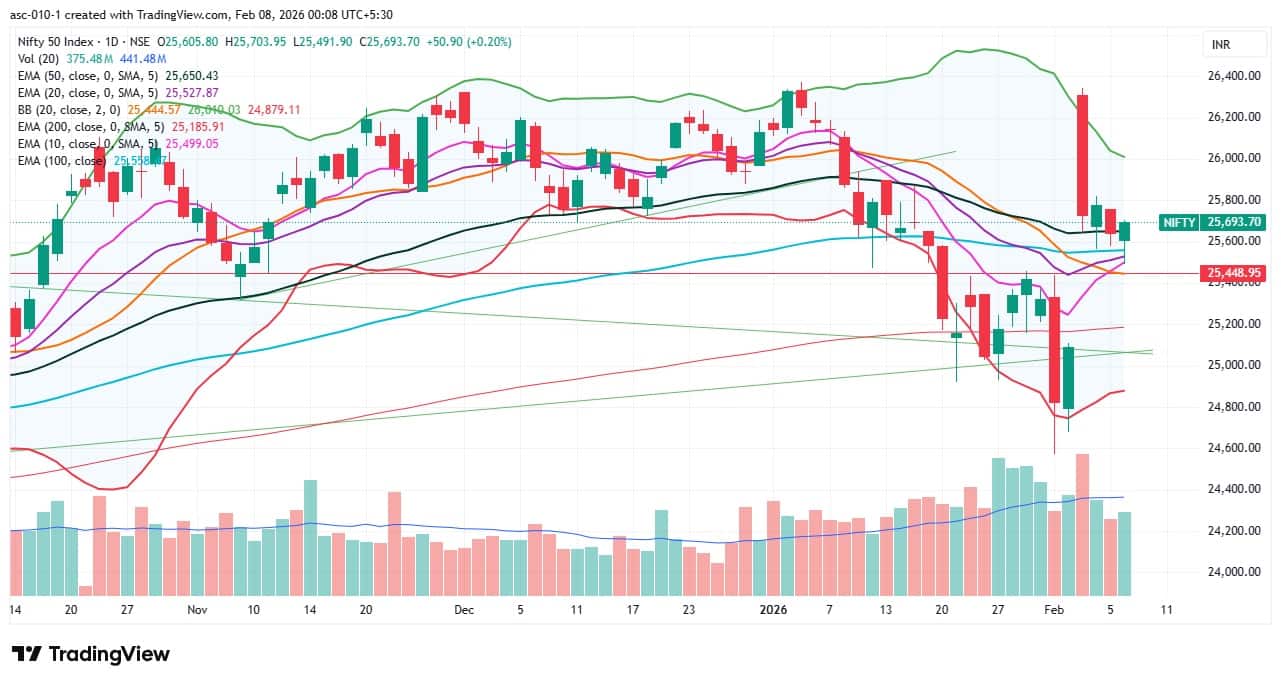
The Nifty 50 continued to consolidate for the third consecutive session but consistently defended Tuesday's long bullish gap on a closing basis, rising 0.2 percent on February 6. The partial filling of the gap consistently suggests that it could possibly be a bullish runaway gap, which is generally formed in the middle of an uptrend. The removal of 25 percent additional tariffs on Indian goods and the release of a framework for an interim trade agreement between the US and India are also expected to lift market sentiment in the upcoming sessions. Technically, the Nifty 50 is expected to face strong resistance in the 25,800–26,000 zone, as only above this level is a major upmove toward the previous week’s high possible. However, on the lower side, 25,500 is expected to be a crucial support, experts said.
Here are 15 data points we have collated to help you spot profitable trades:
1) Key Levels For The Nifty 50 (25,694)
Resistance based on pivot points: 25,711, 25,761, and 25,842
Support based on pivot points: 25,549, 25,499, and 25,418
Special Formation: The Nifty formed a bullish candle with a long lower shadow on the daily charts, indicating positive bias and buying interest at lower levels, while defending the 20-, 50-, and 100-day EMAs in a single session, with short-term moving averages trending upward. Consistently holding the bullish gap on a closing basis also supported positivity. The RSI was rangebound above 50 (at 52.72) after a recent strong jump from the oversold zone, along with a bullish crossover. The MACD maintained its upward journey with a positive crossover, and the histogram climbed further. All this indicates positive momentum.
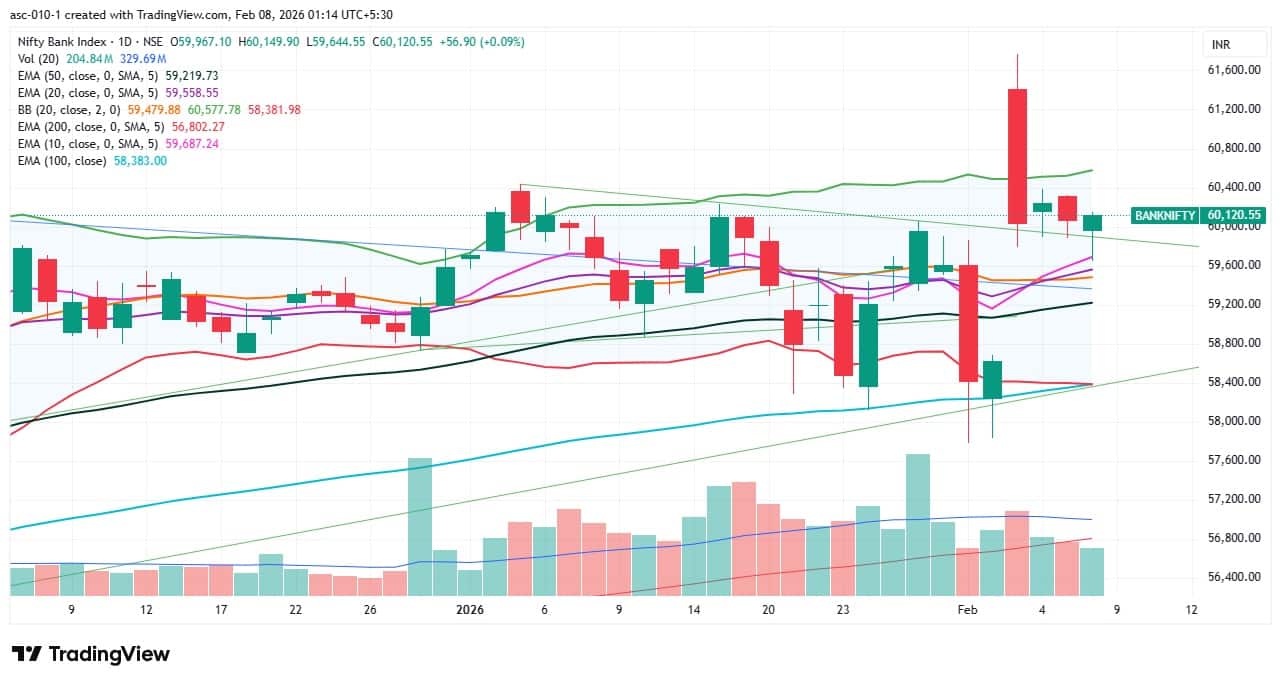
2) Key Levels For The Bank Nifty (60,121)
Resistance based on pivot points: 60,165, 60,284, and 60,477
Support based on pivot points: 59,779, 59,659, and 59,466
Resistance based on Fibonacci retracement: 60,437, 61,159
Support based on Fibonacci retracement: 59,461, 58,917
Special Formation: The Bank Nifty also formed a bullish candle with long lower shadows on the daily timeframe and defended the downward-sloping support trendline for the fourth straight session, signalling a healthy trend. The index sustained above all key moving averages, and these moving averages also trended upward. The RSI remained rangebound with a positive crossover at 55.99, while the MACD sustained above the reference and zero lines, with a further uptick in the histogram. All this indicates continued strength.
According to the weekly options data, the maximum Call open interest was seen at the 26,000 strike (with 1.44 crore contracts). This level can act as a key resistance level for the Nifty in the short term. It was followed by the 25,800 strike (1.09 crore contracts) and 26,500 strike (95.81 lakh contracts).
Maximum Call writing was observed at the 25,600 strike, which saw an addition of 16.18 lakh contracts, followed by the 25,950 and 26,300 strikes, which added 14.7 lakh and 9.59 lakh contracts, respectively. The maximum Call unwinding was seen at the 26,100 strike which shed 17.33 lakh contracts, followed by the 26,400 and 25,650 strikes, which shed 17.16 lakh and 4.97 lakh contracts, respectively.
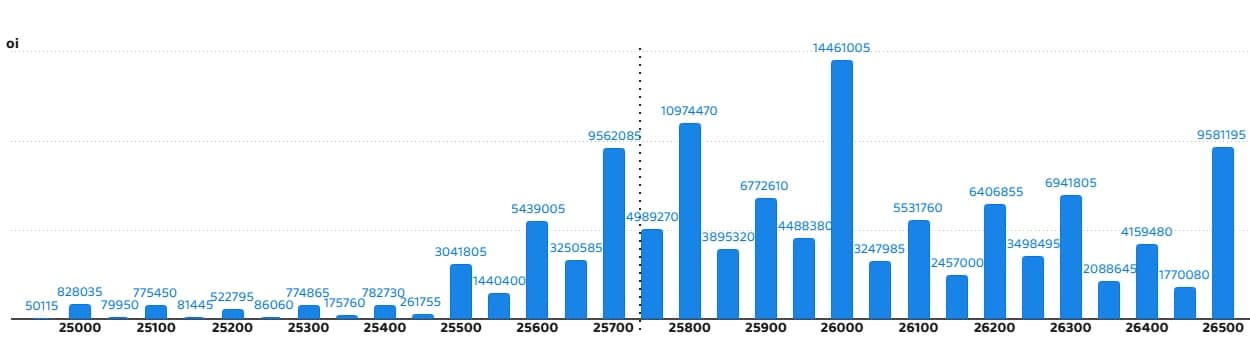
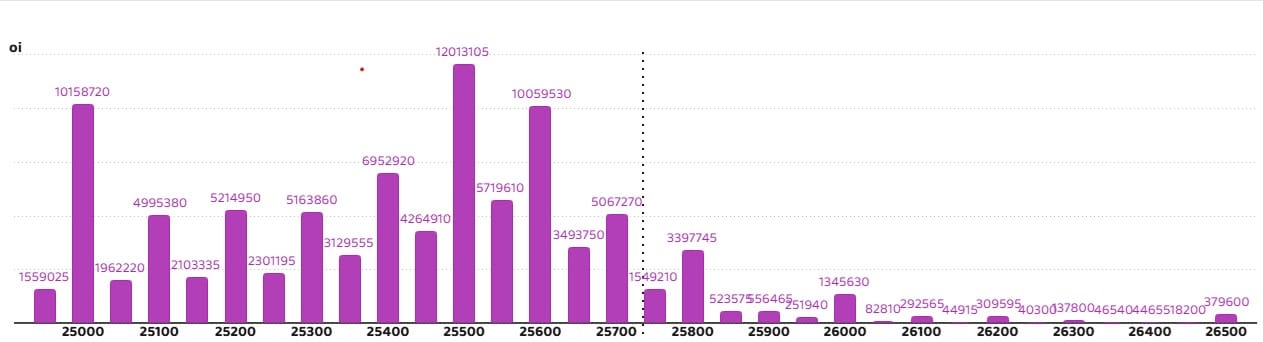
On the Put side, the 25,500 strike holds the maximum Put open interest (with 1.2 crore contracts), which can act as a key support level for the Nifty in the short term. It was followed by the 25,000 strike (1.01 crore contracts) and the 25,600 strike (1 crore contracts).
The maximum Put writing was placed at the 25,500 strike, which saw an addition of 57.02 lakh contracts, followed by the 25,600 and 25,550 strikes, which added 54.02 lakh and 36.39 lakh contracts, respectively. The maximum Put unwinding was seen at the 25,800 strike, which shed 7.6 lakh contracts, followed by the 25,900 and 26,100 strikes, which shed 1.03 lakh and 98,020 contracts, respectively.
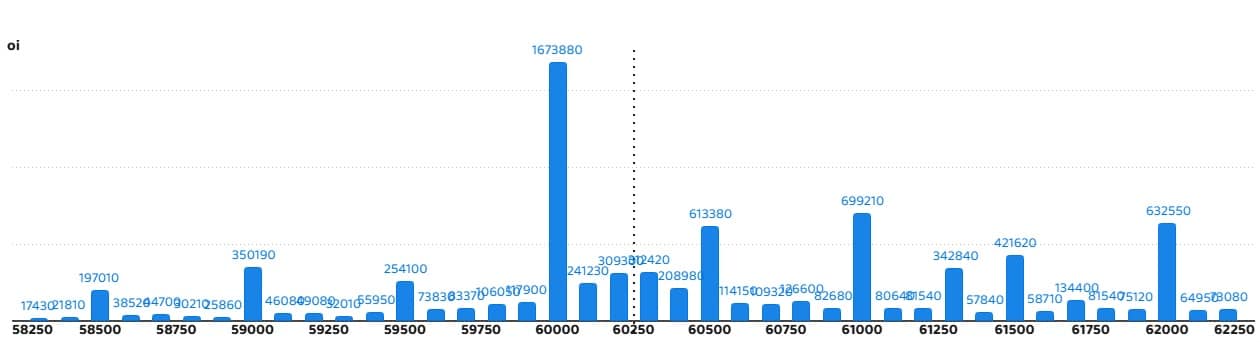
5) Bank Nifty Call Options Data
According to the monthly options data, the maximum Call open interest remained at the 60,000 strike, with 16.73 lakh contracts. This can act as a key level for the index in the short term. It was followed by the 61,000 strike (6.99 lakh contracts) and the 62,000 strike (6.32 lakh contracts).
Maximum Call writing was observed at the 61,300 strike (with the addition of 2.82 lakh contracts), followed by the 61,000 strike (87,240 contracts) and 60,000 strike (64,920 contracts). The maximum Call unwinding was seen at the 58,500 strike, which shed 7,950 contracts, followed by the 61,200 and 59,200 strikes which shed 3,870 and 2,850 contracts, respectively.
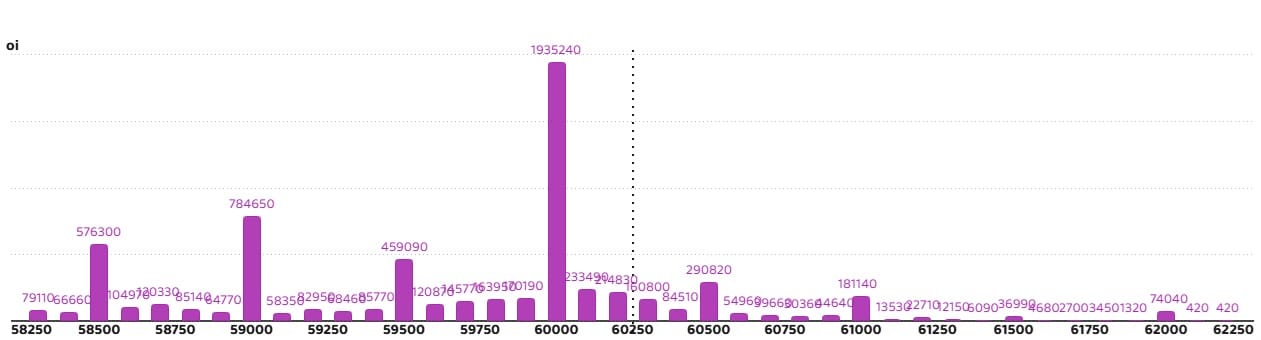
6) Bank Nifty Put Options Data
On the Put side, the 60,000 strike holds the maximum Put open interest (with 19.35 lakh contracts), which can act as a key support level for the index. This was followed by the 59,000 strike (7.84 lakh contracts) and the 58,500 strike (5.76 lakh contracts).
The maximum Put writing was placed at the 59,500 strike (which added 54,390 contracts), followed by the 59,700 strike (50,640 contracts) and the 59,900 strike (44,310 contracts). The maximum Put unwinding was seen at the 60,500 strike which shed 30,510 contracts, followed by the 60,300 and 60,400 strikes, which shed 30,420 and 20,670 contracts, respectively.
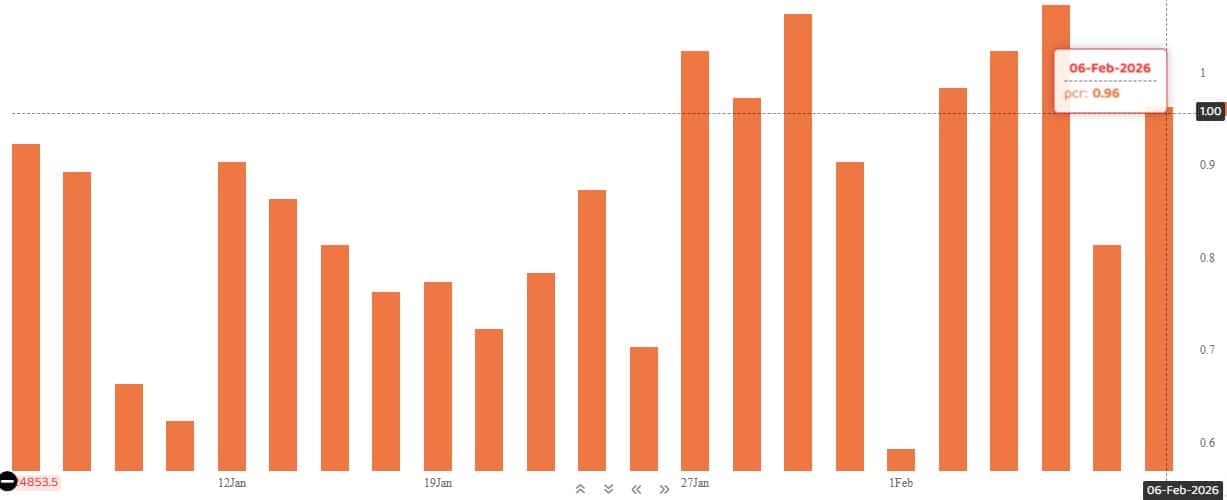
The Nifty Put-Call ratio (PCR), which indicates the mood of the market, jumped to 0.96 on February 6, compared to 0.81 in the previous session.
The increasing PCR, or being higher than 0.7 or surpassing 1, means traders are selling more Put options than Call options, which generally indicates the firming up of a bullish sentiment in the market. If the ratio falls below 0.7 or moves towards 0.5, then it indicates selling in Calls is higher than selling in Puts, reflecting a bearish mood in the market.
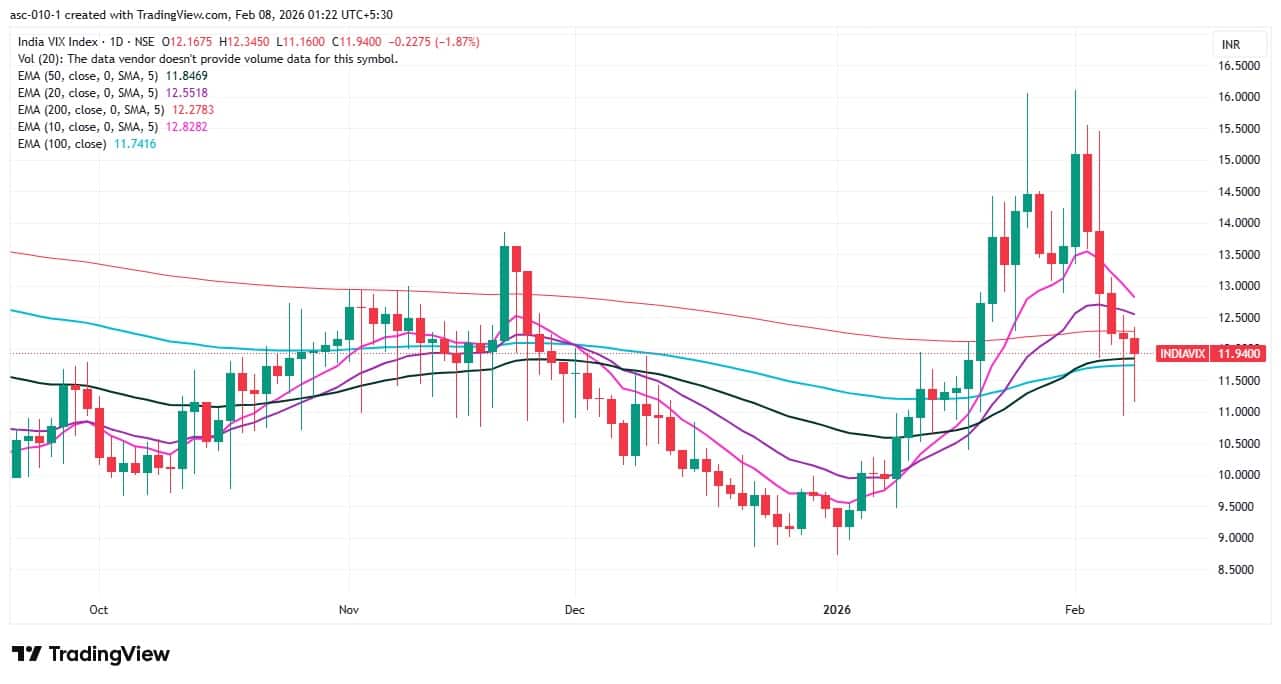
9) India VIX
India VIX, which measures expected market volatility, fell 1.87 percent to 11.94, extending its downtrend throughout the week and falling below the 200-day EMA as well as short-term moving averages, which gives comfort to bulls.
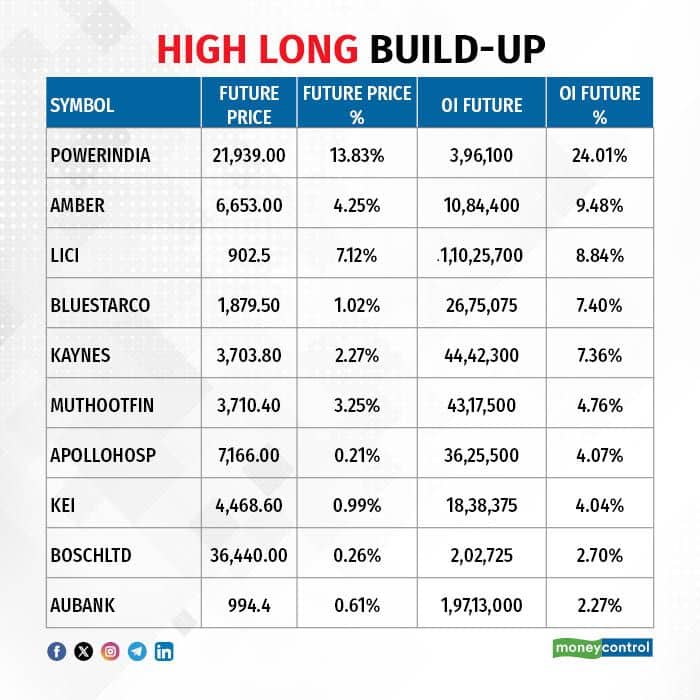
A long build-up was seen in 45 stocks. An increase in open interest (OI) and price indicates a build-up of long positions.
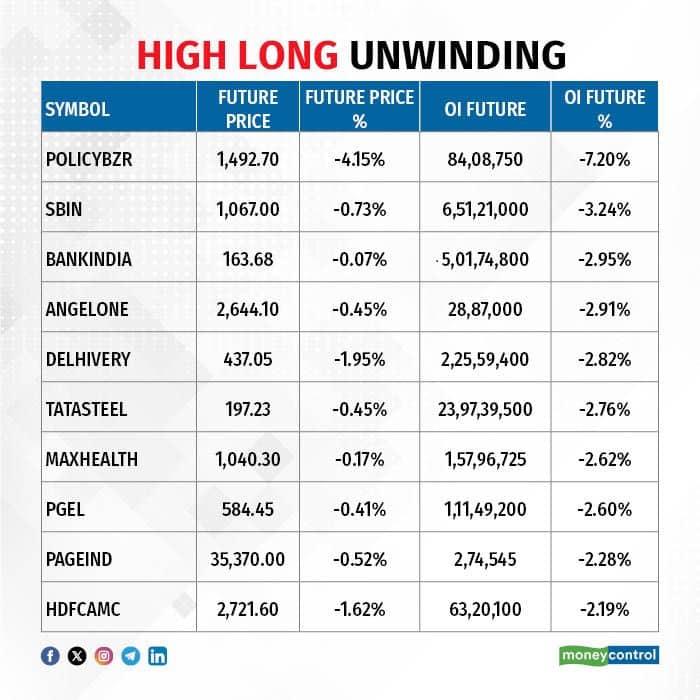
11) Long Unwinding (37 Stocks)
37 stocks saw a decline in open interest (OI) along with a fall in price, indicating long unwinding.
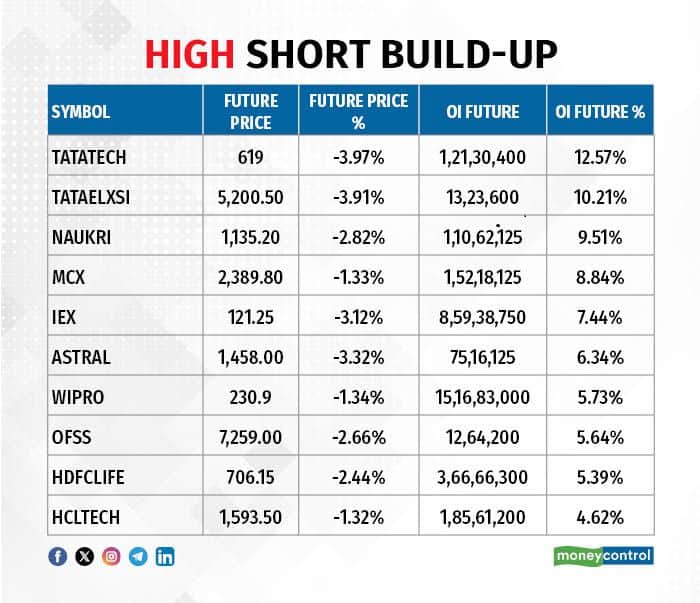
12) Short Build-up (82 Stocks)
82 stocks saw an increase in OI along with a fall in price, indicating a build-up of short positions.
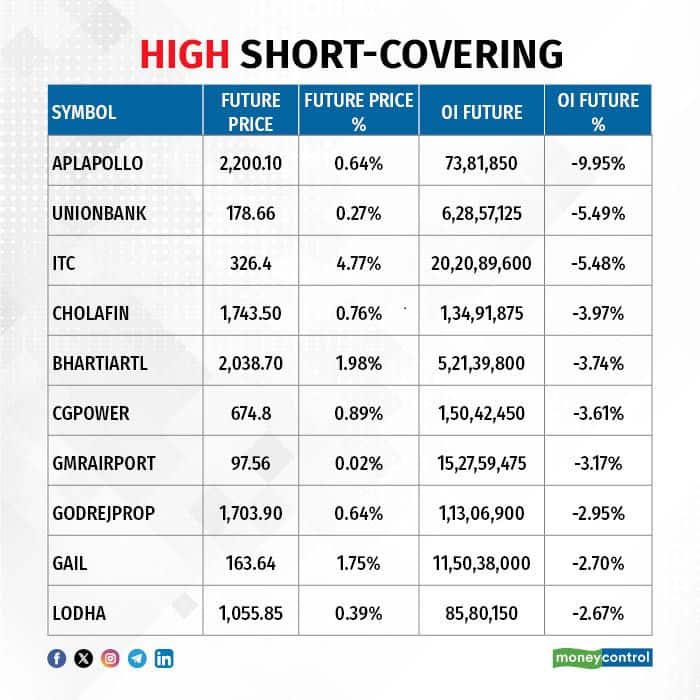
13) Short-Covering (47 Stocks)
47 stocks saw short-covering, meaning a decrease in OI, along with a price increase.
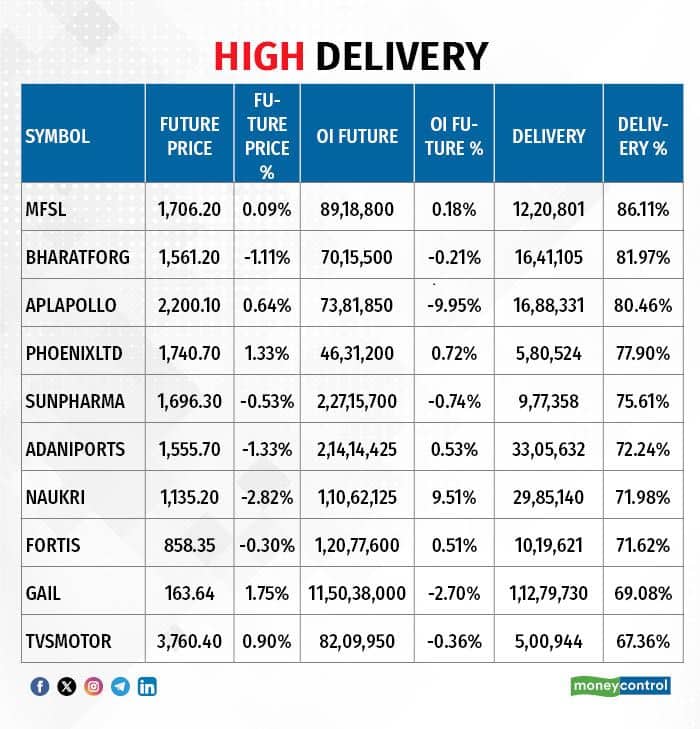
Here are the stocks that saw a high share of delivery trades. A high share of delivery reflects investing (as opposed to trading) interest in a stock.
Securities banned under the F&O segment include companies where derivative contracts cross 95 percent of the market-wide position limit.
Stocks added to F&O ban: Nil
Stocks retained in F&O ban: Sammaan Capital
Stocks removed from F&O ban: Nil
Disclaimer: The views and investment tips expressed by experts on Moneycontrol are their own and not those of the website or its management. Moneycontrol advises users to check with certified experts before taking any investment decisions.Disclaimer: Moneycontrol is a part of the Network18 group. Network18 is controlled by Independent Media Trust, of which Reliance Industries is the sole beneficiary.Discover the latest Business News, Sensex, and Nifty updates. Obtain Personal Finance insights, tax queries, and expert opinions on Moneycontrol or download the Moneycontrol App to stay updated!


Find the best of Al News in one place, specially curated for you every weekend.
Stay on top of the latest tech trends and biggest startup news.


