

The Nifty 50 rebounded sharply with a gap-up opening and clocked a 1.6 percent rally to hit a one-month high after a day of profit-booking-induced correction, with above-average volumes for another session on February 4. The strong resistance trendline breakout and the decisive closing above the 50 and 200-day EMAs by the index seem to have confirmed the negation of the previous lower highs-lower lows formation. Hence, if the index sustains above 23,600 (200-day EMA), a rally toward the 23,900-24,000 zone can't be ruled out in the upcoming sessions. However, 23,550 is likely to be immediate support, followed by 23,360 (10 or 20-day EMA), which remains a crucial support level, experts said.

Here are 15 data points we have collated to help you spot profitable trades:
1) Key Levels For The Nifty 50 (23,739)
Resistance based on pivot points: 23,771, 23,852, and 23,981
Support based on pivot points: 23,512, 23,432, and 23,302
Special Formation: The Nifty 50 formed a long bullish candlestick pattern on the daily charts after a gap-up opening. The index not only stayed strong above the 10 and 20-day EMAs (Exponential Moving Averages) but also surpassed the 50 and 200-day EMAs, with a positive bias in the momentum indicator RSI (Relative Strength Index) in the upper band. The index traded above the upper band of the Bollinger Bands and hit the long-falling resistance trendline (adjoining highs of September 27 and December 16, 2024), which is a positive sign.
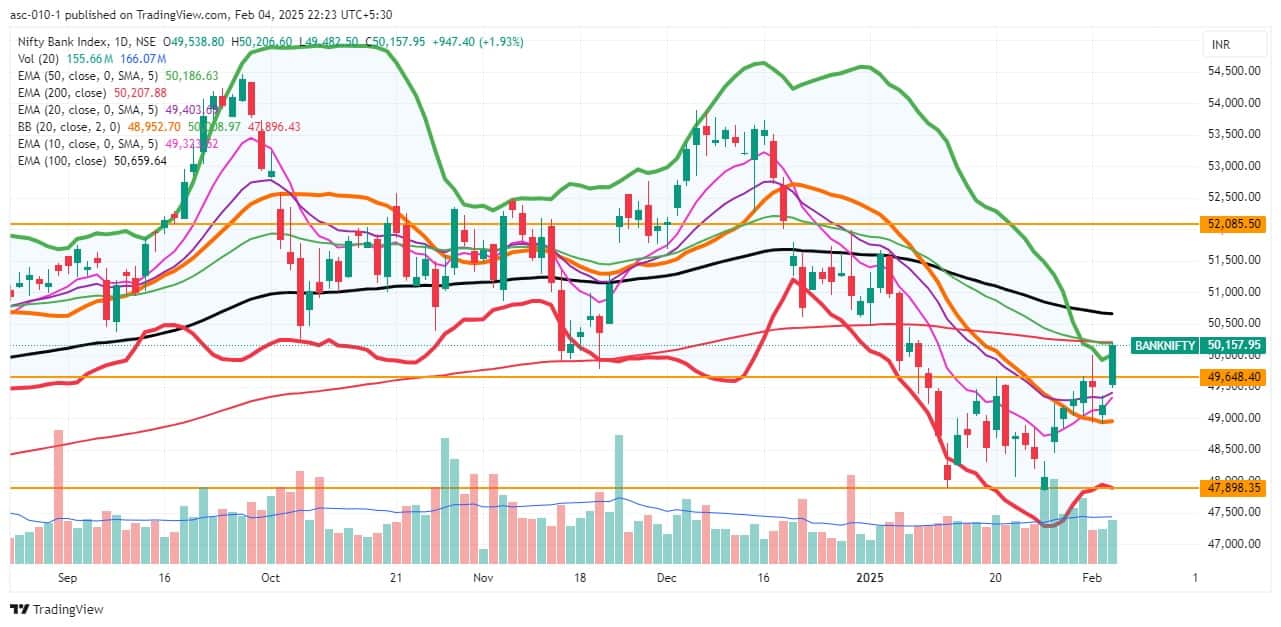
2) Key Levels For The Bank Nifty (50,158)
Resistance based on pivot points: 50,226, 50,396, and 50,673
Support based on pivot points: 49,672, 49,502, and 49,225
Resistance based on Fibonacci retracement: 50,369, 51,162
Support based on Fibonacci retracement: 47,875, 46,078
Special Formation: The Bank Nifty reported a long bullish candle after a gap-up opening, confirming the Tweezer Bottom pattern (a bullish reversal pattern) formation from the previous session. The index surpassed the high of Budget Day on a closing basis and recorded 1.93 percent gains. Further, the index closed above the upper band of the Bollinger Bands and moved closer to the 200-day EMA, with a positive bias in the momentum indicator RSI (55).
According to the weekly options data, the maximum Call open interest was seen at the 24,000 strike (with 1.52 crore contracts). This level can act as a key resistance for the Nifty in the short term. It was followed by the 24,500 strike (1.12 crore contracts) and the 23,800 strike (72.33 lakh contracts).
Maximum Call writing was observed at the 23,800 strike, which saw an addition of 14.14 lakh contracts, followed by the 24,150 and 24,050 strikes, which added 6.09 lakh and 2.98 lakh contracts, respectively. The maximum Call unwinding was seen at the 23,500 strike which shed 70.39 lakh contracts, followed by the 23,600 and 24,000 strikes which shed 31.25 lakh and 29.85 lakh contracts, respectively.
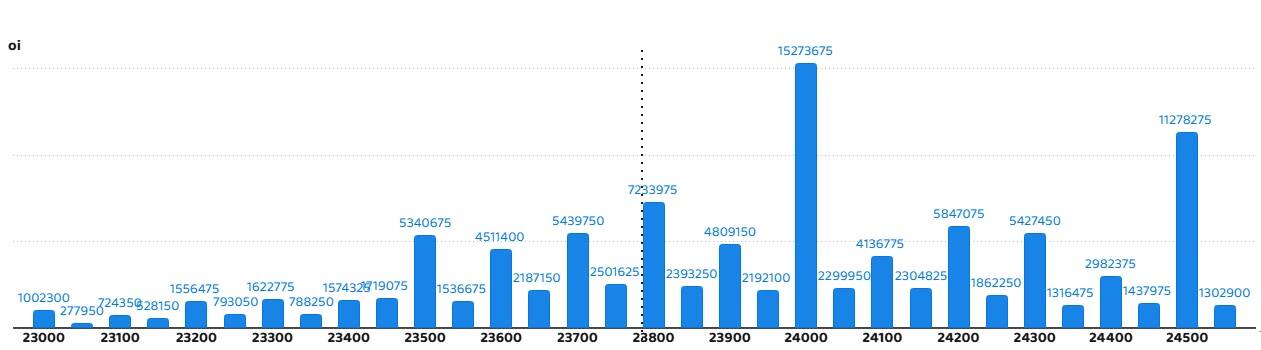
On the Put side, the 23,000 strike holds the maximum Put open interest (with 1.24 crore contracts), which can act as a key support level for the Nifty. It was followed by the 23,500 strike (1.05 crore contracts) and the 23,400 strike (78.28 lakh contracts).
The maximum Put writing was placed at the 23,500 strike, which saw an addition of 64.11 lakh contracts, followed by the 23,600 and 23,700 strikes, which added 47.05 lakh and 43.33 lakh contracts, respectively. The maximum Put unwinding was seen at the 23,200 strike, which shed 5.76 lakh contracts, followed by the 24,000 and 24,500 strikes, which shed 1.08 lakh and 25,125 contracts, respectively.

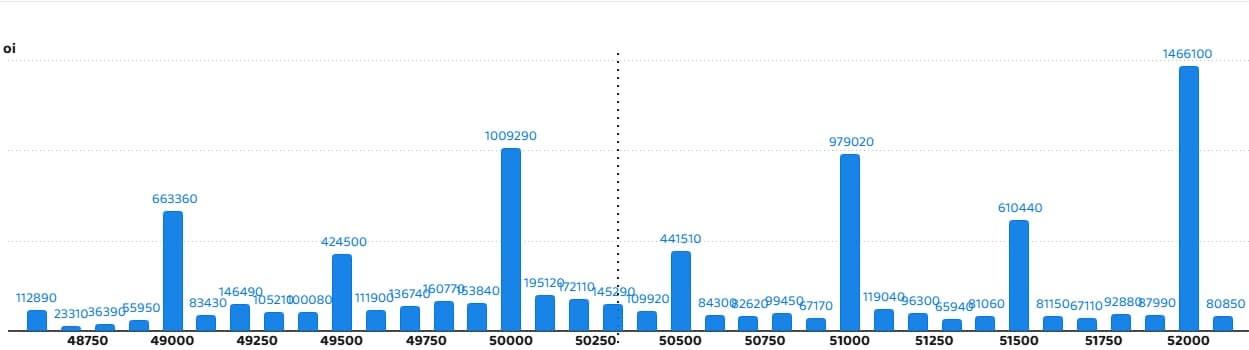
5) Bank Nifty Call Options Data
According to the monthly options data, the maximum Call open interest was seen at the 52,000 strike, with 14.66 lakh contracts. This can act as a key resistance level for the index in the short term. It was followed by the 50,000 strike (10.09 lakh contracts) and the 51,000 strike (9.79 lakh contracts).
Maximum Call writing was visible at the 50,100 strike (with the addition of 81,990 contracts), followed by the 50,200 strike (70,470 contracts) and the 48,600 strike (59,370 contracts). The maximum Call unwinding was seen at the 51,000 strike, which shed 3.08 lakh contracts, followed by the 49,500 and 49,200 strikes, which shed 1.54 lakh and 93,030 contracts, respectively.
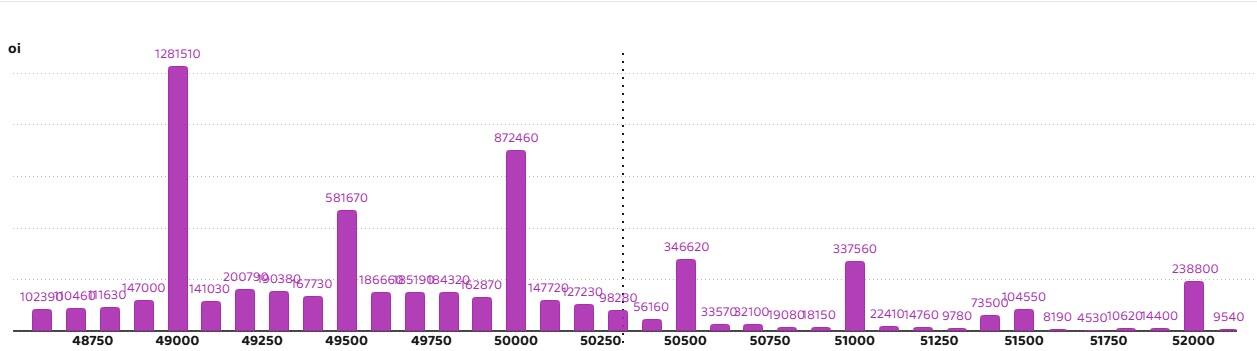
6) Bank Nifty Put Options Data
On the Put side, the 49,000 strike holds the maximum Put open interest (with 12.81 lakh contracts), which can act as a key support level for the index. This was followed by the 50,000 strike (8.72 lakh contracts) and the 49,500 strike (5.81 lakh contracts).
The maximum Put writing was observed at the 50,000 strike (which added 2.4 lakh contracts), followed by the 49,500 strike (1.03 lakh contracts) and the 50,100 strike (91,980 contracts). The maximum Put unwinding was seen at the 49,200 strike, which shed 31,230 contracts, followed by the 48,900 strike which shed 360 contracts.
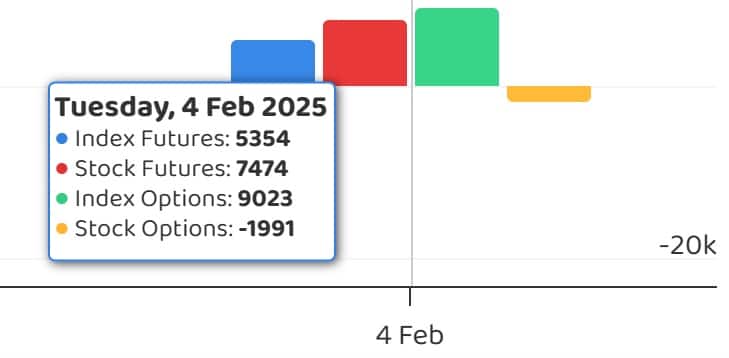
7) Funds Flow (Rs crore)
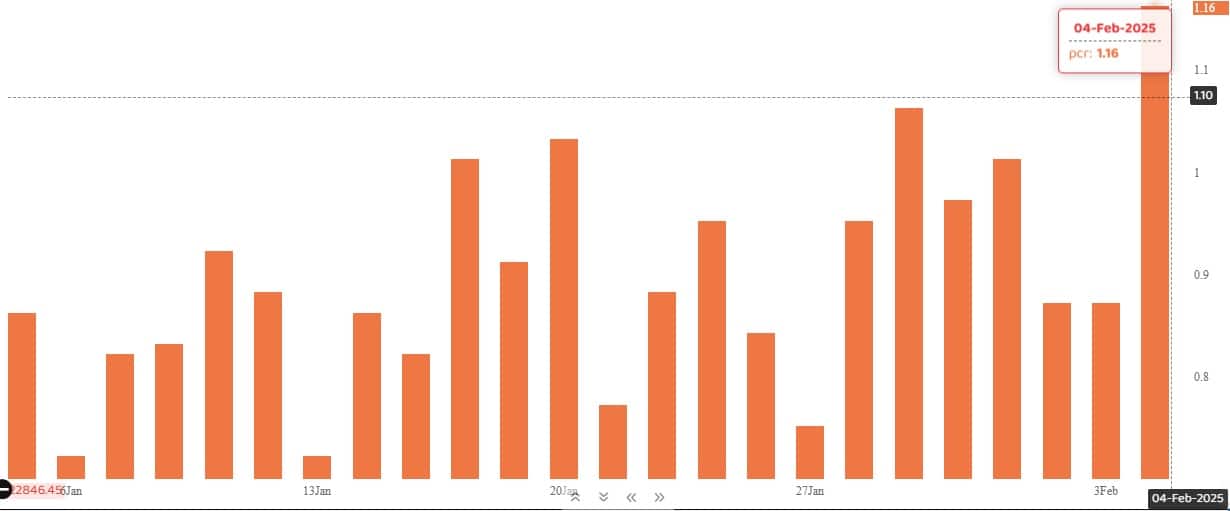
The Nifty Put-Call ratio (PCR), which indicates the mood of the market, spiked to 1.16 on February 4 (the highest level since January 2), against 0.87 in the previous session.
The increasing PCR, or being higher than 0.7 or surpassing 1, means traders are selling more Put options than Call options, which generally indicates the firming up of a bullish sentiment in the market. If the ratio falls below 0.7 or moves towards 0.5, then it indicates selling in Calls is higher than selling in Puts, reflecting a bearish mood in the market.
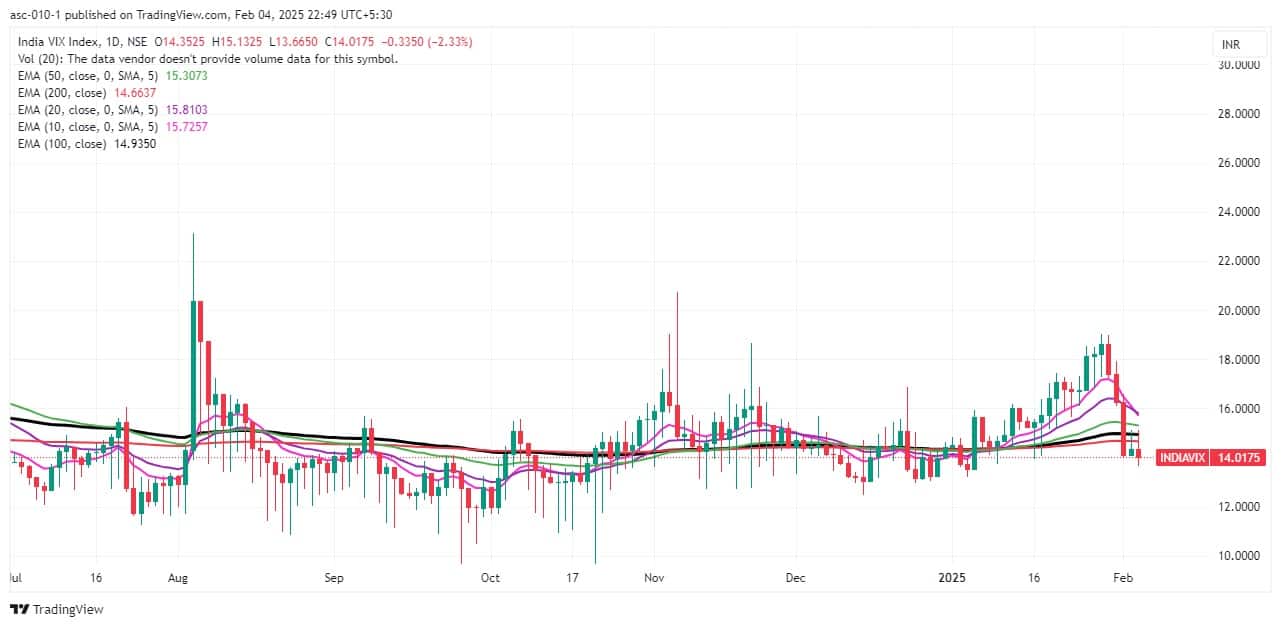
9) India VIX
The volatility index, India VIX, which measures the expected market volatility, remained in the lower zone, falling by 2.33 percent to 14.02, the lowest closing level since January 3, providing further comfort for the bulls.
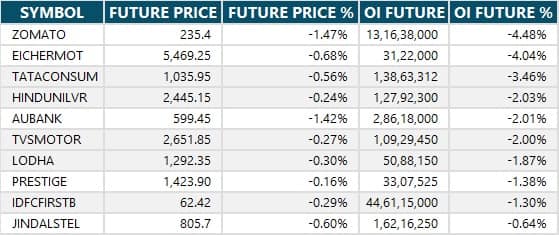
10) Long Build-up (100 Stocks)
A long build-up was seen in 100 stocks. An increase in open interest (OI) and price indicates a build-up of long positions.
11) Long Unwinding (16 Stocks)
16 stocks saw a decline in open interest (OI) along with a fall in price, indicating long unwinding.
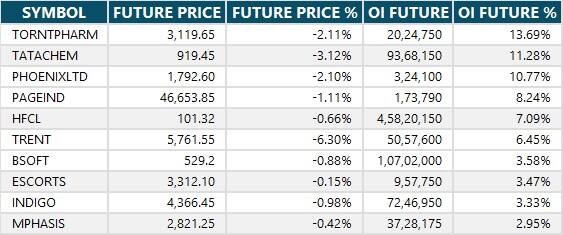
12) Short Build-up (29 Stocks)
29 stocks saw an increase in OI along with a fall in price, indicating a build-up of short positions.
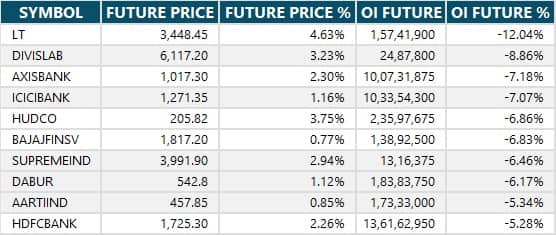
13) Short-Covering (85 Stocks)
85 stocks saw short-covering, meaning a decrease in OI, along with a price increase.
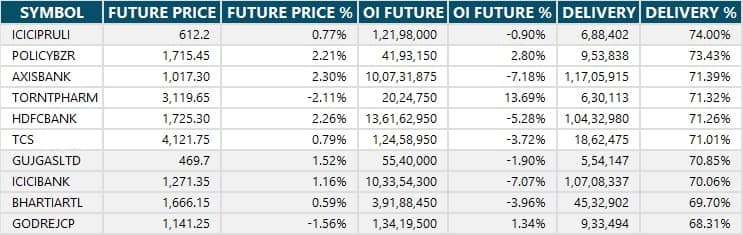
Here are the stocks that saw a high share of delivery trades. A high share of delivery reflects investing (as opposed to trading) interest in a stock.
Securities banned under the F&O segment include companies where derivative contracts cross 95 percent of the market-wide position limit.
Stocks added to F&O ban: Nil
Stocks retained in F&O ban: Nil
Stocks removed from F&O ban: Nil
Disclaimer: The views and investment tips expressed by experts on Moneycontrol are their own and not those of the website or its management. Moneycontrol advises users to check with certified experts before taking any investment decisions.Disclosure: Moneycontrol is a part of the Network18 group. Network18 is controlled by Independent Media Trust, of which Reliance Industries is the sole beneficiary.Discover the latest Business News, Sensex, and Nifty updates. Obtain Personal Finance insights, tax queries, and expert opinions on Moneycontrol or download the Moneycontrol App to stay updated!
Find the best of Al News in one place, specially curated for you every weekend.
Stay on top of the latest tech trends and biggest startup news.


